
Classification and evolution (4.2.2)
On this page
Taxonomic hierarchy is a system of classification that organises living organisms into progressively smaller and more specific groups that do not overlap.
Each level in the hierarchy is known as a taxon (plural: taxa). The main levels of the taxonomic hierarchy are:
- Domain
- Kingdom
- Phylum
- Class
- Order
- Family
- Genus
- Species.
The binomial naming system is a universal system for naming organisms. Every species is given a unique two-part Latin name consisting of its genus and species, e.g., Homo sapiens.
The genus name begins with a capital letter, the species name is lowercase, and both are written in italics (or underlined if handwritten).
The binomial system provides a standardised, internationally recognised name for each species, avoiding confusion caused by different common names, and reflects relationships between organisms through shared genera.
Organisms are grouped into five kingdoms: Prokaryotae, Protoctista, Fungi, Plantae, and Animalia based on the features used to classify them.
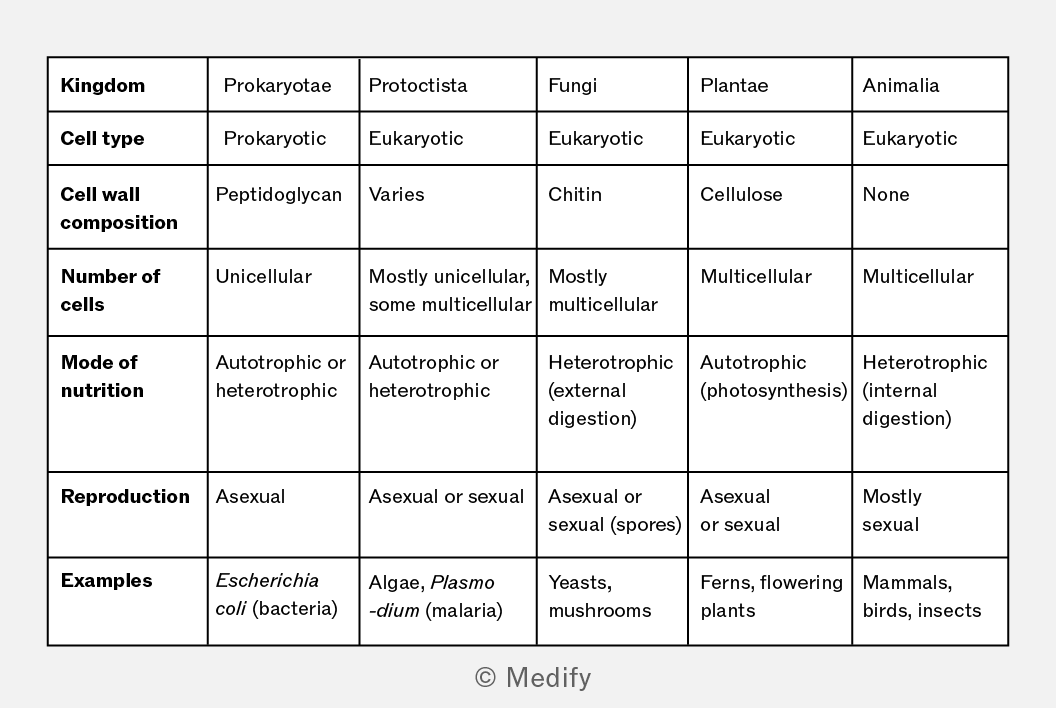
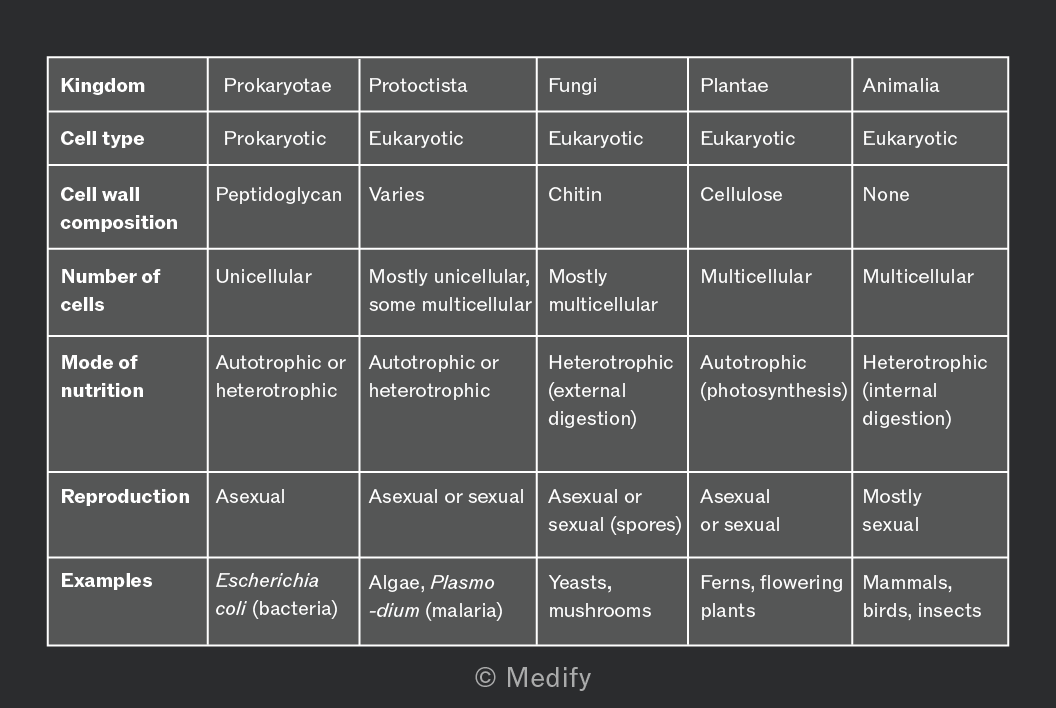
A domain is the highest taxonomic rank in biological classification.
The three domain system distinguishes organisms based on fundamental differences in their cell structure and genetic makeup.
The three domains are:
- Eubacteria – single–celled prokaryotic organisms with simple structures.
- Archaea – single–celled prokaryotes that differ from eubacteria in their cell wall composition, membrane lipids, and genetic characteristics.
- Eukarya – organisms with eukaryotic cells containing a membrane–bound nucleus and organelles, including plants, animals, fungi, and protists.
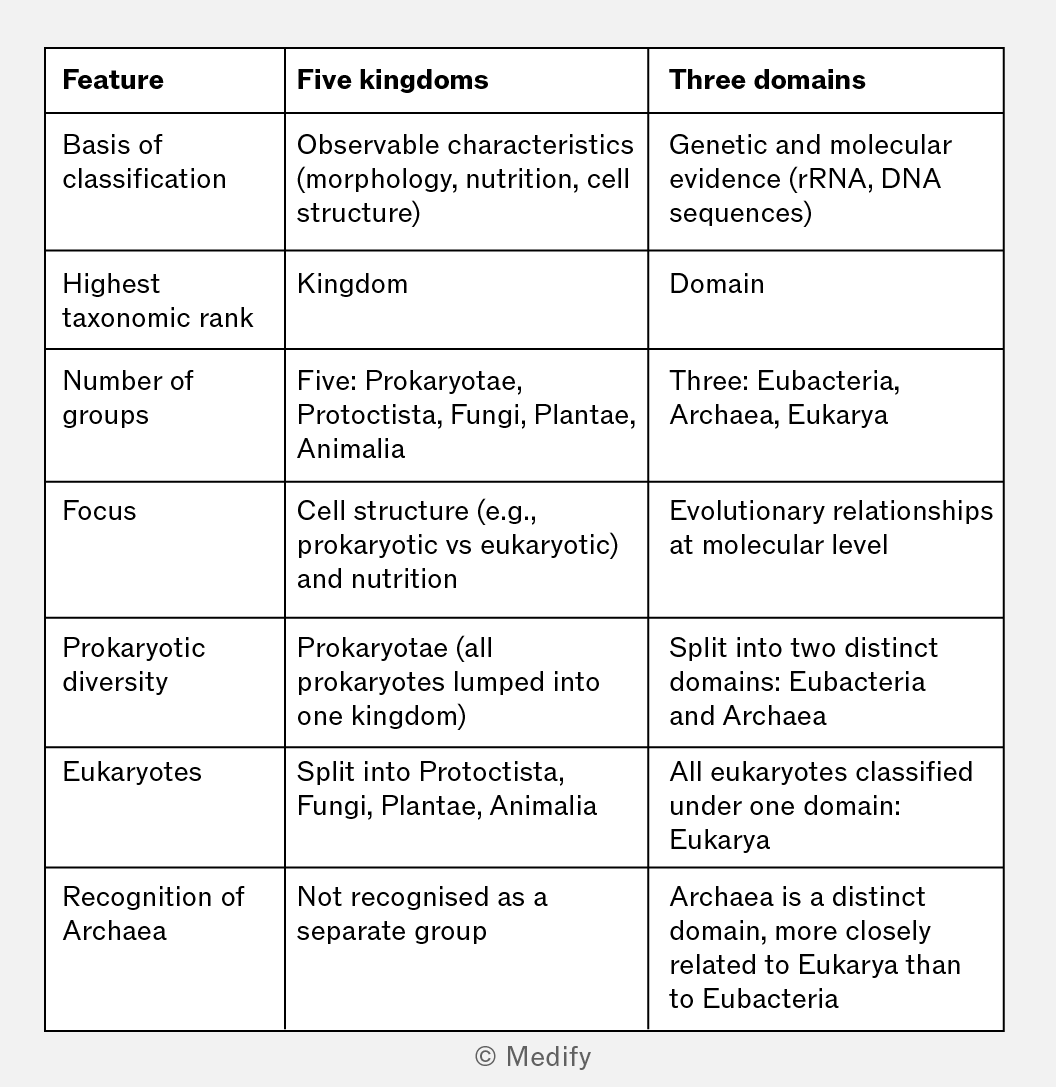
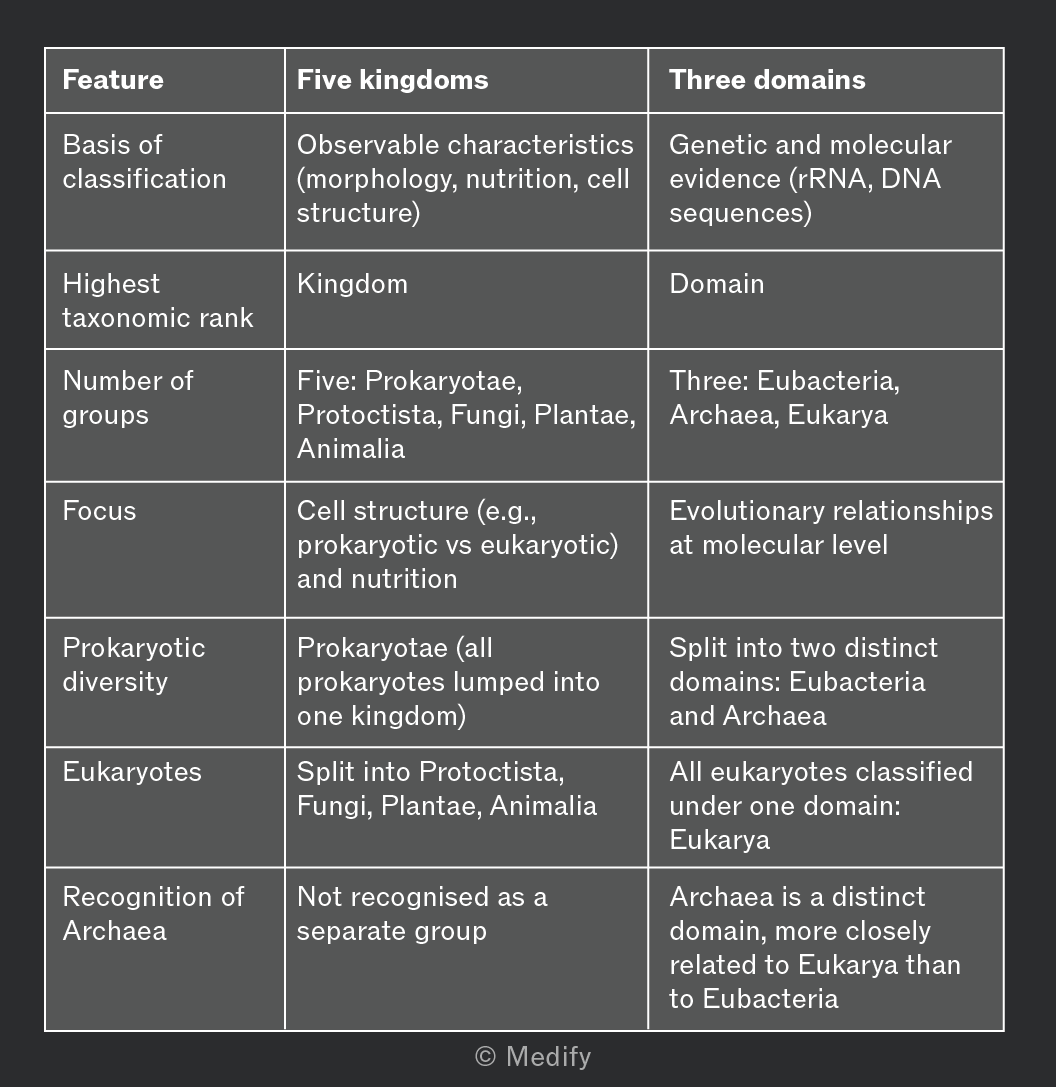
The five-kingdom and three-domain systems differ fundamentally in their approaches to classification:
- The five-kingdom system is based on observable traits, while the three-domain system relies on molecular evidence, such as rRNA sequences.
- Prokaryotes, classed together in the kingdom Prokaryotae under the five-kingdom system, are split into two distinct domains, Eubacteria and Archaea, in the three-domain system, reflecting their significant genetic differences.
- Eukaryotes, divided into four kingdoms (Protoctista, Fungi, Plantae, and Animalia) in the five-kingdom system, are unified under the domain Eukarya in the three-domain system.
Artificial classification groups organisms based on a limited set of observable characteristics, such as appearance or behaviour.
This system does not reflect evolutionary relationships between organisms.
This method is commonly used to create identification keys, such as dichotomous keys, where organisms are identified quickly using visible characteristics.
Artificial classification is straightforward and easy to use, making it useful for species identification, but it lacks biological information because organisms with similar features may not be closely related.
Natural classification groups organisms based on a wide range of characteristics, including genetic, biochemical, anatomical, and morphological traits.
This method reflects evolutionary relationships, showing how species have evolved from common ancestors over time.
This method of classification is adaptable and can be revised as new scientific evidence becomes available.
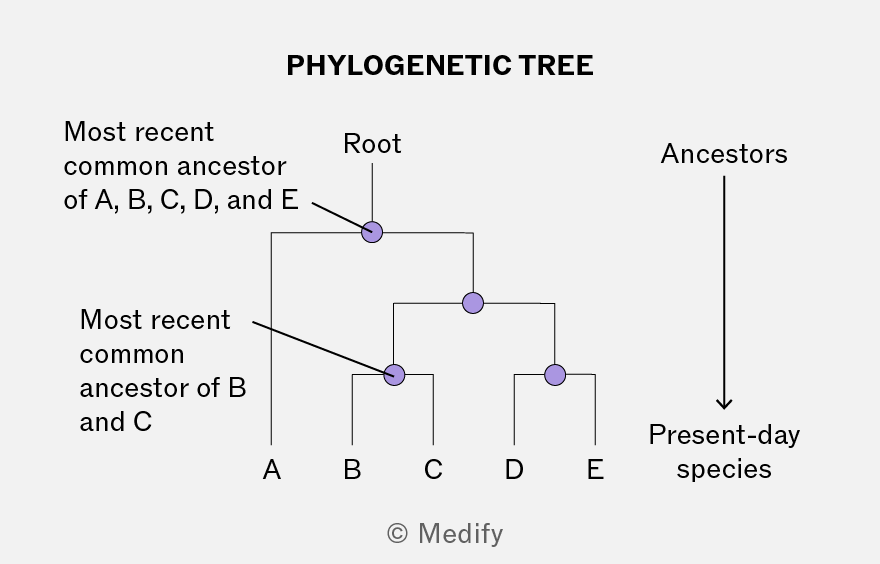
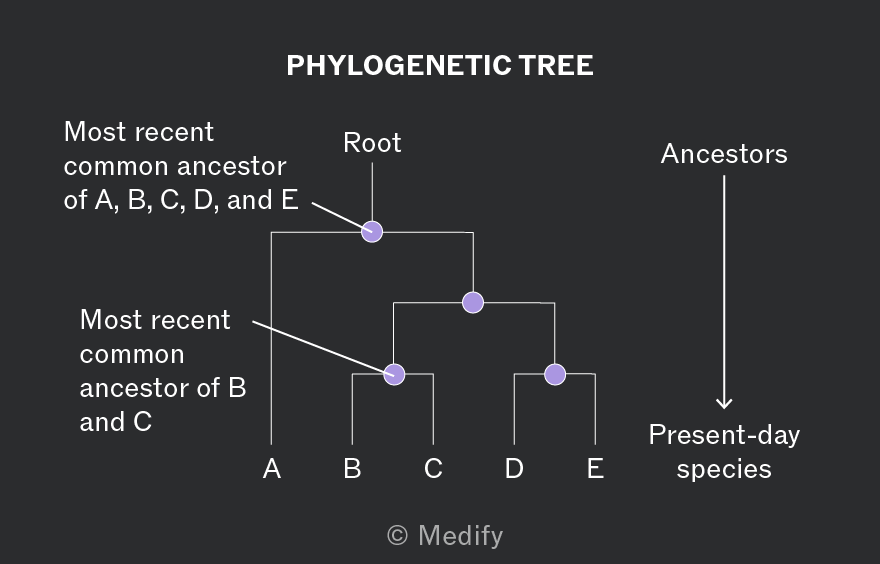
Phylogeny refers to the evolutionary history and relationships among species. It shows how species have evolved and diverged from common ancestors over time.
Phylogenetic trees (or evolutionary trees) are diagrams that represent these relationships.
Modern classification systems are increasingly based on phylogenetic relationships, using evidence from DNA, RNA, proteins, and other biological molecules to reflect evolutionary history rather than relying only on observable characteristics.
Convergent evolution occurs when unrelated species evolve similar adaptations because they are exposed to similar environmental selection pressures, rather than because they share a recent common ancestor.
The evolutionary relationships between species can be determined by comparing biological molecules, such as DNA, RNA, or proteins, which are found in all living organisms.
Species with more similar biological molecules are more closely related because they share a more recent common ancestor. Differences in these molecules arise through mutations that accumulate over time during evolution.
Cytochrome c is a protein involved in aerobic respiration and is found in almost all organisms that respire aerobically. The amino acid sequence of cytochrome c can be compared between species to determine their evolutionary relationships.
Species with more similar amino acid sequences are more closely related because they share a more recent common ancestor.
Species with more differences in the amino acid sequence of cytochrome c are less closely related, as more mutations have accumulated since they diverged from a common ancestor.
By comparing gene sequences and entire genomes, scientists can determine the evolutionary relationships between organisms at the genetic level.
Highly conserved genes, such as the genes that code for ribosomal RNA (rRNA), provide a powerful tool for classification because they change very slowly over time. The more similar the DNA sequences of two species, the more closely related they are, as they share a more recent common ancestor.
Evolution by natural selection is a theory which suggests how species change over time.
Organisms with advantageous traits are more likely to survive and reproduce, passing on their traits to the next generation.
These changes make species become incrementally better suited to their environment.
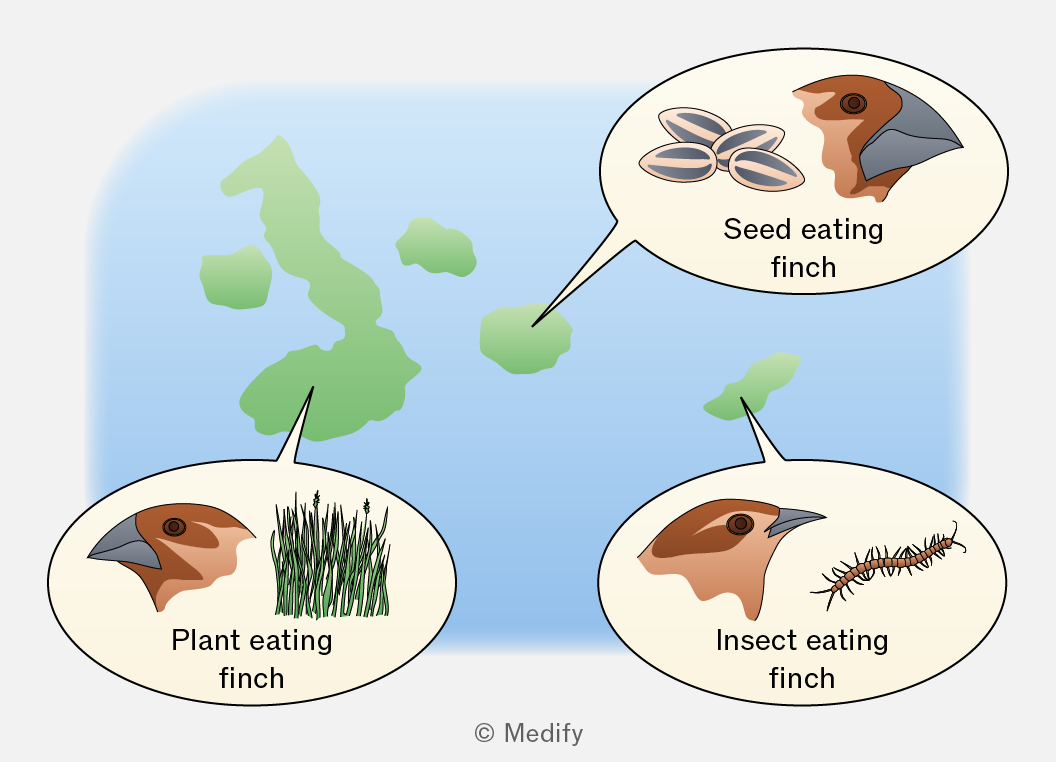
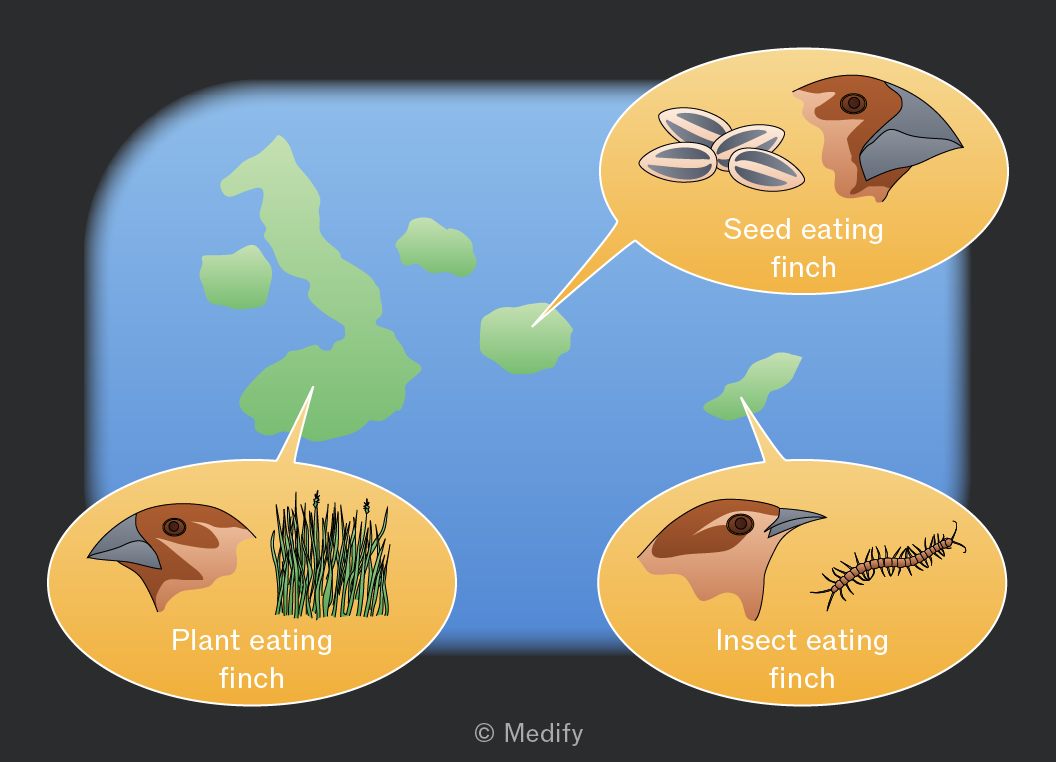
Darwin observed that Galápagos finches were similar to each other and to mainland species, suggesting common ancestry.
Each island had finches with distinct beak and claw shapes suited to the food available there, showing that local environmental conditions selected for particular features.
Darwin bred pigeons, selecting individuals with desired characteristics each generation. This artificial selection demonstrated that traits could change over generations, supporting his idea that nature could do the same – natural selection.
Darwin and Wallace independently formulated the theory of evolution by natural selection.
Both proposed that variation exists within populations, and individuals with advantageous traits are more likely to survive, reproduce and pass on those traits.
In 1858, they submitted papers to the Linnean Society, having independently derived the same mechanism. Darwin went on to publish On the Origin of Species in 1859.
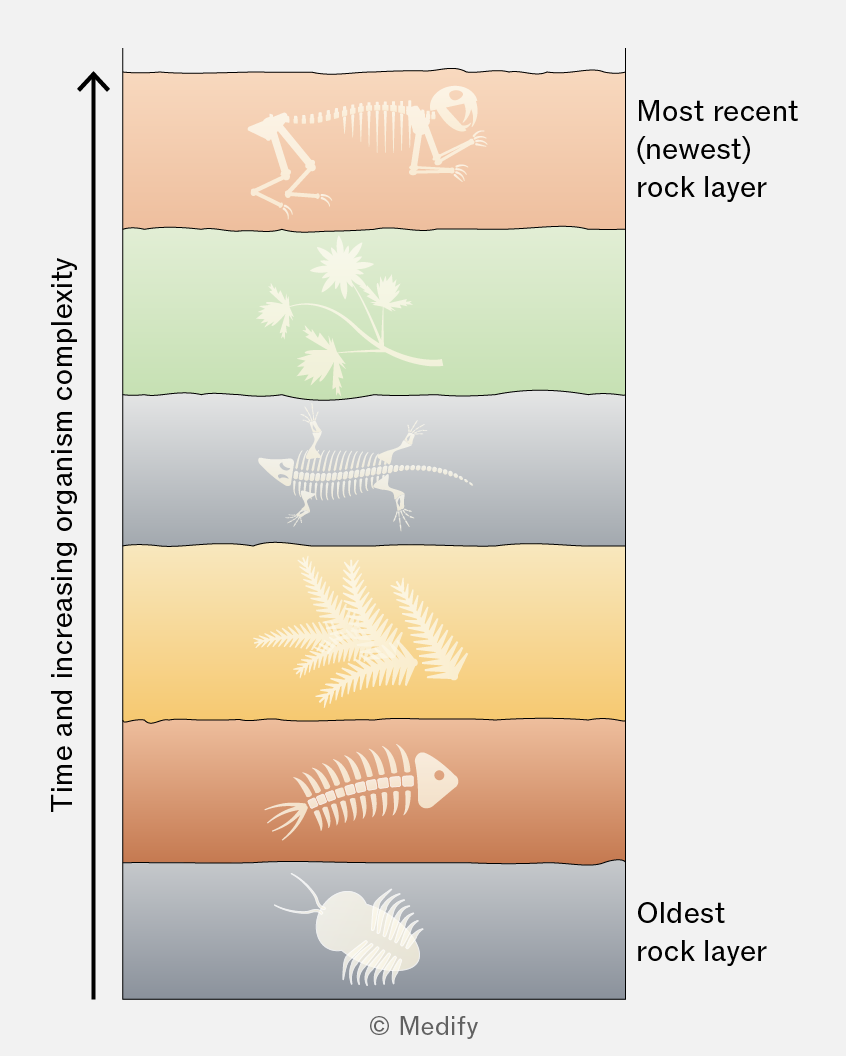
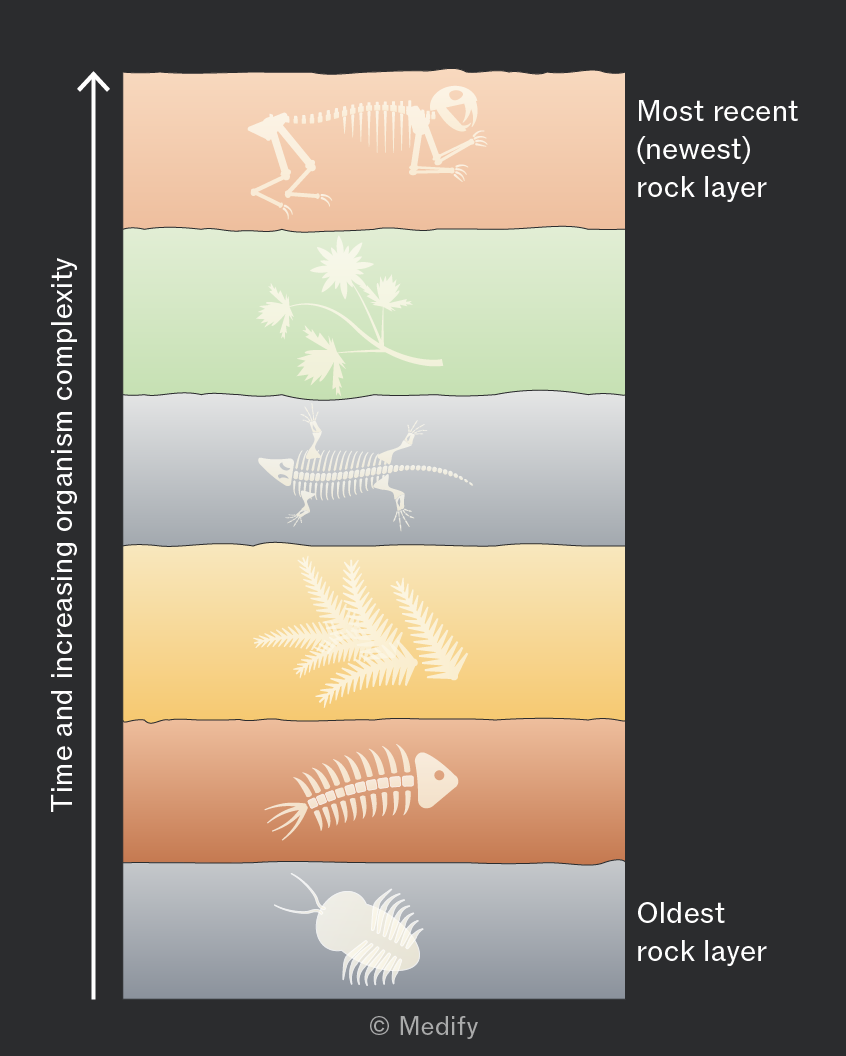
The global fossil record provides evidence for evolution:
- Fossils show that organisms have increased in complexity over time.
- The age order of fossils makes ecological sense, with organisms appearing in a logical sequence.
- Structural similarities between fossils can reveal relatedness, allowing scientists to trace evolutionary lineages.
- Fossils also enable relationships between extinct and living organisms to be investigated, supporting common ancestry.
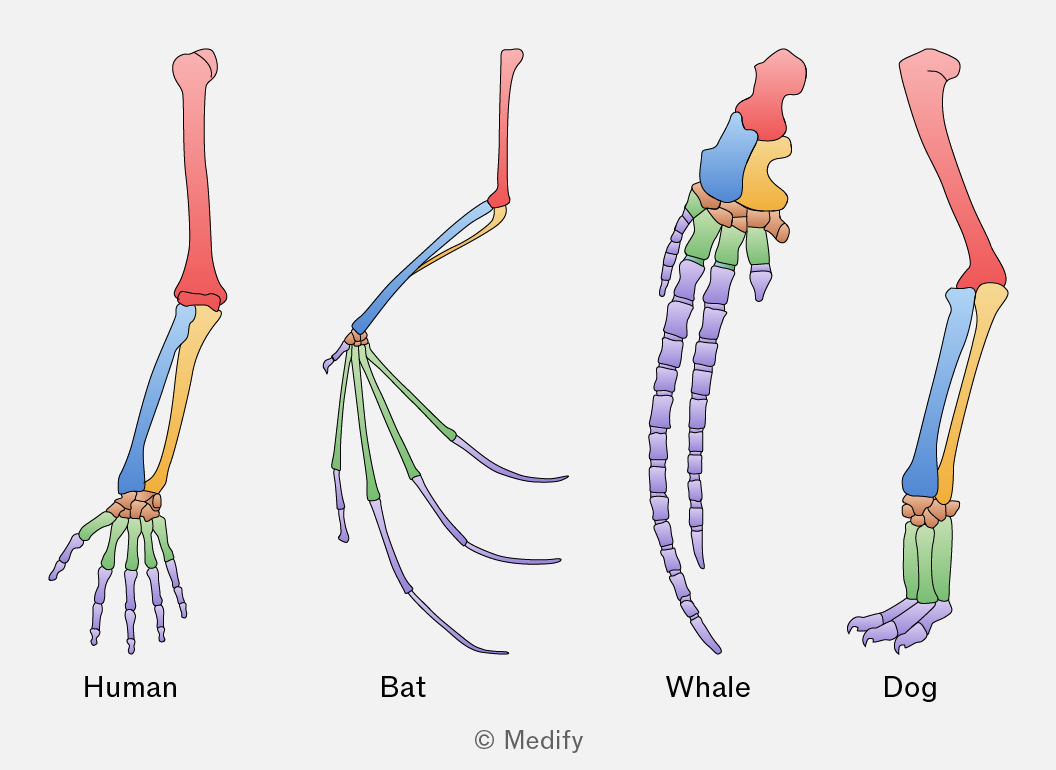
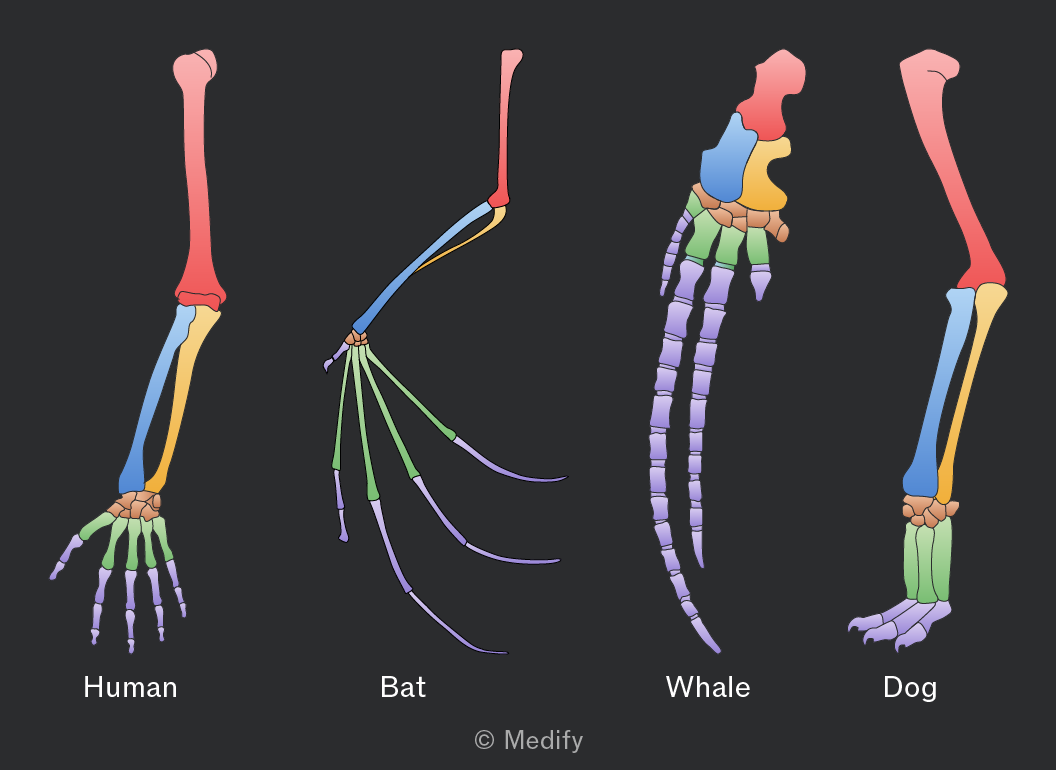
Comparative anatomy provides evidence of evolution by revealing similarities in the underlying structure of organisms that suggest common ancestry.
Homologous structures are features found in different species inherited from a shared ancestor but adapted for different functions e.g., the pentadactyl limb in humans, bats, whales and dogs.
These differences arise through divergent evolution, where species adapt to different environments over time, modifying the same basic structure for different purposes.
Comparative biochemistry provides evidence of evolution by revealing similarities in molecules that support life.
Comparing conserved sequences, such as cytochrome c (a respiratory protein) and ribosomal RNA, across species shows that more closely related species have more similar sequences.
Neutral mutations accumulate at an approximately constant rate (molecular clock), so the number of sequence differences can be used to estimate divergence time; more differences indicate a more distant common ancestor.
Variation is the difference between traits of individual organisms of the same species or from different species.
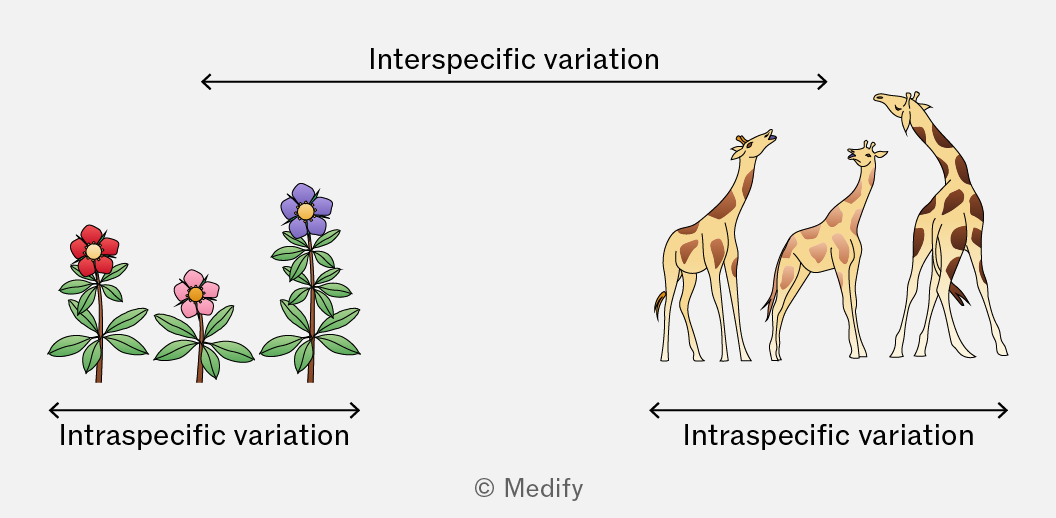
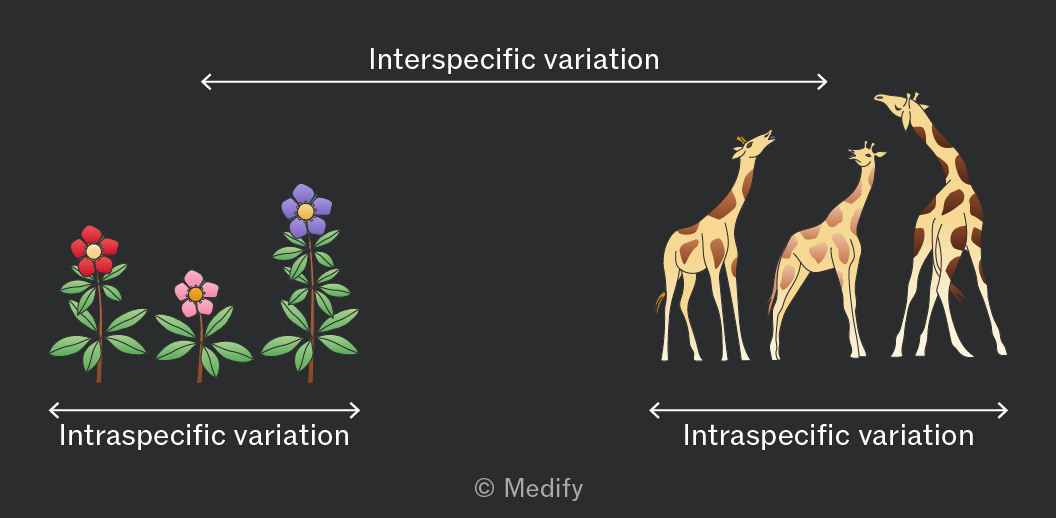
Interspecific variation is the differences between individuals from different species. This is the widest form of variation.
For example, a fish has scales and gills and a bird has feathers and lungs.
Intraspecific variation is the differences between individuals of the same species.
For example, different heights, blood groups, or eye colours in humans.
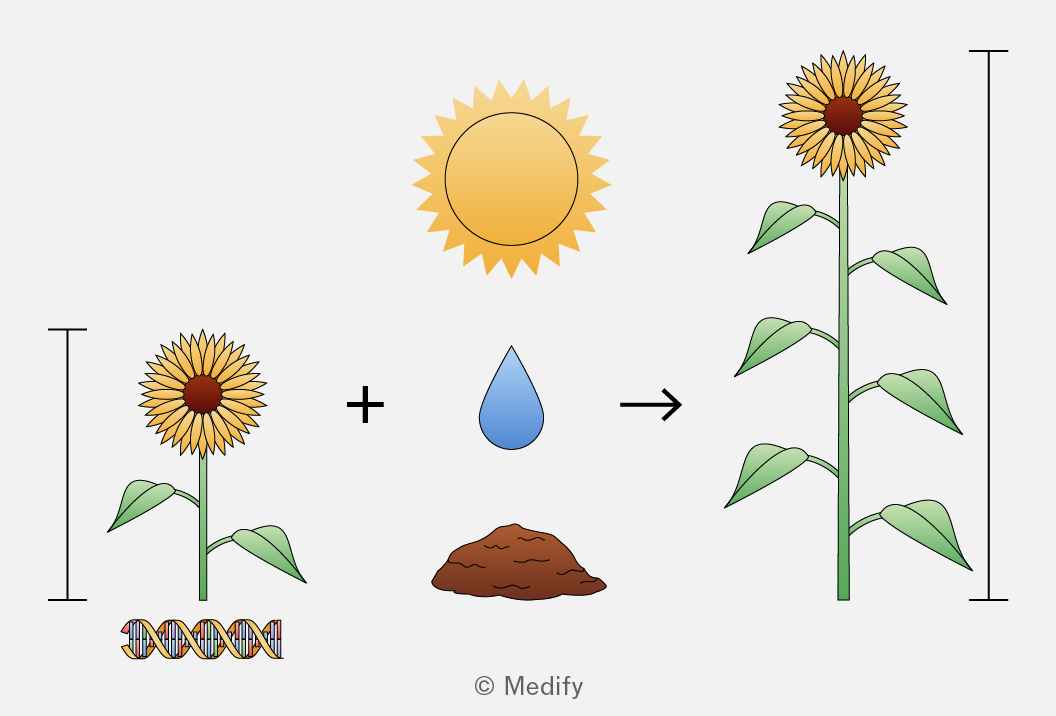
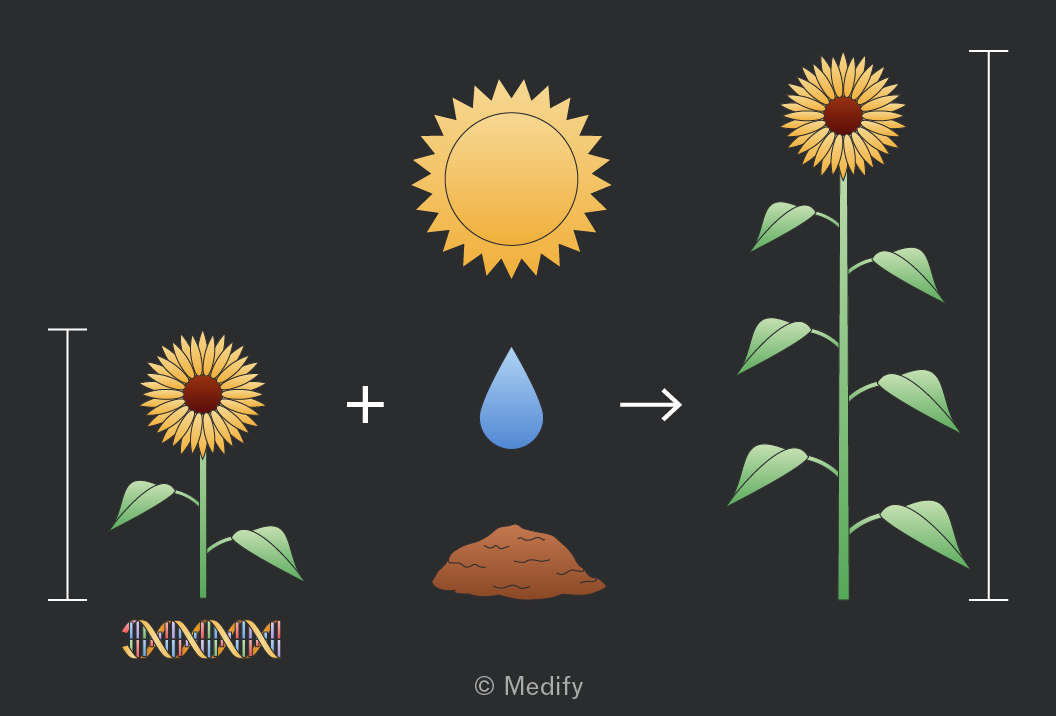
Variation in organisms’ phenotypes arises through their genes (inherited), their environment (not inherited) and a combination of these effects.
Genetic variation in a population arises from several sources:
- Mutation is the main source and generates new alleles.
- Alleles are gene variants that produce different phenotypes
- During meiosis, independent assortment shuffles chromosome combinations and crossing over between homologous chromosomes creates new allele combinations.
- Sexual reproduction results in offspring inheriting alleles from both parents
- Random fertilisation means offspring have a unique and unpredictable combination of alleles.
Environmentally caused variation is not inherited; it arises from different conditions organisms may experience.
For example, hydrangeas produce flowers of different colours depending on soil acidity.
Most variation results from a combination of both genetic and environmental influences.
For example, height in a sunflower is partially determined by genetics, but environmental factors such as hydration, soil quality, and hours of sunlight also affect growth.
Traits that show discontinuous variation are those that can only take discrete categories or values, with no intermediates.
These traits are always primarily genetically determined and usually controlled by a single gene.
Data associated with discrete traits is often presented on pie or bar charts.
Examples include blood group and flower colour.
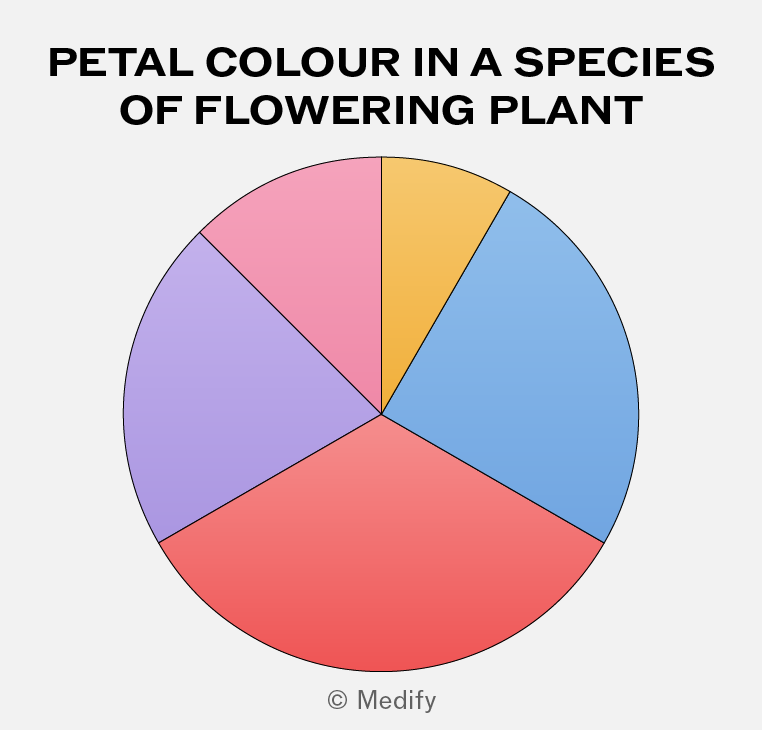
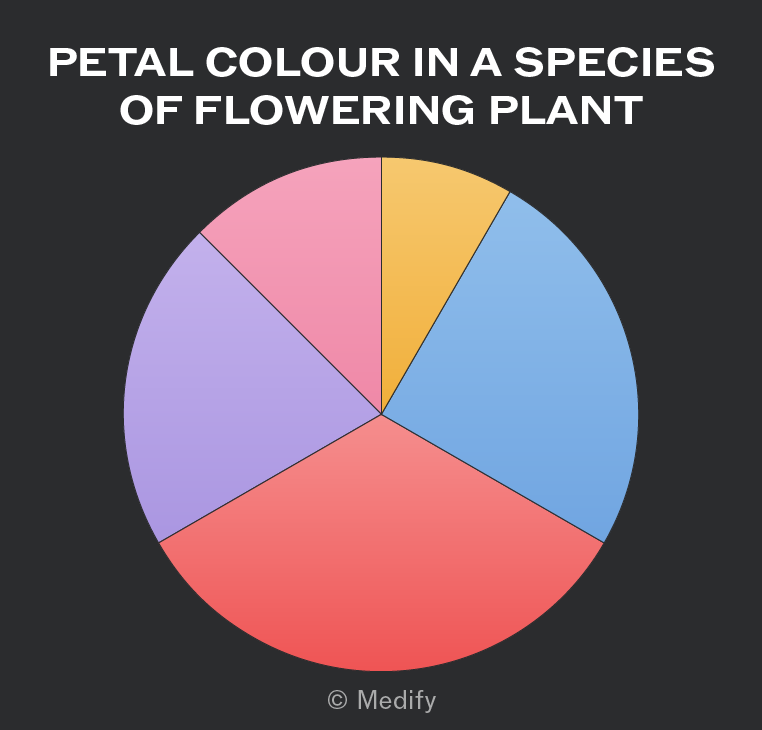
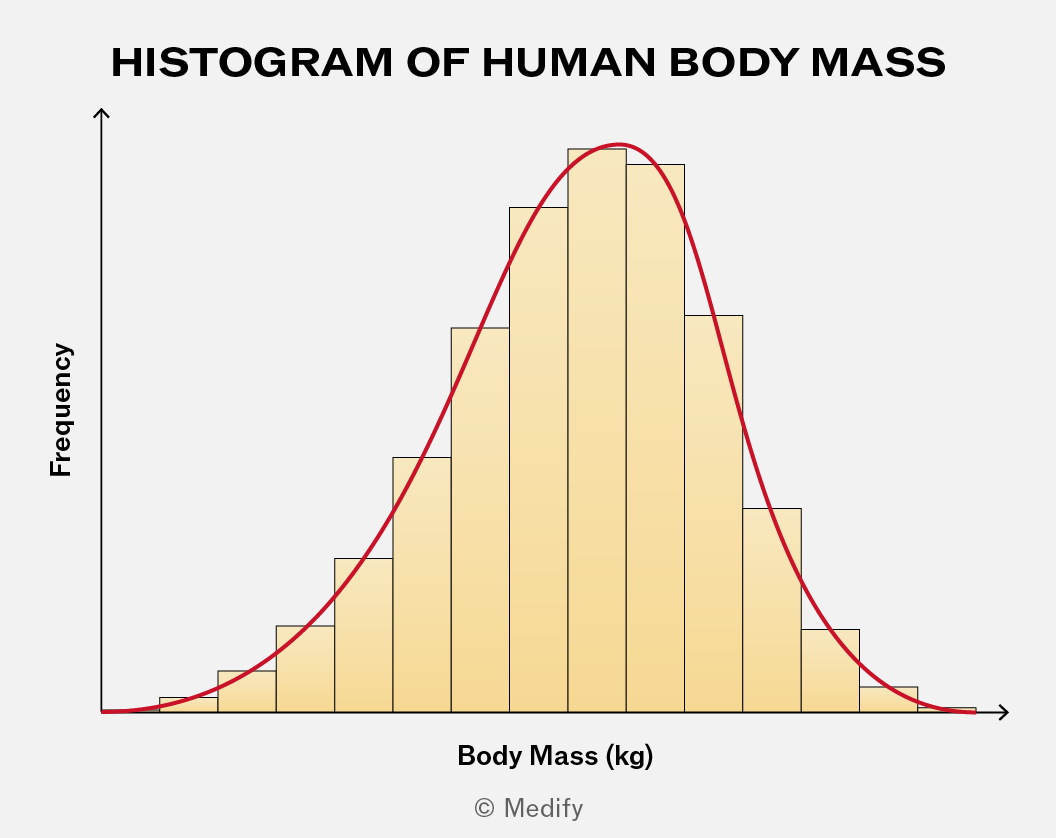
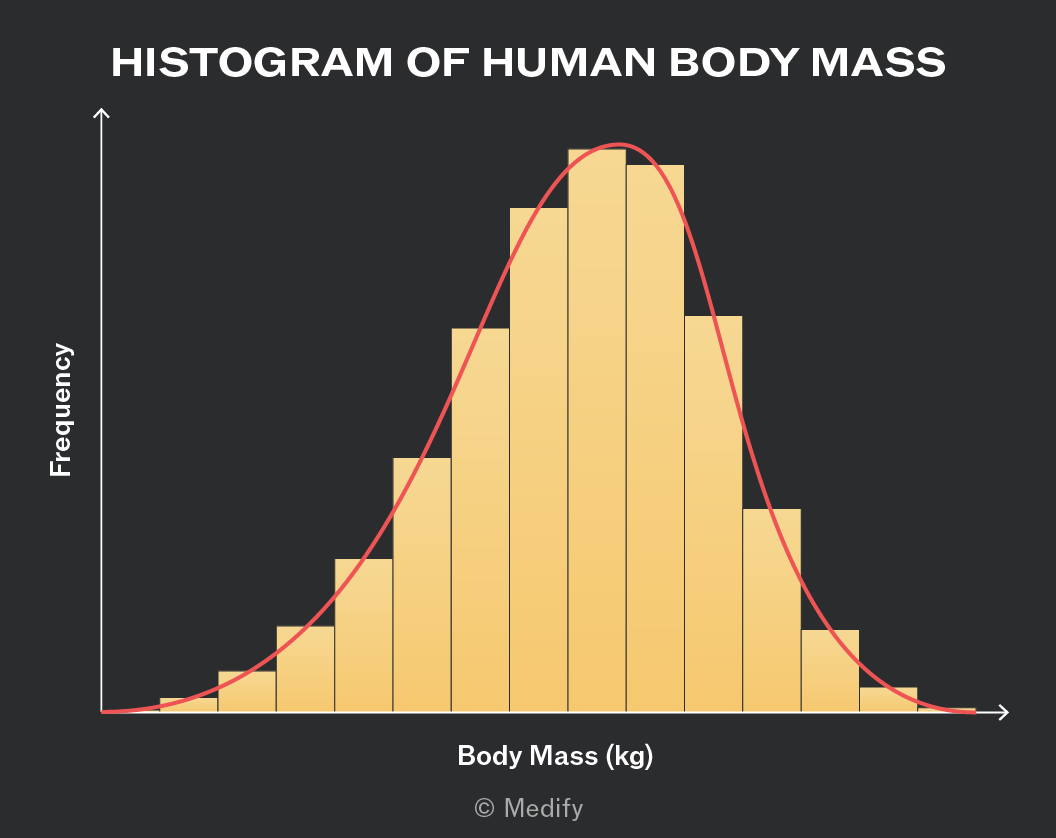
Traits that show continuous variation are those that can only take any value, along a continuum.
These traits are usually influenced by many genes (polygenic) and the environment.
Data can be plotted as a histogram and normally take the form of a normal distribution.
Examples include body mass and leaf length.
An adaptation is a feature that makes an organism specialised to exist in its environment. This makes an organism more likely to be successful, survive and reproduce.
Adaptations can be anatomical, behavioural, or physiological.
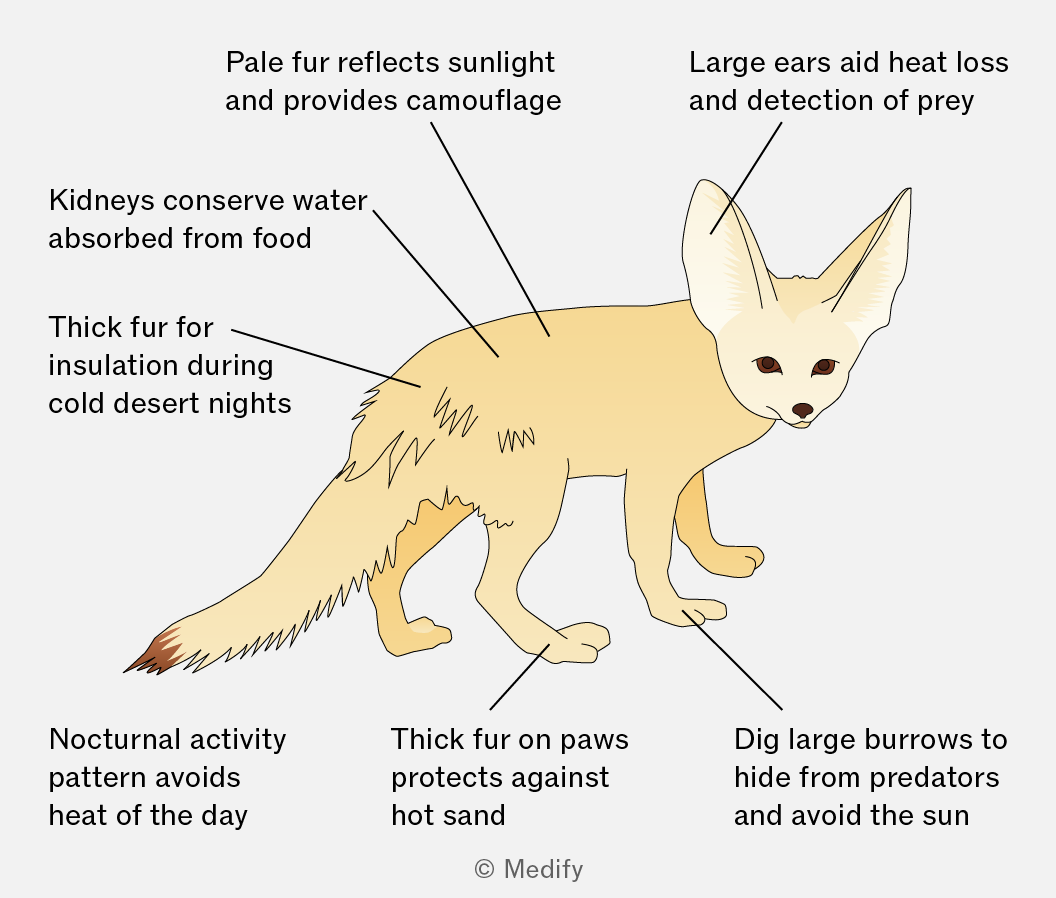
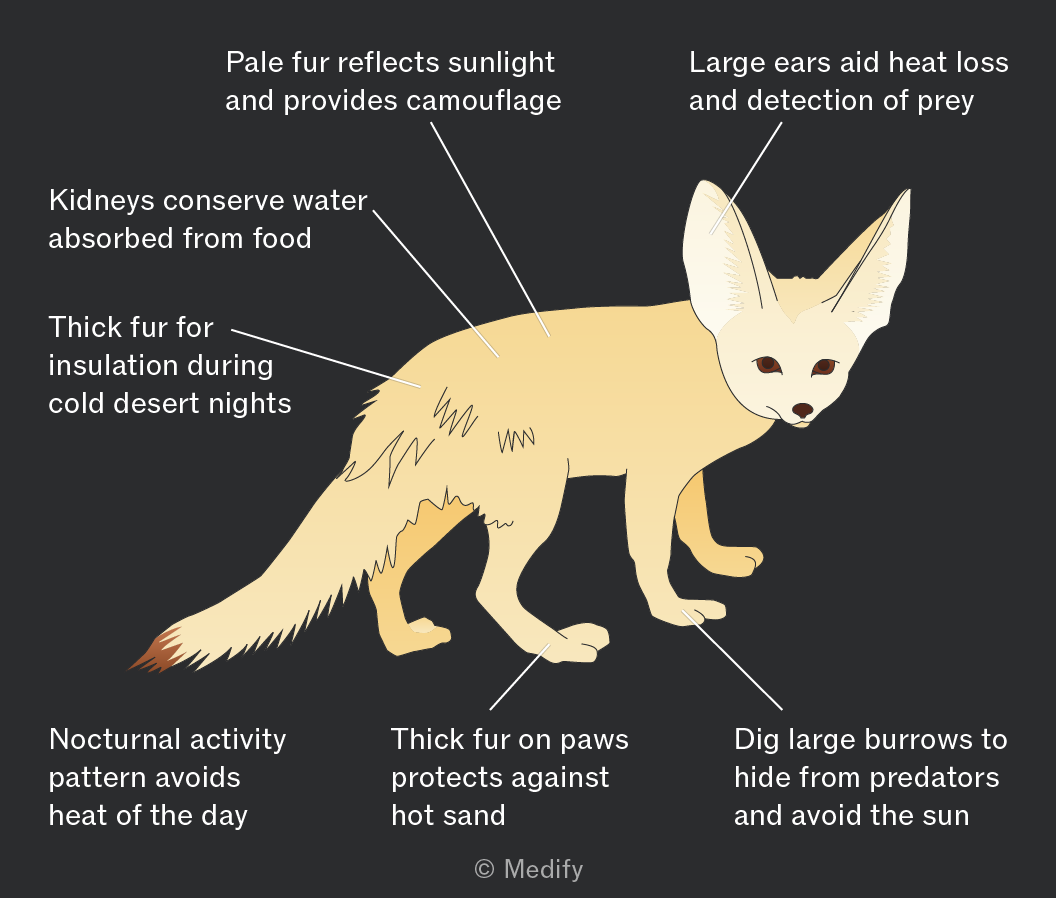
Anatomical (structural) adaptations are physical features of an organism that increase their likelihood of survival. They can be internal or external.
Examples include:
- Arctic hares have white fur in winter, which provides camouflage against snow and helps them avoid predators.
- Large ears in desert foxes facilitate heat loss.
- Spines on cacti reduce water loss and provide protection from herbivores.
Physiological (biochemical) adaptations are internal processes that increase chances of survival.
Examples include:
- Desert lizards make concentrated urine to conserve water.
- Bacteria in hot springs have heat–stable enzymes.
- Some plants produce antifreeze proteins to survive freezing temperatures.
Behavioural adaptations are ways an organism acts to aid survival. These can be learned or inherited.
Examples include:
- Swallows migrate south in winter to avoid food shortages in northern ranges.
- Nocturnal desert animals avoid daytime heat.
- Penguins huddle together to conserve heat.
Analogous structures have similar functions but different evolutionary origins, arising independently in unrelated, or very distantly related species.
This occurs through convergent evolution, where different species face similar selection pressures in similar environments and evolve similar adaptations.
For example, the wings of birds and insects both enable flight but evolved independently from different structures.
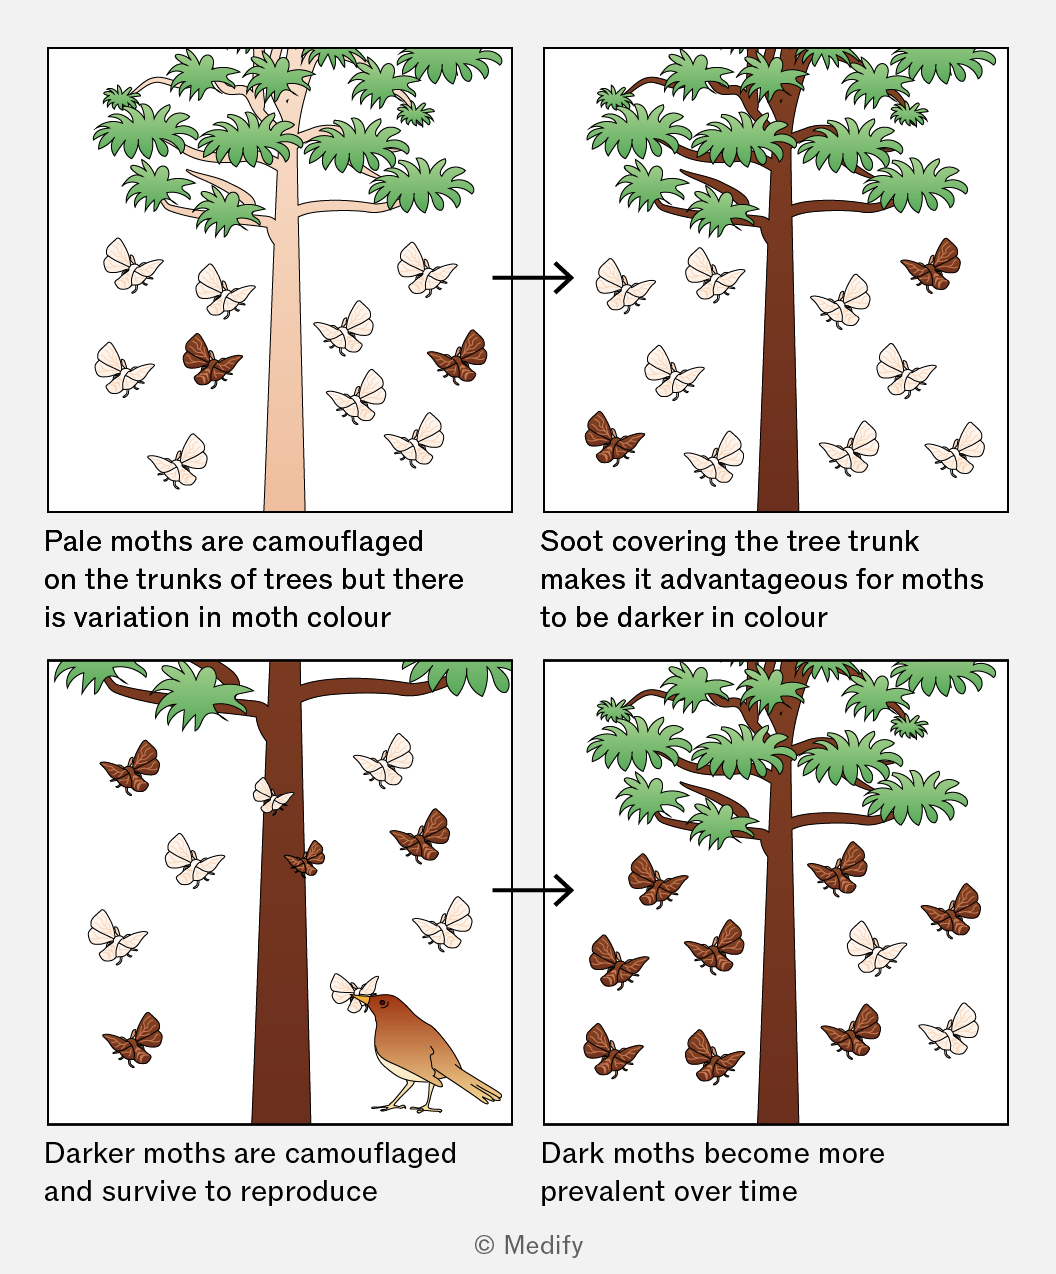
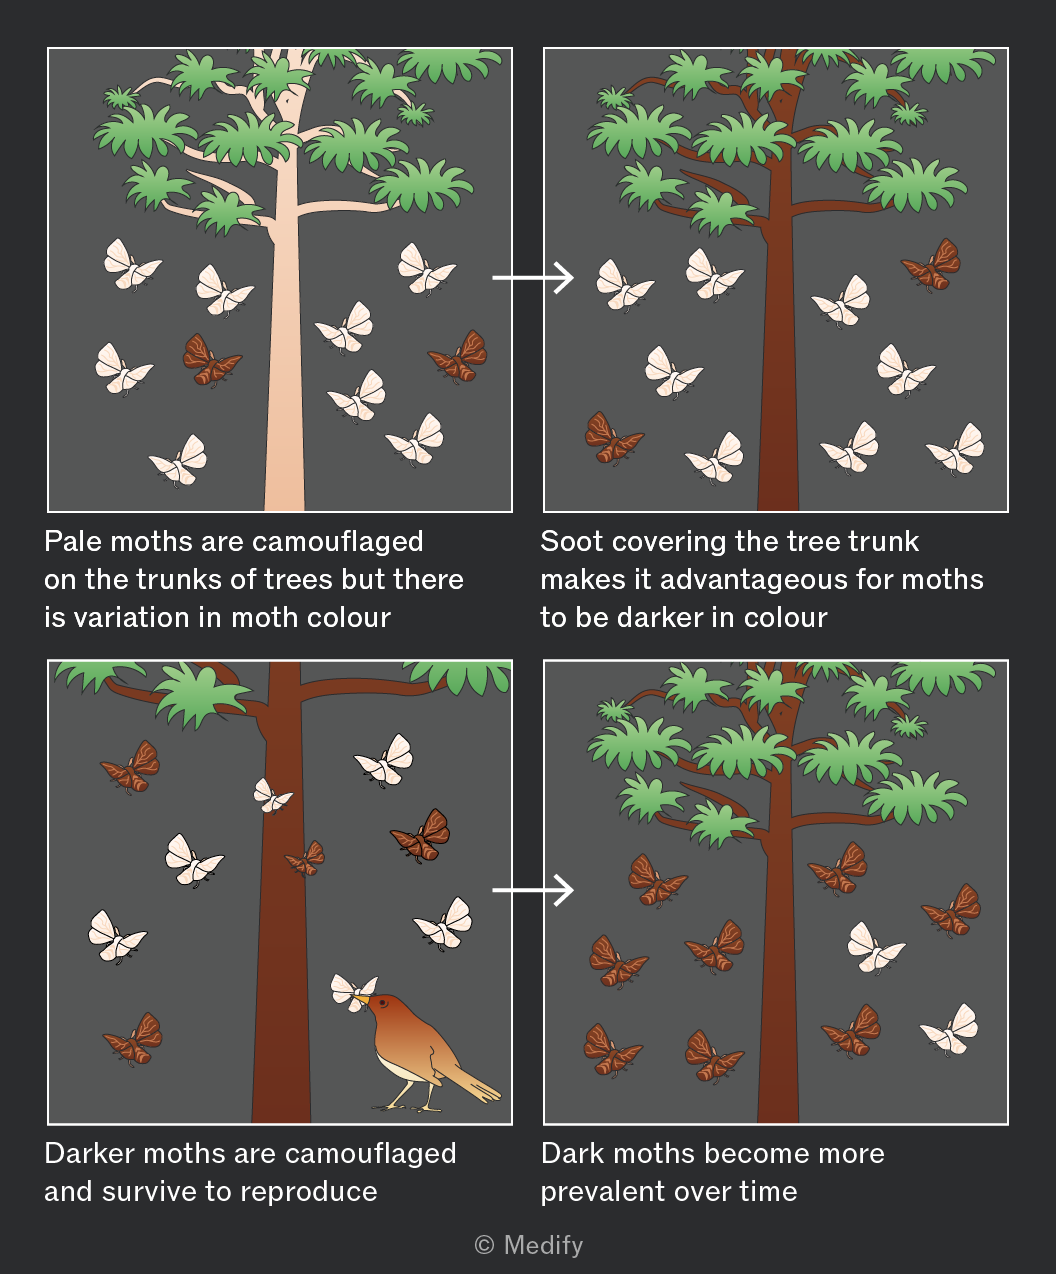
Over many generations, evolution changes the characteristics of a population.
The mechanism:
- Variation exists in a population.
- Selection pressure (e.g., climate, competition, disease) means some individuals are better adapted than others.
- These individuals are more likely to survive and reproduce.
- They pass on their advantageous alleles to offspring.
- Over time, the frequency of those alleles increases in the population.
When some species evolve, it can directly affect human health, food supply, and survival.
When pesticides are applied to crops, most insects die, but those carrying resistance alleles survive and reproduce. Over generations, resistant alleles increase in frequency as seen in Colorado potato beetles.
MRSA (methicillin-resistant Staphylococcus aureus) evolved through repeated antibiotic exposure, with resistant bacteria surviving and passing on resistance alleles, making infections harder to treat.