
Patterns of inheritance (6.1.2)
On this page
A gene is a sequence of DNA that codes for a polypeptide or functional RNA molecule. The specific position of a gene on a chromosome is called its locus.
A gene can exist in two or more forms at the same locus, on homologous chromosomes. These forms are known as alleles.
A diploid individual can only carry two alleles (one on each homologous chromosome).
Multiple alleles increase genetic variation and can lead to different phenotypes. Sexual reproduction further increases genetic variation by producing new combinations of alleles through meiosis and fertilisation.
An organism’s genotype is its genetic makeup, expressed as the set of alleles it possesses. It determines the potential for particular traits or characteristics.
A phenotype is the observable expression of the genotype. It can be influenced by environmental factors. Individuals with the same phenotype may have different genotypes.
Phenotypic variation can be caused by genetic factors.
Genetic variation arises from differences in genotype, which are generated by:
- Mutation: creates new alleles.
- Independent assortment: the random distribution of chromosomes during meiosis.
- Crossing over: exchange of genetic material between homologous chromosomes during meiosis.
- Random fertilisation: any sperm can fertilise an egg, producing unique combinations of alleles.
Phenotypic variation can be caused by environmental factors.
Environmental factors influence phenotype through external conditions, for example:
- Diet: affects growth, development and other characteristics in animals.
- Light: lack of light can cause etiolation in plants, causing elongated stems and reduced leaf development as they try to grow towards a source of light.
Environmental factors can influence the expression of traits and, together with genetic factors, contribute to continuous variation.
Monogenic inheritance refers to the inheritance of a characteristic controlled by a single gene.
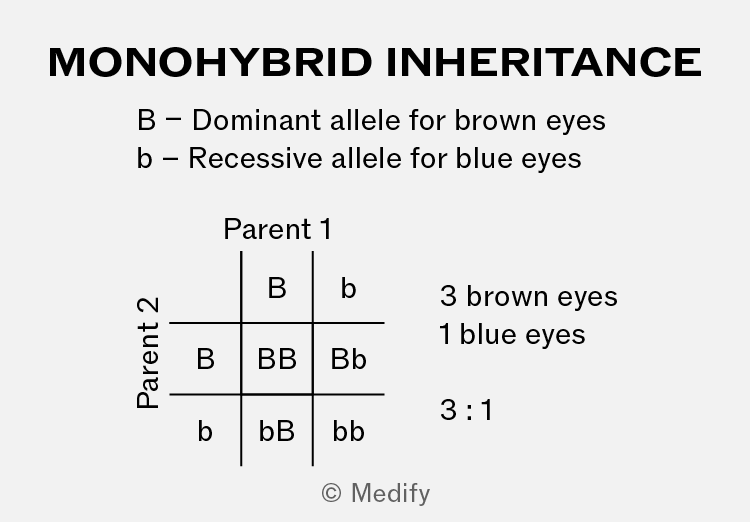
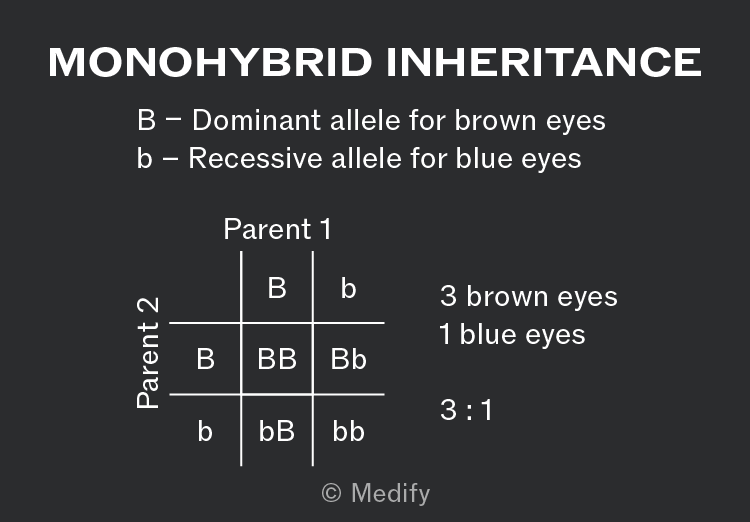
Monohybrid inheritance describes the inheritance pattern of a single gene in a genetic cross. It is often represented using Punnett squares or genetic diagrams to predict offspring genotypes and phenotypes.
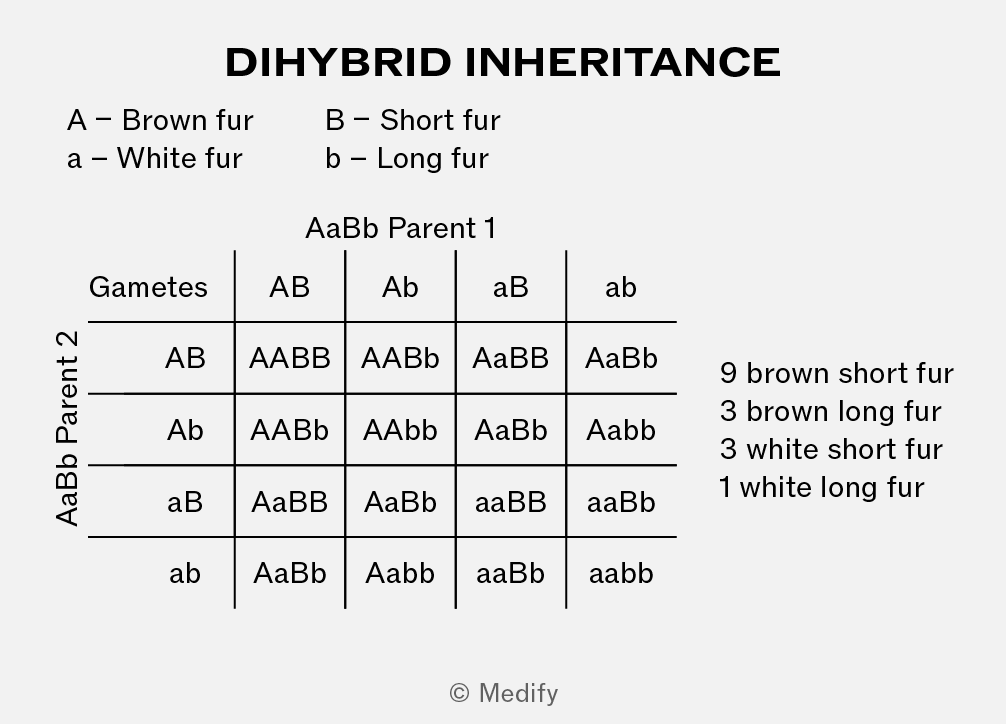
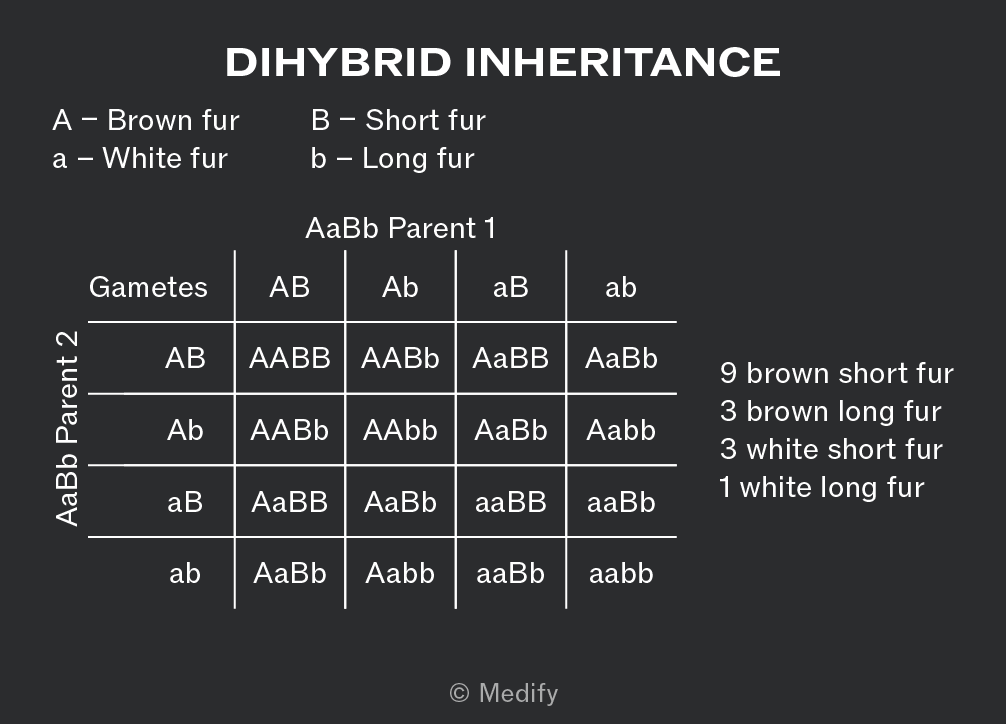
A dihybrid cross follows the inheritance of two genes simultaneously.
The 9:3:3:1 phenotypic ratio occurs only if:
- The genes are located on different chromosomes (or are sufficiently far apart on the same chromosome), so independent assortment can occur during meiosis.
- Both parents are heterozygous for both genes (AaBb × AaBb).
- Complete dominance at both loci.
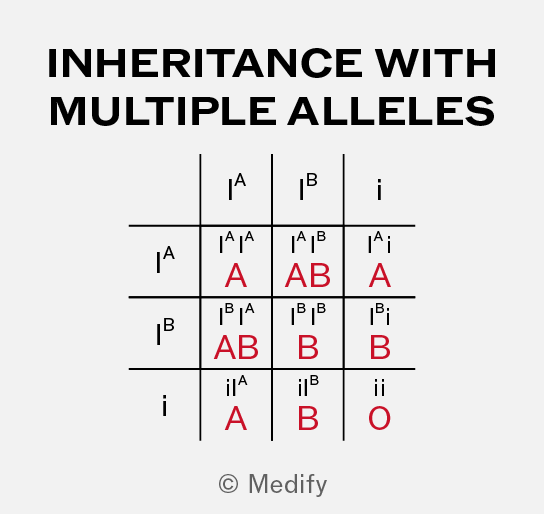
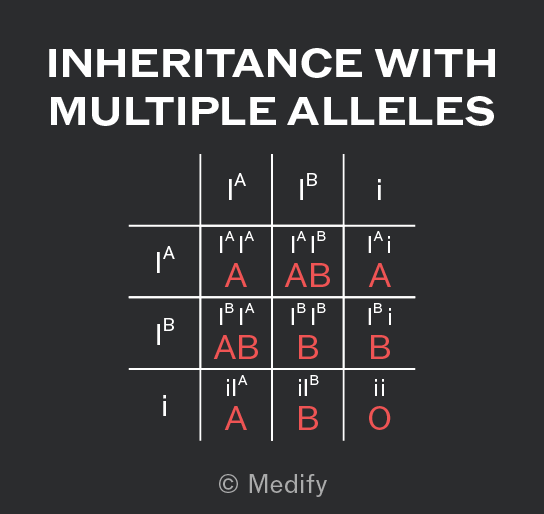
Multiple alleles occur when a gene has more than two allele forms within a population, although each diploid individual can possess a maximum of two alleles for that gene.
An example is the ABO blood group system, which has three alleles: Iᴬ, Iᴮ and i.
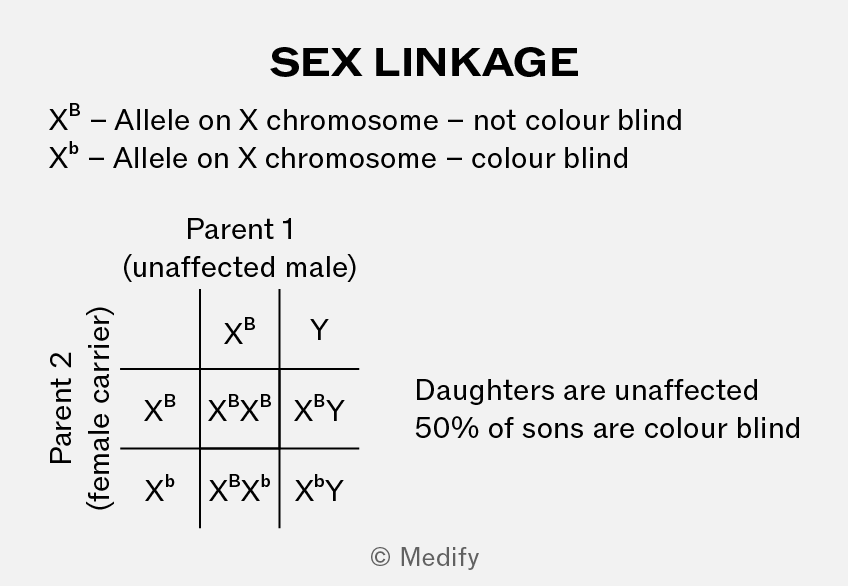
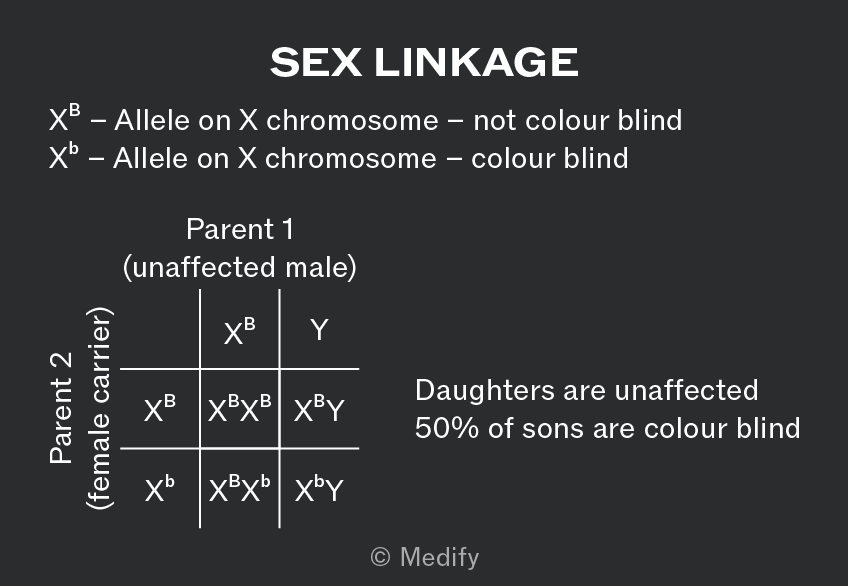
Sex linkage involves genes located on a sex chromosome (usually the X chromosome).
Males (XY) are more likely to express recessive X–linked alleles because they possess only one X chromosome. This means that they have no second allele to mask the recessive allele. Examples include red-green colour blindness and haemophilia.
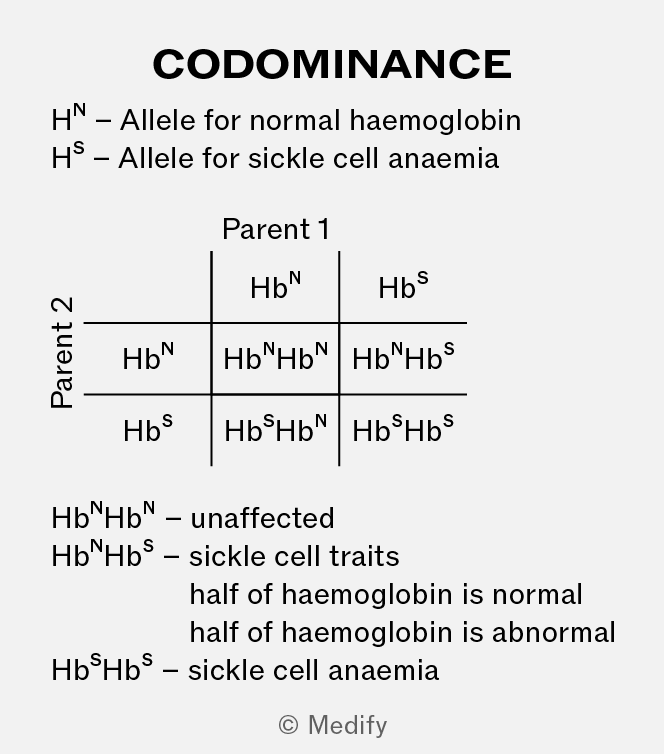
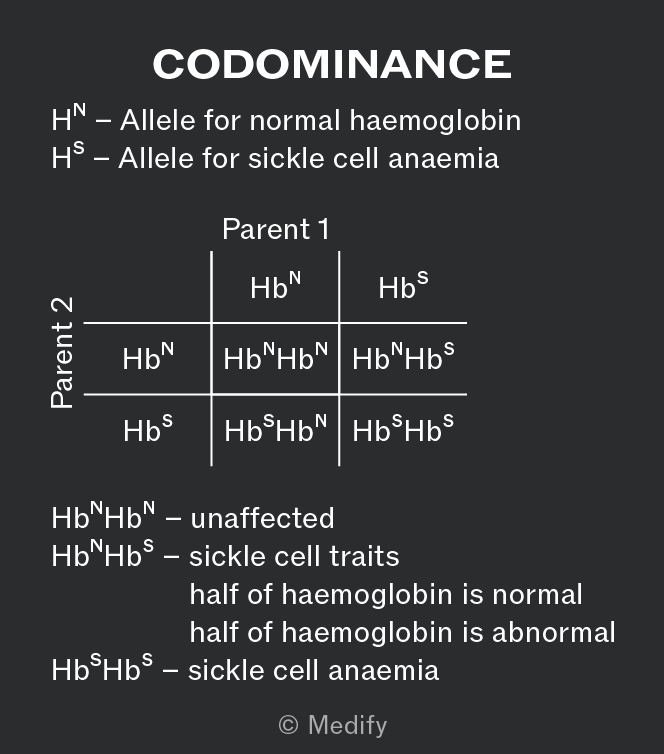
Codominance occurs when both alleles in a heterozygous individual are expressed equally in the phenotype.
Sickle cell anaemia is an example of codominance because heterozygotes produce both normal and sickle haemoglobin.
Autosomal linkage occurs when genes are located on the same (non-sex) chromosome and are therefore more likely to be inherited together.
As a result, parental allele combinations occur more frequently than recombinant combinations produced by crossing over. This results in a significant deviation from the 1:1:1:1 phenotypic ratio expected from a cross if the genes assort independently.
Autosomal linkage occurs when genes are located on the same (non-sex) chromosome and are therefore more likely to be inherited together.
As a result, parental allele combinations occur more frequently than recombinant combinations produced by crossing over. This results in a significant deviation from the 1:1:1:1 phenotypic ratio expected from a cross if the genes assort independently.
Epistasis describes the effect that one gene has on the expression of another gene at a different locus. Recessive epistasis is where two recessive alleles of one gene mask the expression of another gene.
An example of recessive epistasis (9:3:4) is coat colour in rabbits. The C locus controls whether melanin (pigment) is produced and the A locus controls the type of pigment, determining coat colour.
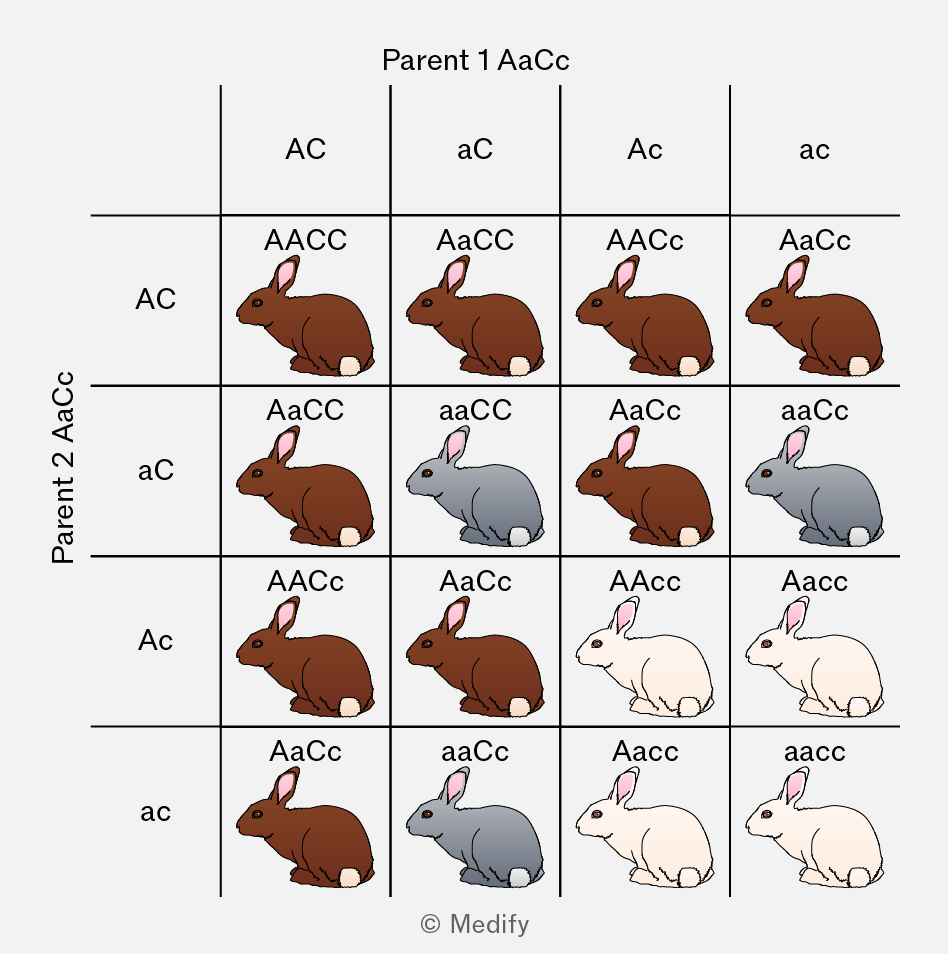
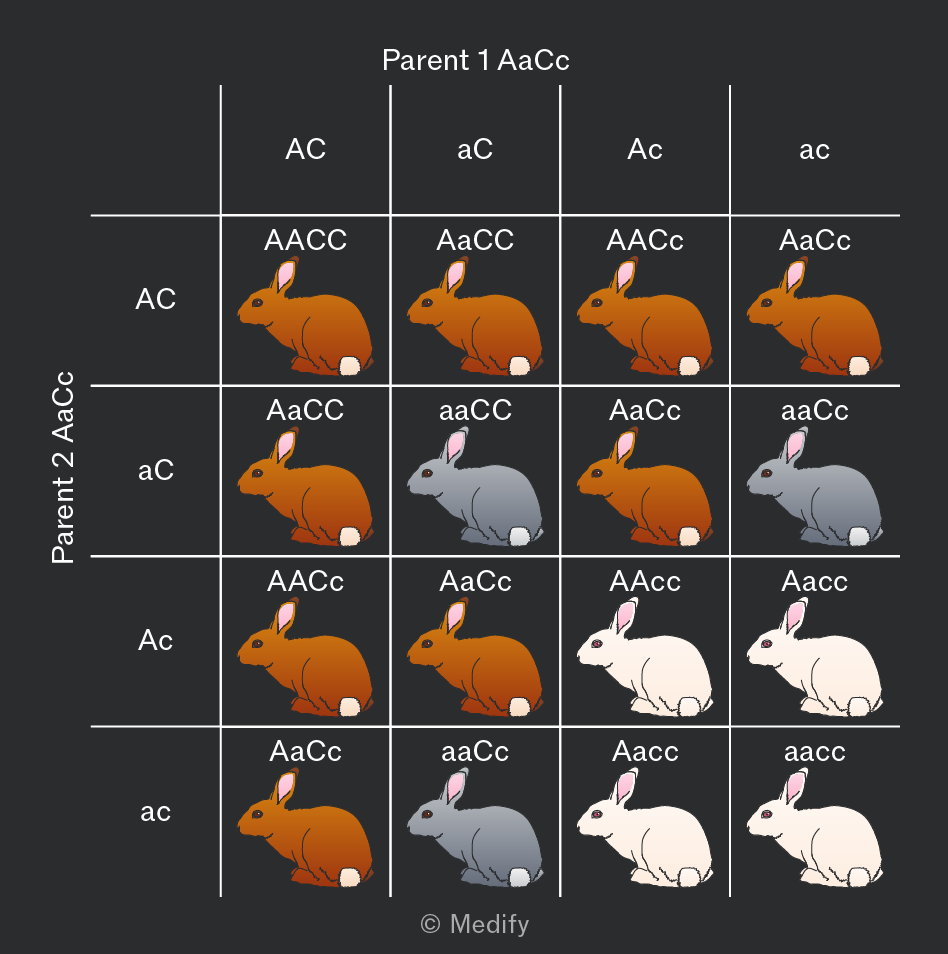
The gene at the C locus is epistatic to the gene at the A locus, which is hypostatic.
The dominant allele C is required for melanin production. If a rabbit is homozygous recessive (cc), no melanin is produced, regardless of the alleles present at the A locus, resulting in an albino phenotype.
The chi-squared () test is used to determine whether observed results differ significantly from those expected under a genetic hypothesis, such as an inheritance ratio, or whether the differences are by chance.
The formula for the chi-squared test is:
Where:
- = observed value
- = expected value
For the chi-squared () test, a null hypothesis (H₀) states that there is no significant difference between observed and expected results, and that any differences are due to chance.
The calculated chi-squared () is compared with a critical value from a statistical table using the appropriate degrees of freedom (number of outcome categories – 1).
- If is less than the critical value, accept H₀. The results are consistent with the expected ratio.
- If is greater then the critical value, reject H₀. The results differ significantly from the expected ratio.
Continuous variation shows a range of phenotypes with no distinct categories (e.g., height, body mass).
Continuous variation is usually controlled by many genes (polygenic inheritance), each contributing a small additive effect. It is also influenced by environmental factors (e.g., nutrition, climate).
When data are collected from a large population and plotted, they typically form a normal distribution curve.
Discontinuous variation shows distinct categories with no intermediates (e.g., ABO blood group).
It is usually controlled by a single gene (monogenic) with two or more alleles. Environmental factors have little or no effect on the phenotype.
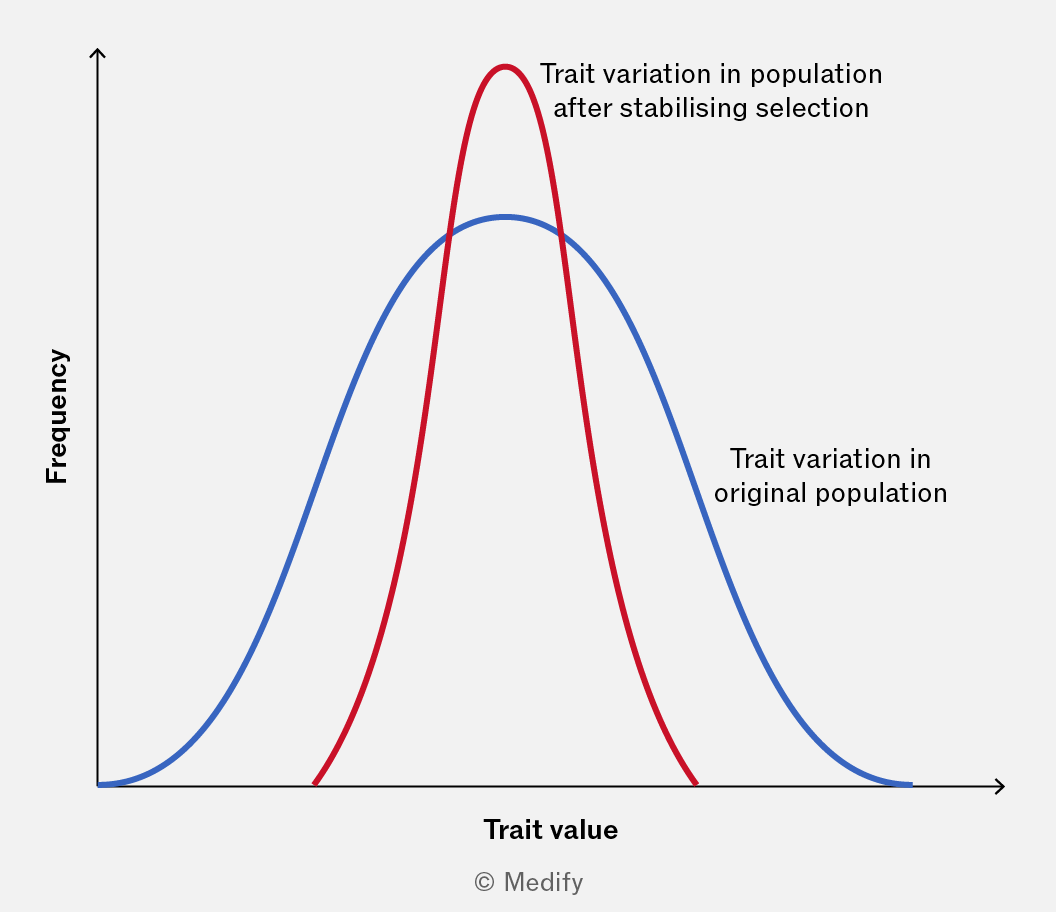
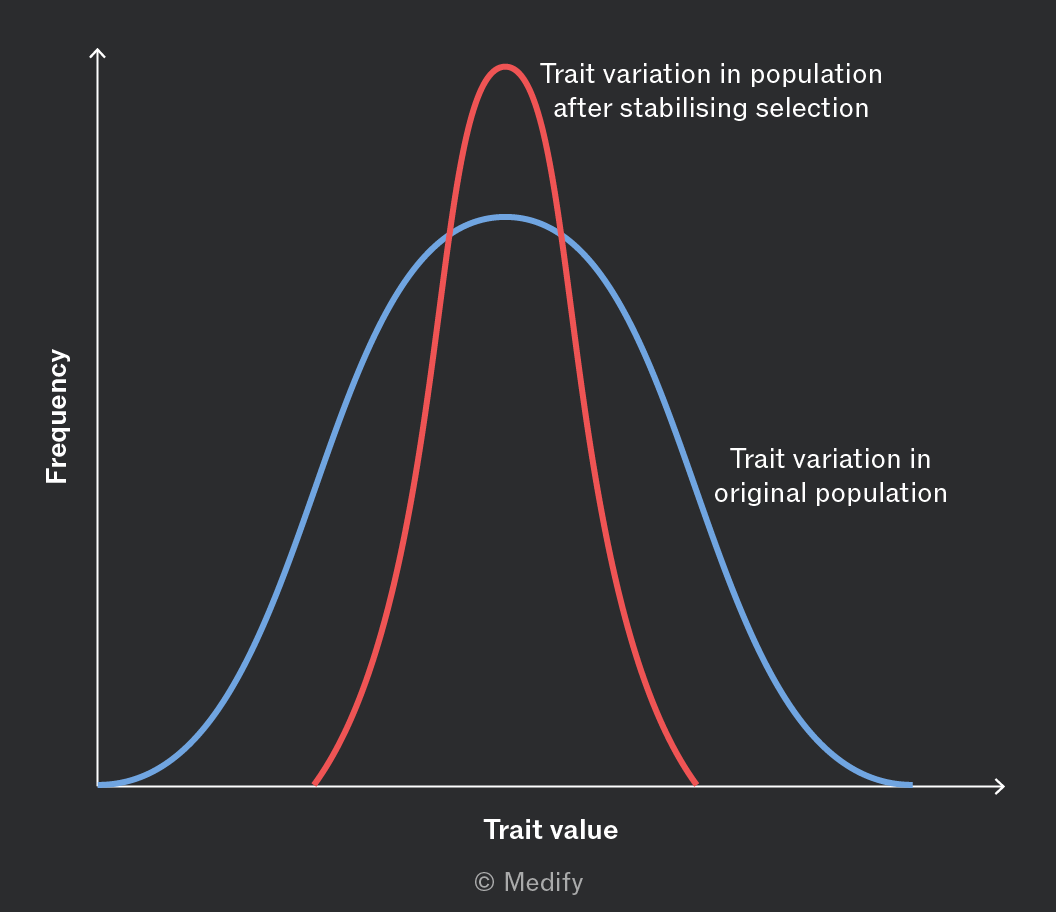
Stabilising selection favours the average phenotype in a population and selects against individuals at both extremes.
It occurs when the environment is stable and the existing mean phenotype is well suited to conditions. Over time, variation in the population is reduced as extreme phenotypes are less likely to survive and reproduce.
For example, human birth weight is subject to stabilising selection – babies of intermediate weight have the highest survival rates, while very small or very large babies face greater risks.
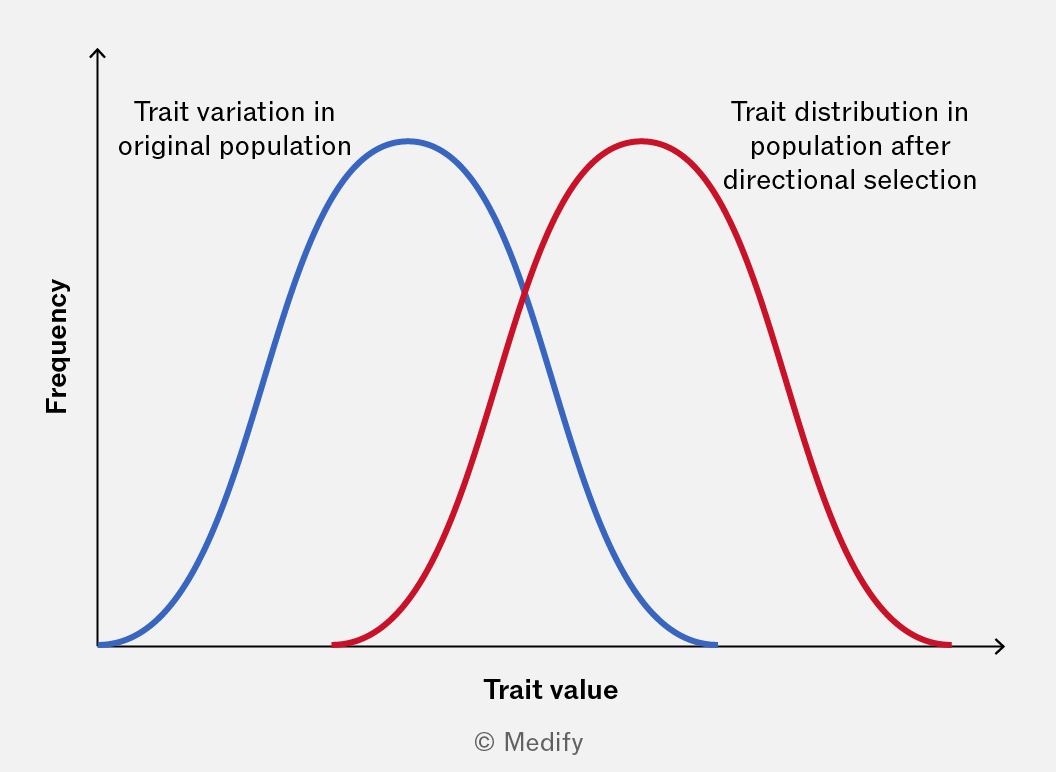
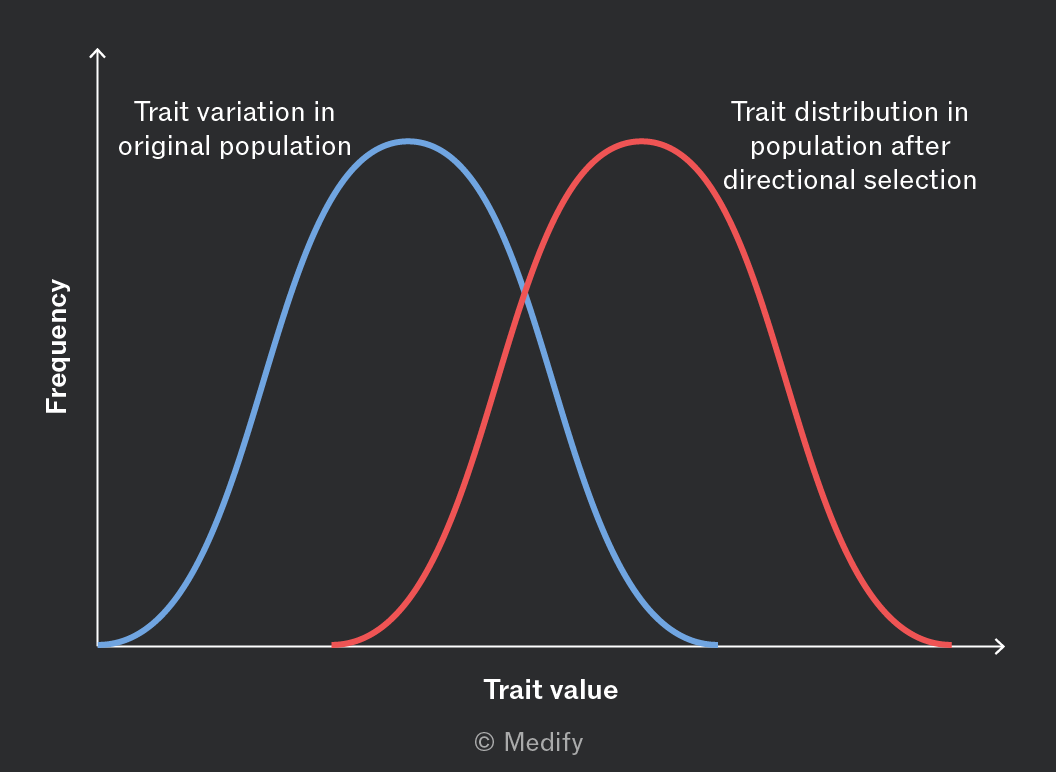
Directional selection favours individuals at one extreme of the phenotype range, shifting the population mean in that direction over time.
It occurs when environmental conditions change, giving an advantage to phenotypes that were previously less common. Over time, allele frequencies shift as the favoured phenotype becomes more prevalent.
For example, when antibiotics are applied to bacteria, resistant individuals are at an advantage, and the population mean shifts towards resistance.
Genetic drift is the random change in allele frequency in a population due to chance events, not because an allele is advantageous.
It has a greater effect in small populations, where each individual represents a larger proportion of the gene pool. Random events such as which individuals breed or die can cause large shifts in allele frequency between generations. Rare alleles may be lost entirely or become fixed by chance, reducing genetic diversity and making the population less able to adapt.
In large populations, random effects are averaged out and allele frequencies remain more stable.
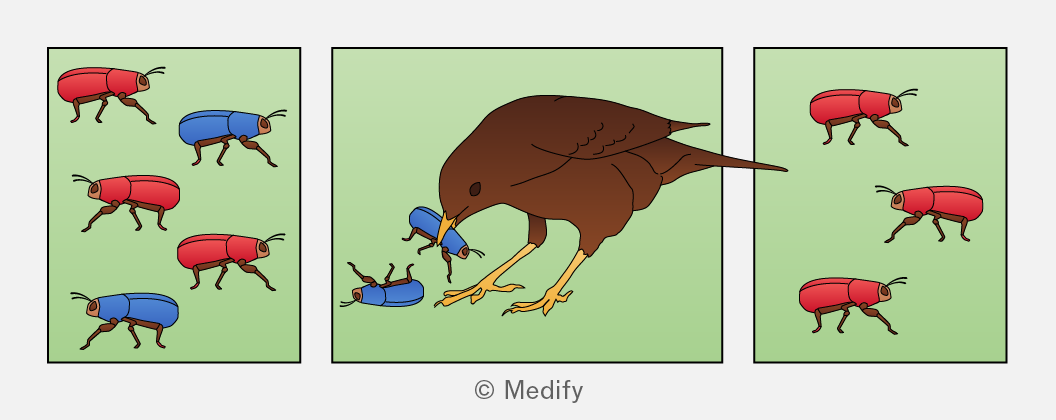
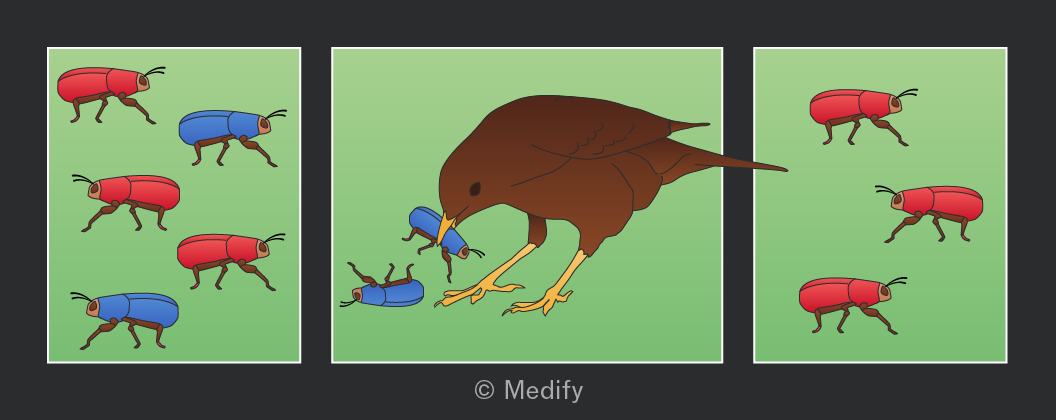
A genetic bottleneck occurs when a population is dramatically reduced in size by a chance event such as a natural disaster, disease or habitat destruction.
The surviving individuals carry only a small, random sample of the original gene pool’s alleles. As the population recovers, it has much lower genetic diversity than before.
This reduced diversity makes the population more vulnerable to environmental change and increases the risk of inbreeding.
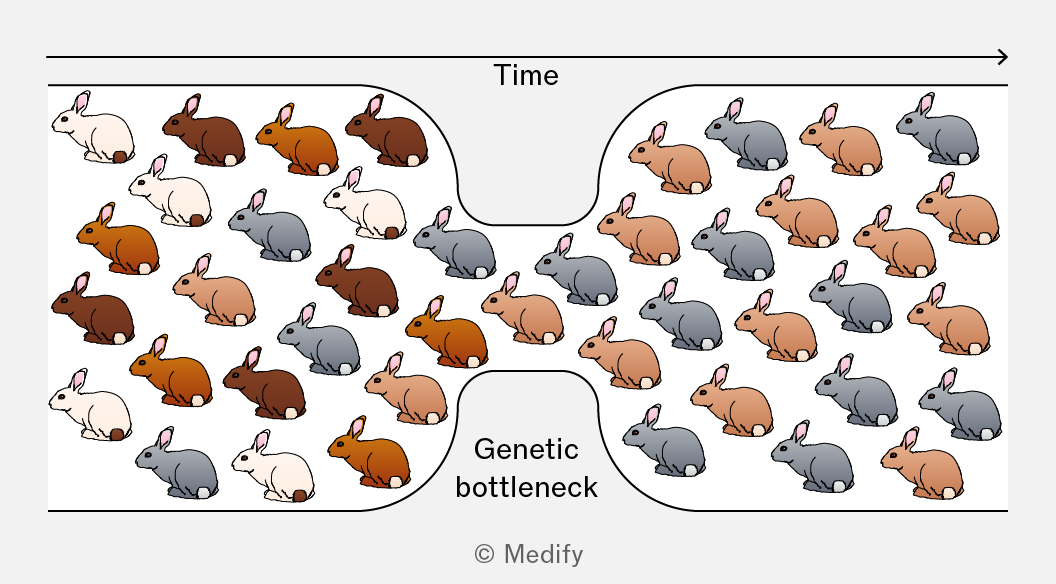
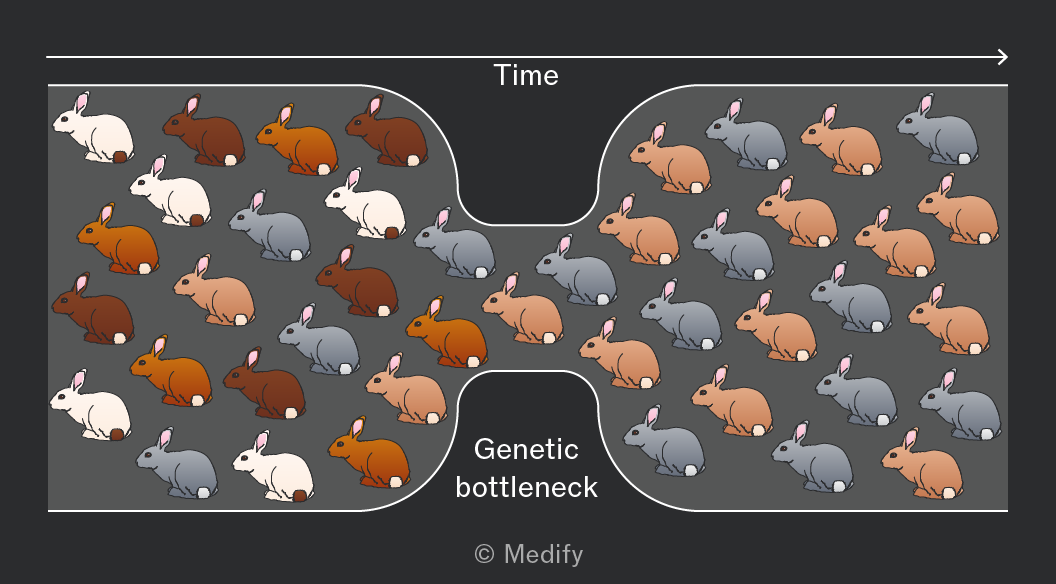
The founder effect occurs when a small number of individuals from a population colonise a new area.
These founders carry only a small, unrepresentative sample of the original population’s alleles. The new population that grows from these founders therefore has reduced genetic diversity and different allele frequencies compared to the original population, purely by chance. Rare alleles in the original population may become common in the new one, or common alleles may be absent entirely.
The Hardy–Weinberg principle is a mathematical model used to calculate allele and genotype frequencies in a stable, non-evolving population. It assumes:
- No mutations (no new alleles)
- Large population (to reduce genetic drift)
- Random mating
- No selection
- No gene flow (no migration in or out)
To calculate allele frequencies:
Where:
- = frequency of dominant allele
- = frequency of recessive allele
To calculate genotype frequencies:
Where:
- = frequency of homozygous dominant genotype (AA)
- = frequency of heterozygous genotype (Aa)
- = frequency of homozygous recessive (aa)
New species can arise from populations of an existing species.
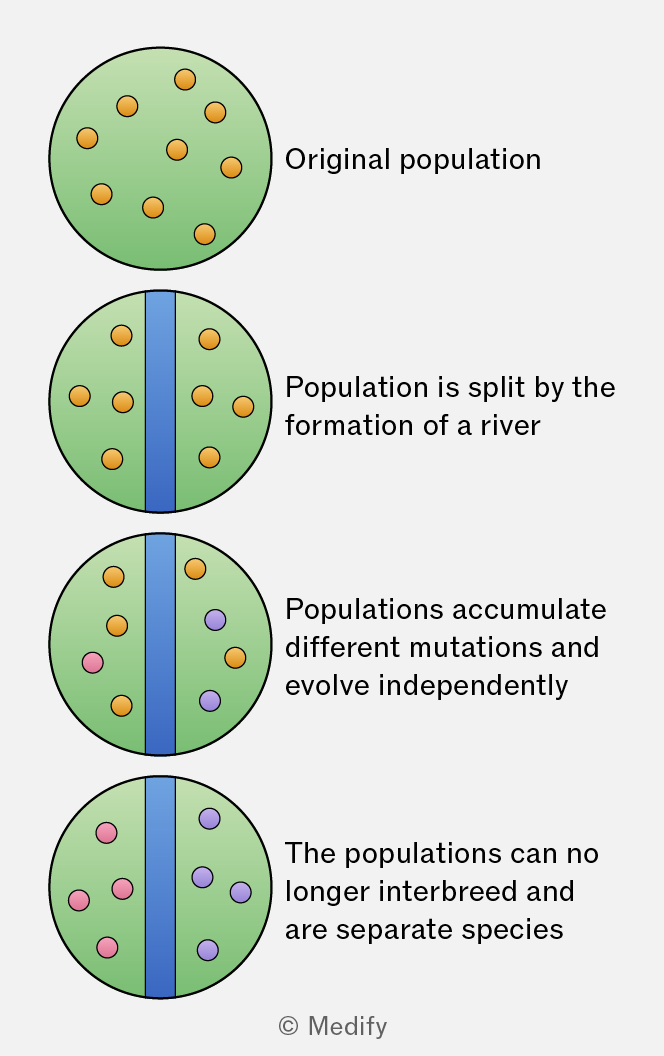
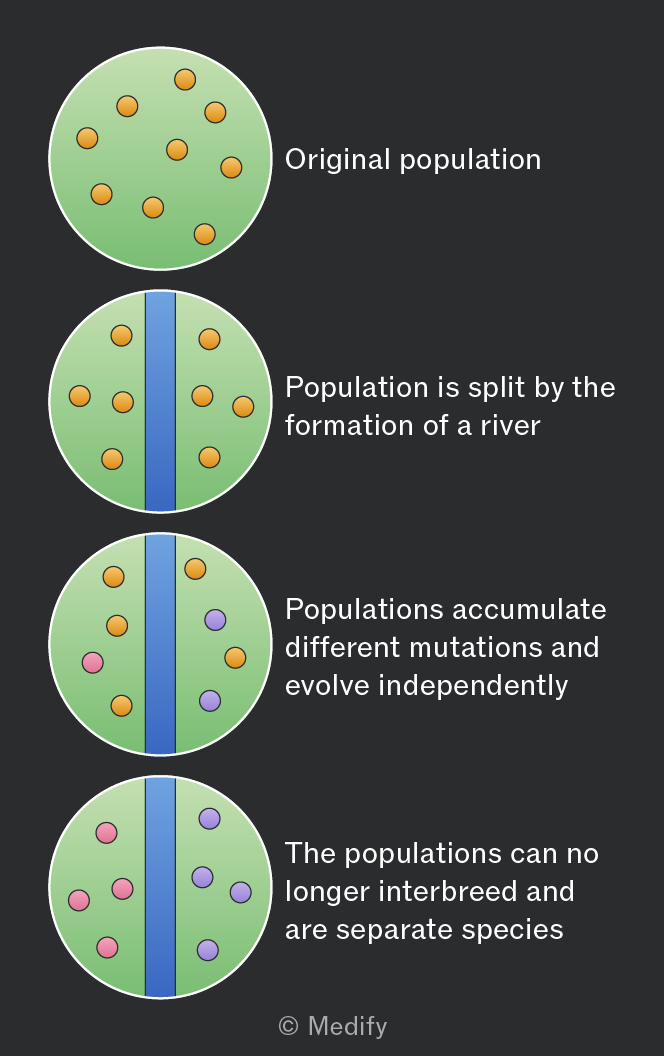
When populations are reproductively isolated from each other, they evolve independently. Their gene pools may be under different selection pressures or may experience different mutations or genetic drift.
Over time, changes to the allele frequencies in the separate populations accumulate to such a degree that they cannot interbreed to produce fertile offspring. They have become different species.
A geographical barrier (e.g., mountains, rivers, seas) separating populations is the most common cause of reproductive isolation, leading to the formation of a new species. This process is called allopatric speciation.
Either side of the barrier, each population experiences:
- Different selection pressures (e.g., climate, predators, food) which favour different alleles.
- Mutations introducing new alleles.
- Genetic drift (especially in small populations).
Over time, allele frequencies change independently in each population, and the gene pools diverge.
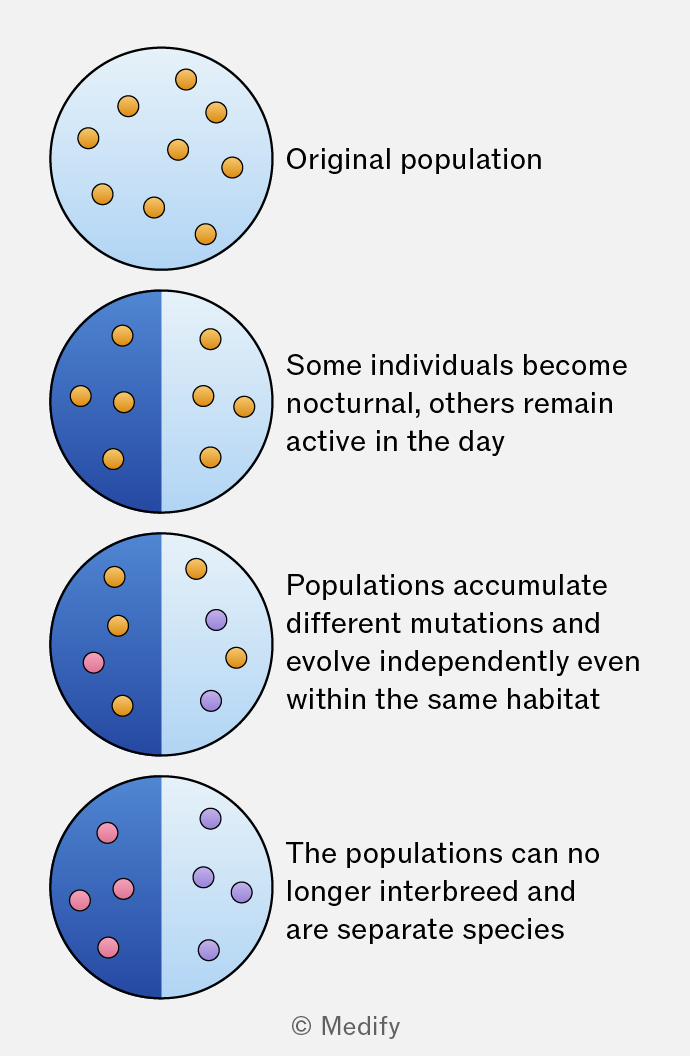
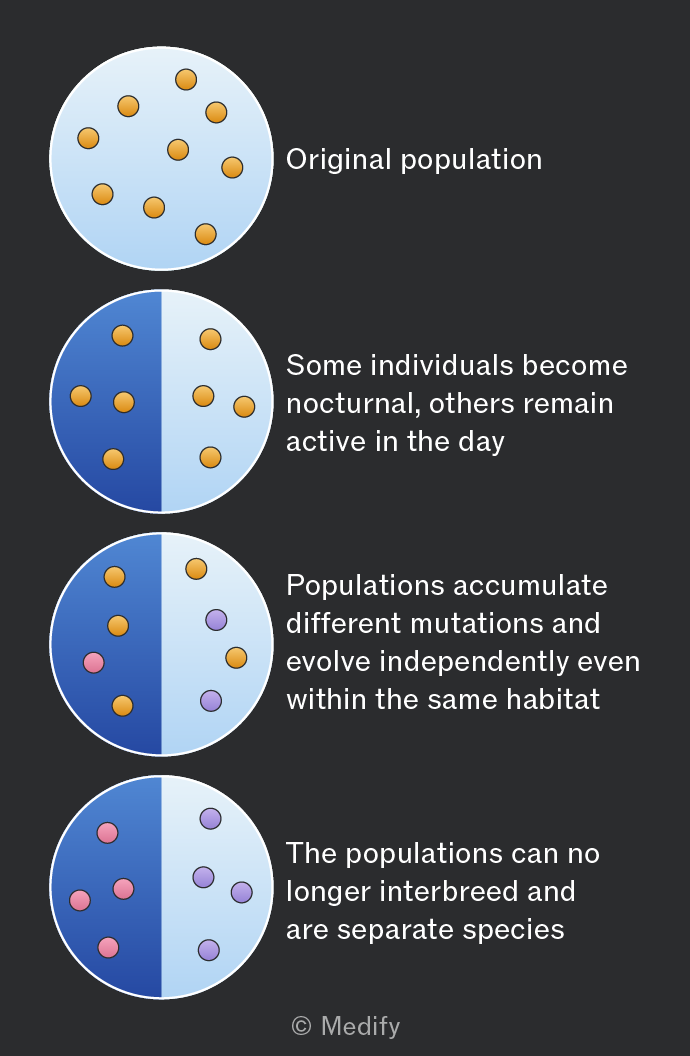
Less commonly, speciation can occur in populations that share a habitat. This is called sympatric speciation.
Reproductive isolation can be arise in many ways, including by:
- Behavioural differences (mating calls, courtship rituals).
- Ecological differences (feeding in different habitats).
- Temporal isolation (breeding at different times of year / day).
- Polyploidy differences (extra sets of chromosomes – common in plants).
Over time, a lack of interbreeding means there is no gene flow between the populations, and genetic differences build up.
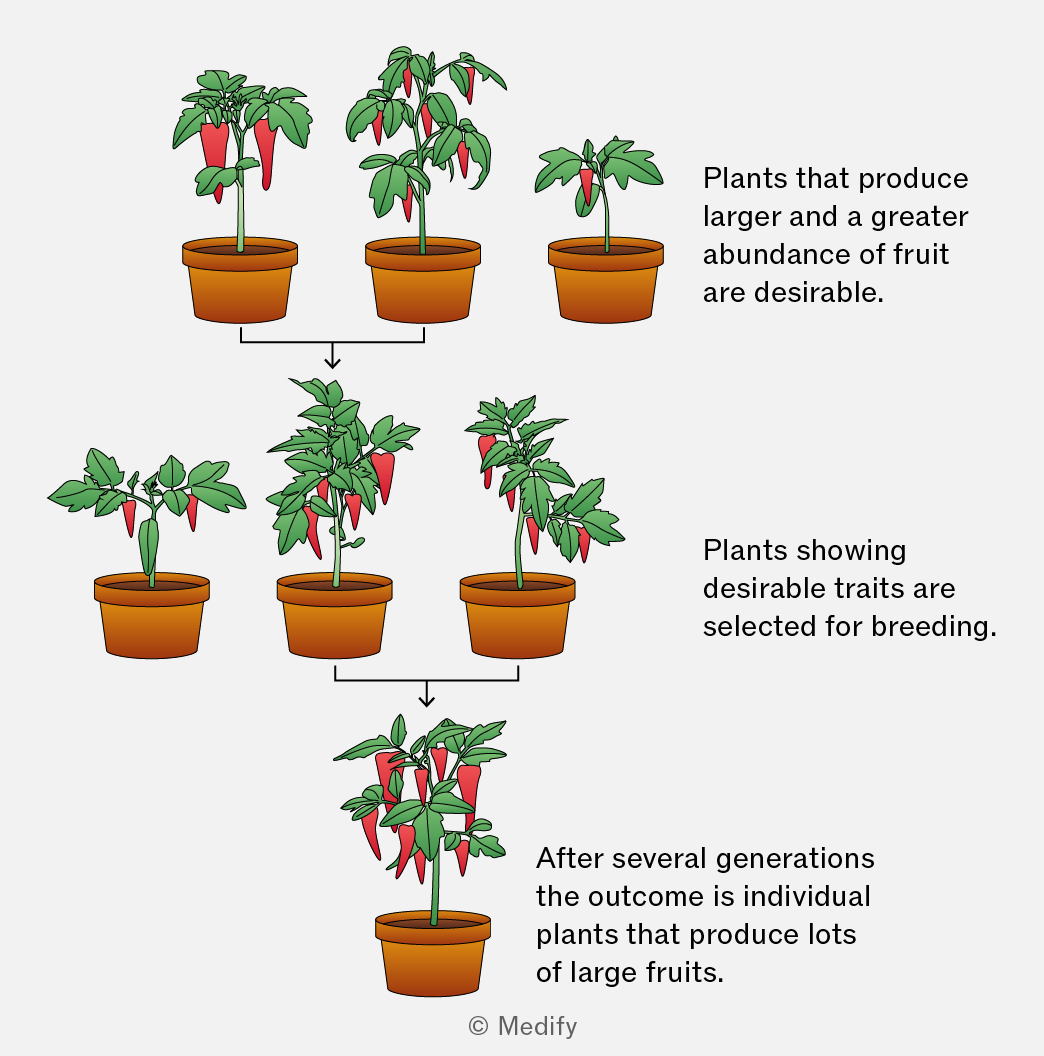
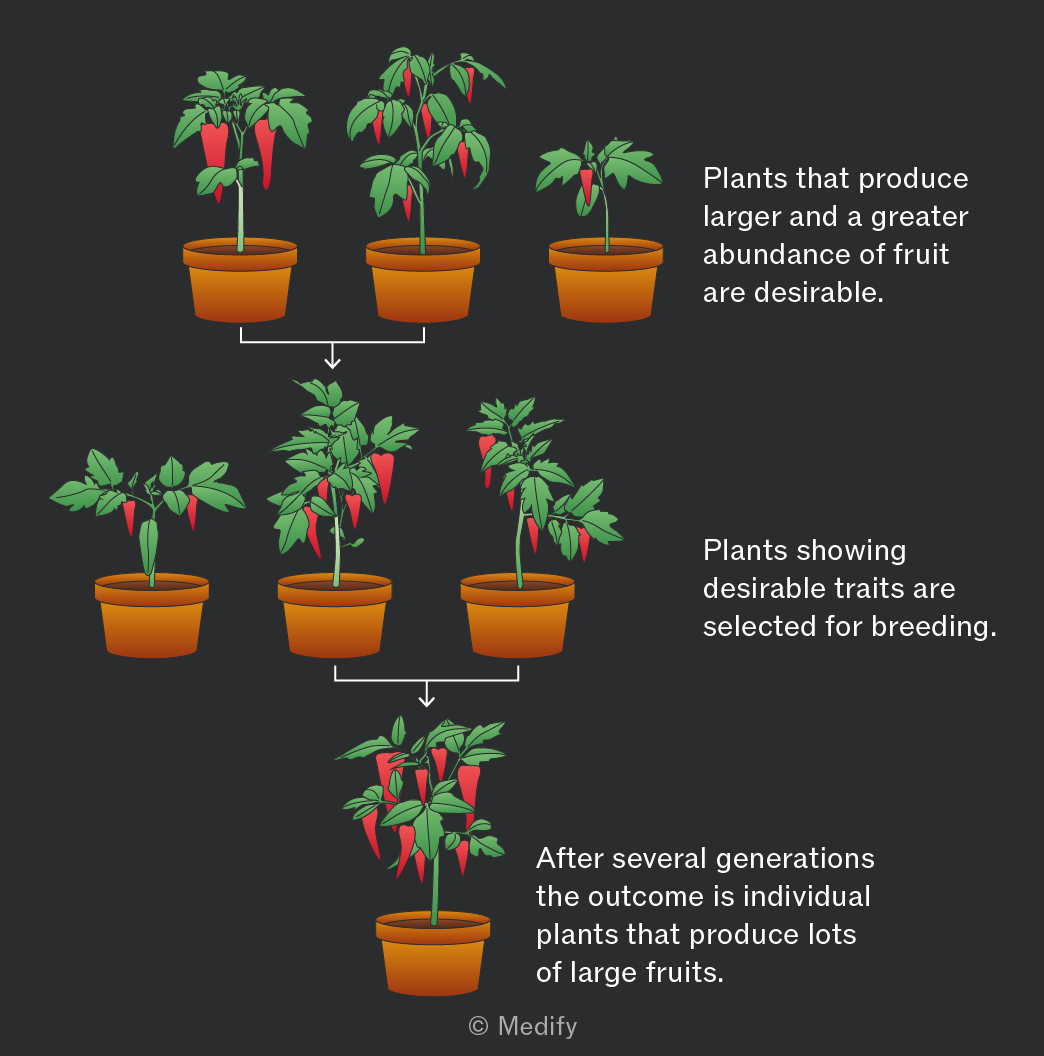
Artificial selection (selective breeding) is the process by which humans select individuals with desirable traits to breed, increasing the frequency of the alleles responsible for those traits in a population. Over successive generations, desirable traits become more common, although genetic diversity is often reduced.
Process:
- Select individuals with desirable characteristics (e.g., high yield or disease resistance).
- Breed the selected individuals together.
- Select offspring with the desired traits and repeat the process over many generations.
Selective breeding has been used in both plants and animals to enhance desirable characteristics:
- Dogs: selectively bred for traits such as hunting ability, companionship and speed.
- Cereal crops: (e.g., wheat and maize) bred for pest resistance, increased yield and improved flavour.
- Cattle: selectively bred for increased meat production or higher milk yield.
Maintaining a resource of genetic material, including wild types, is important for preserving genetic diversity and potentially useful alleles for future selective breeding. Reduced genetic diversity, can lead to inbreeding depression increasing the likelihood of harmful recessive alleles being inherited.
Gene banks are one method used to conserve genetic material and include seed banks, sperm banks, cultivated crop varieties and wild populations.
Artificial selection raises several ethical concerns:
- Animal welfare: inbreeding can increase the incidence of genetic disorders, deformities, and reduced fertility.
- Biodiversity loss: reduced genetic diversity can make populations more susceptible to disease and environmental change.
- Human intervention: concerns exist about manipulating organisms for economic gain or aesthetic traits.
- Food production: reliance on genetically uniform crops and livestock may reduce sustainability and increase vulnerability to pests and disease.