Evolution may lead to speciation - AL only (3.7.3)
On this page
Variation in organisms’ phenotypes arises through their genes (inherited), their environment (not inherited) and a combination of these effects.
Genetic variation in a population arises from several sources:
- Mutation is the main source and generates new alleles.
- Alleles are gene variants that produce different phenotypes
- During meiosis, independent assortment shuffles chromosome combinations and crossing over between homologous chromosomes creates new allele combinations.
- Sexual reproduction results in offspring inheriting alleles from both parents
- Random fertilisation means offspring have a unique and unpredictable combination of alleles.
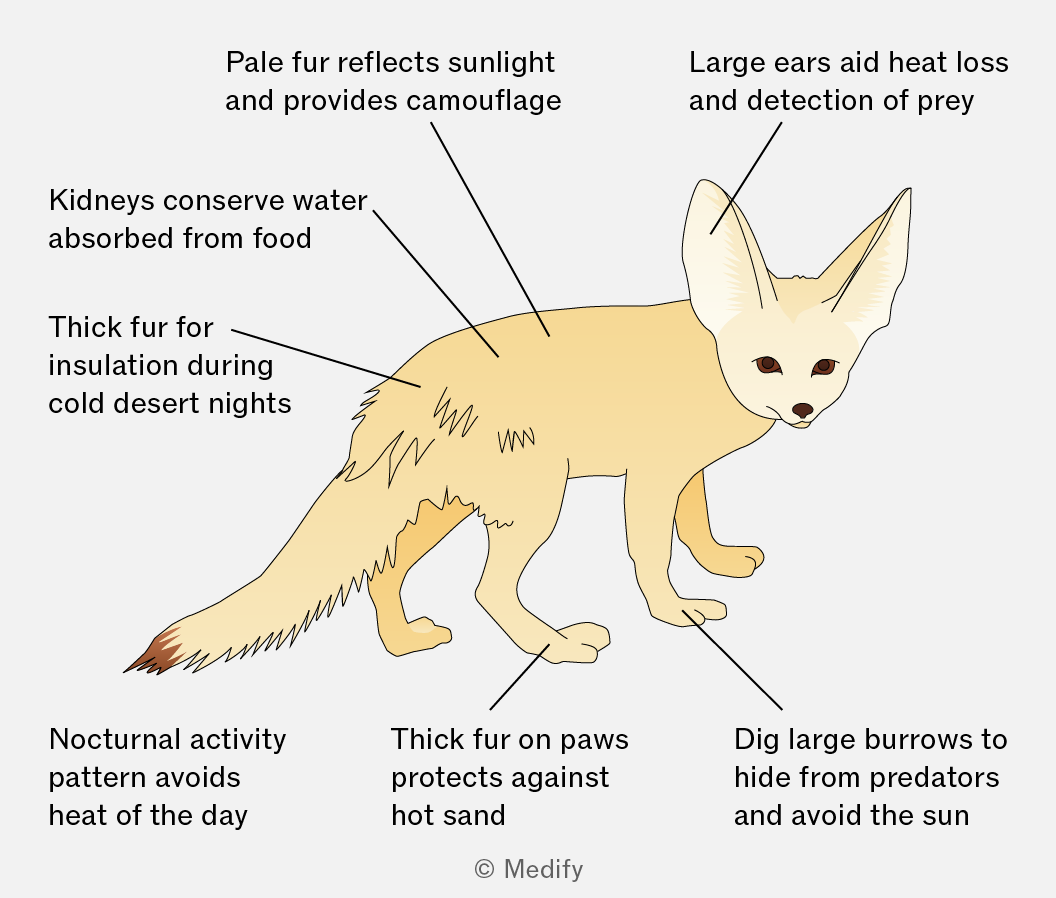
An adaptation is a feature that makes an organism specialised to exist in its environment. This makes an organism more likely to be successful, survive and reproduce.
Adaptations can be anatomical, behavioural, or physiological.
In nature, organisms face struggles for survival, such as:
- Predation – being eaten by other organisms.
- Disease – caused by pathogens.
- Competition – for food, space, mates, etc.
These pressures lead to differential survival and reproduction. Some individuals have advantageous alleles (better adapted). They are more likely to survive, reproduce, and pass on their alleles. Others are less likely to survive and reproduce. This process is natural selection.
Organisms with advantageous phenotypes are more likely to survive, reproduce and pass on their alleles. Over generations, this differential reproductive success means favourable alleles increase in frequency within the gene pool while disadvantageous alleles decline.
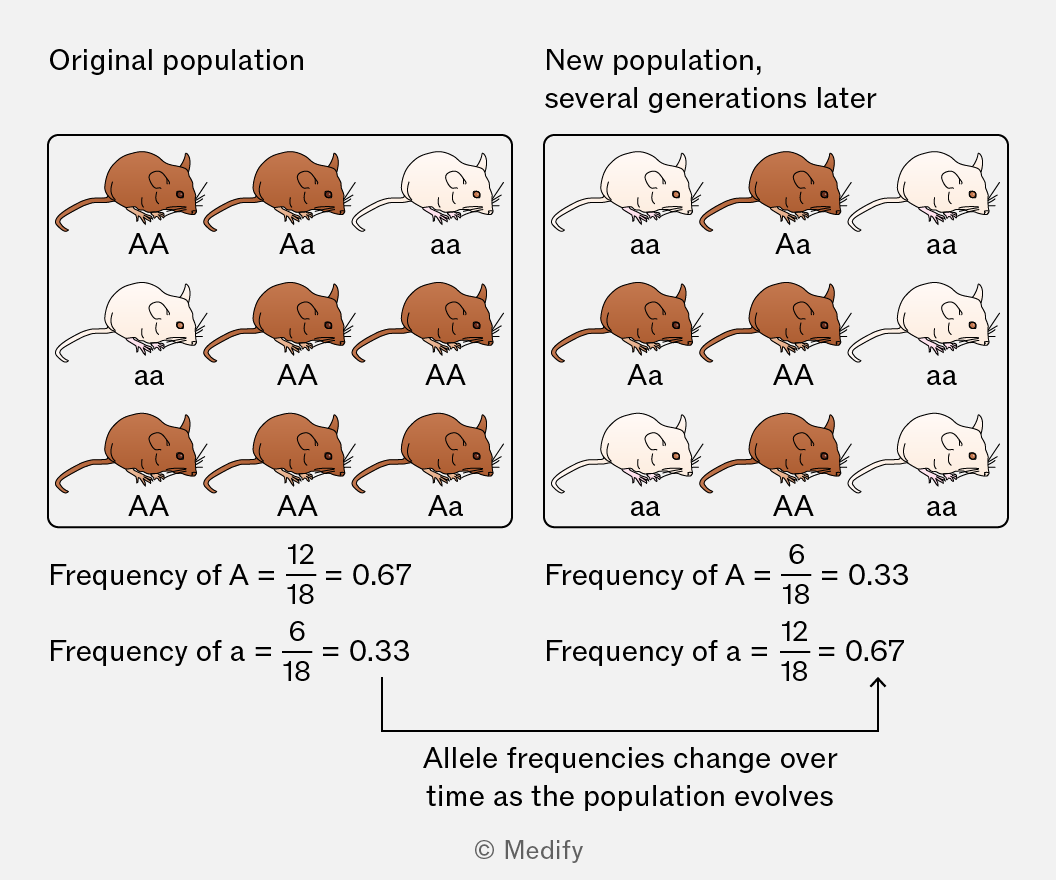
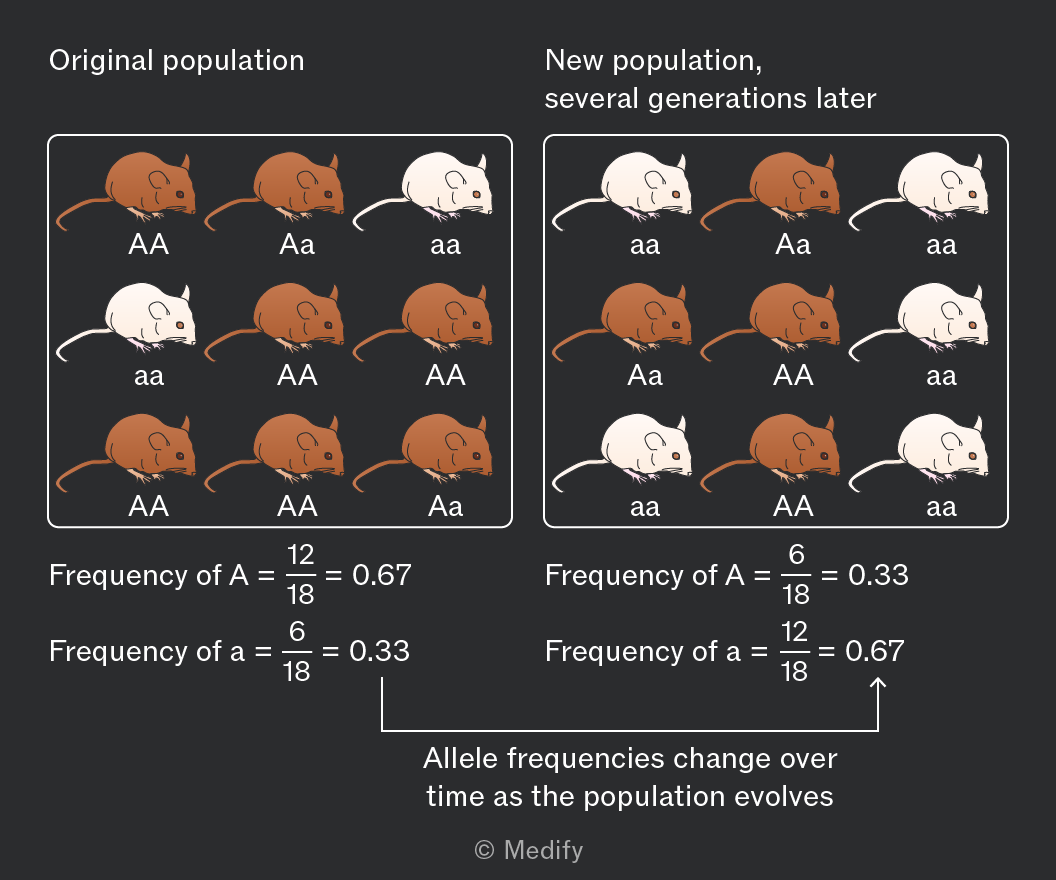
The gene pool is the total set of alleles present in a population. If the frequency of any allele shifts between generations, evolution has occurred.
Evolution is defined as a change in allele frequencies within a population’s gene pool over time.
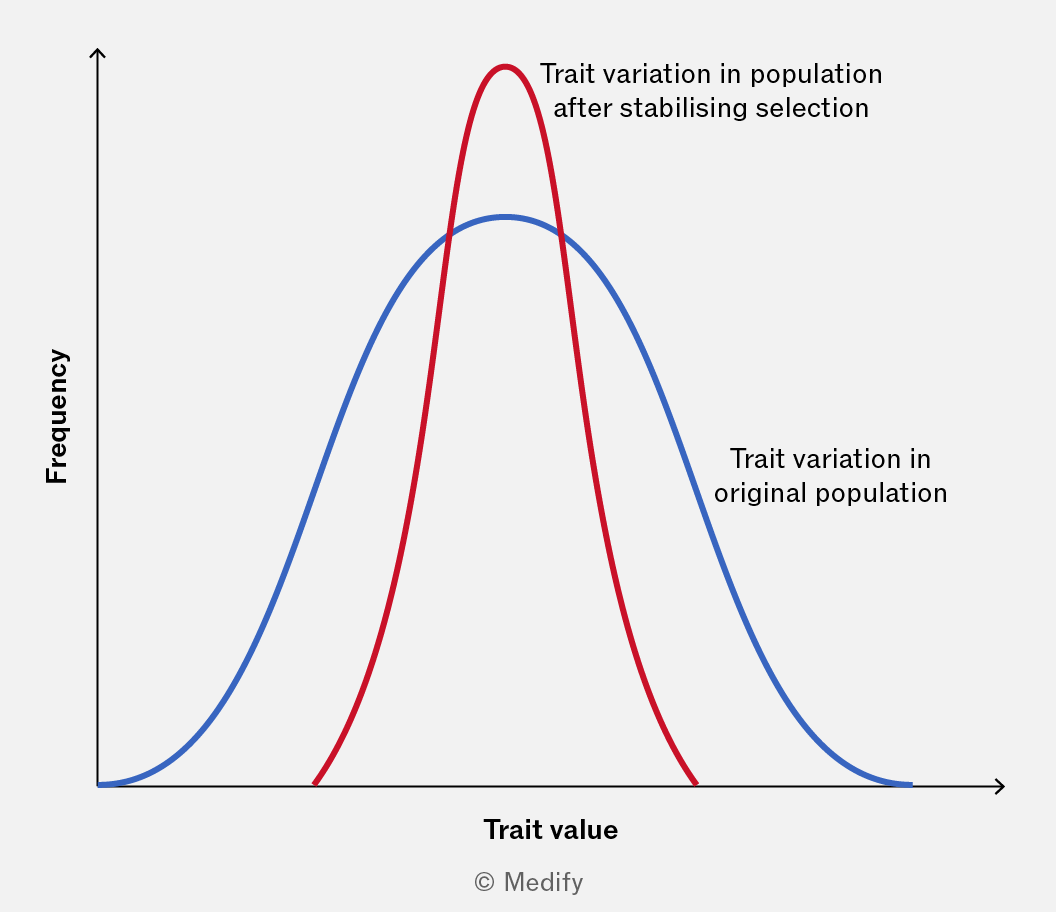
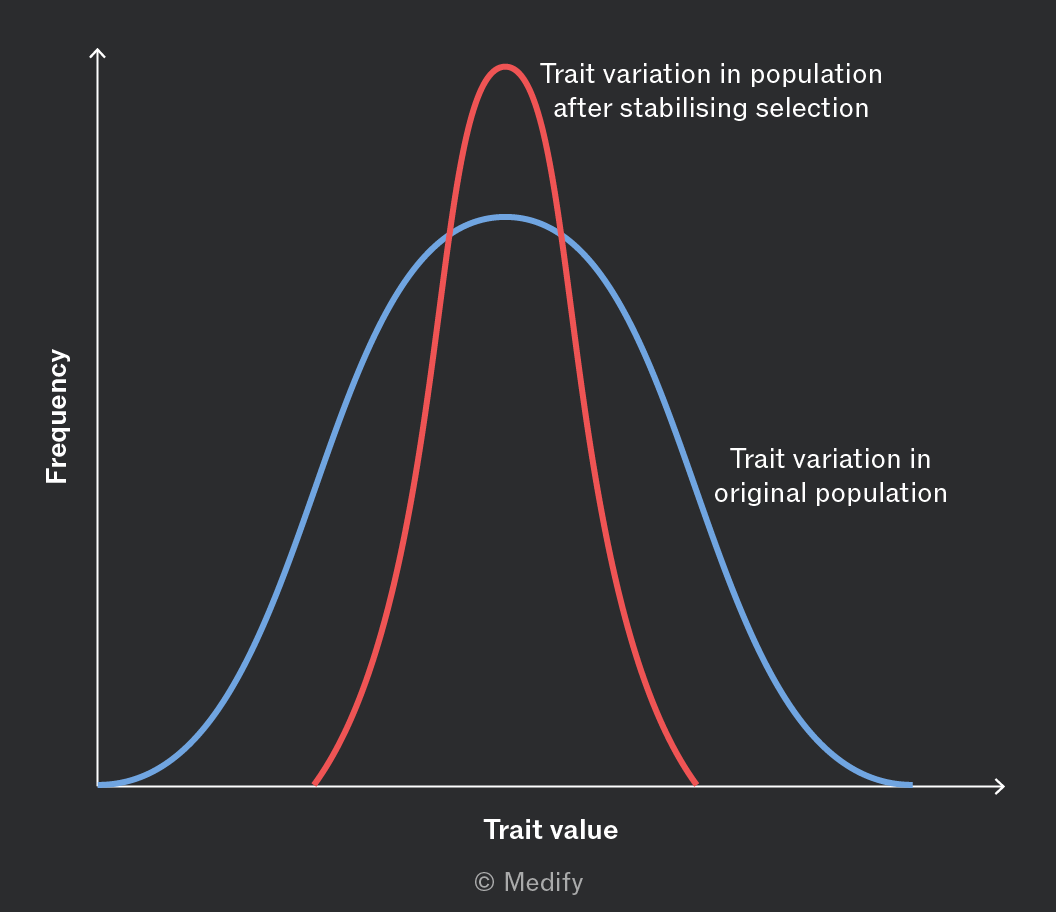
Stabilising selection favours the average phenotype in a population and selects against individuals at both extremes.
It occurs when the environment is stable and the existing mean phenotype is well suited to conditions. Over time, variation in the population is reduced as extreme phenotypes are less likely to survive and reproduce.
For example, human birth weight is subject to stabilising selection – babies of intermediate weight have the highest survival rates, while very small or very large babies face greater risks.
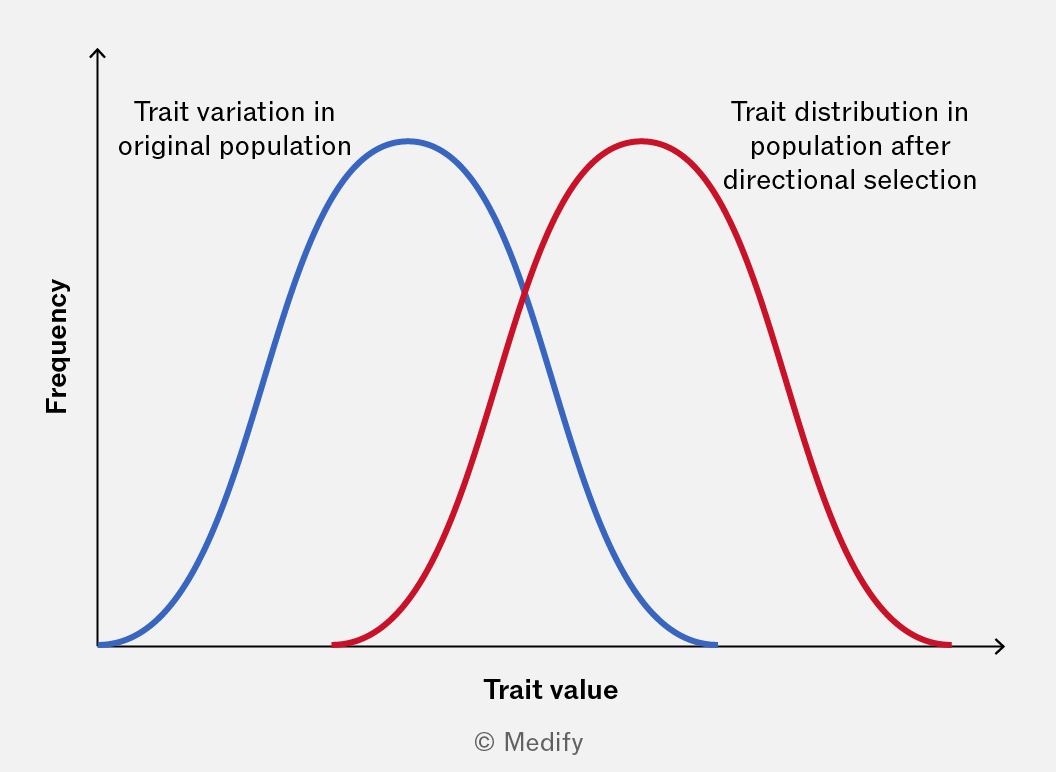
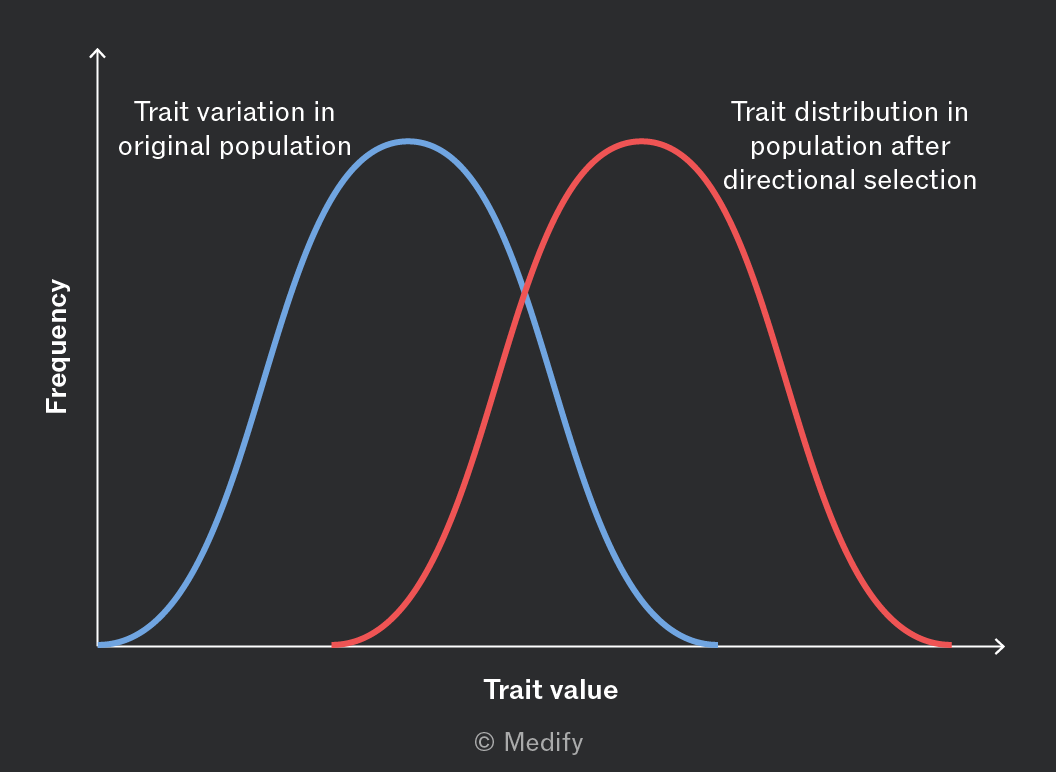
Directional selection favours individuals at one extreme of the phenotype range, shifting the population mean in that direction over time.
It occurs when environmental conditions change, giving an advantage to phenotypes that were previously less common. Over time, allele frequencies shift as the favoured phenotype becomes more prevalent.
For example, when antibiotics are applied to bacteria, resistant individuals are at an advantage, and the population mean shifts towards resistance.
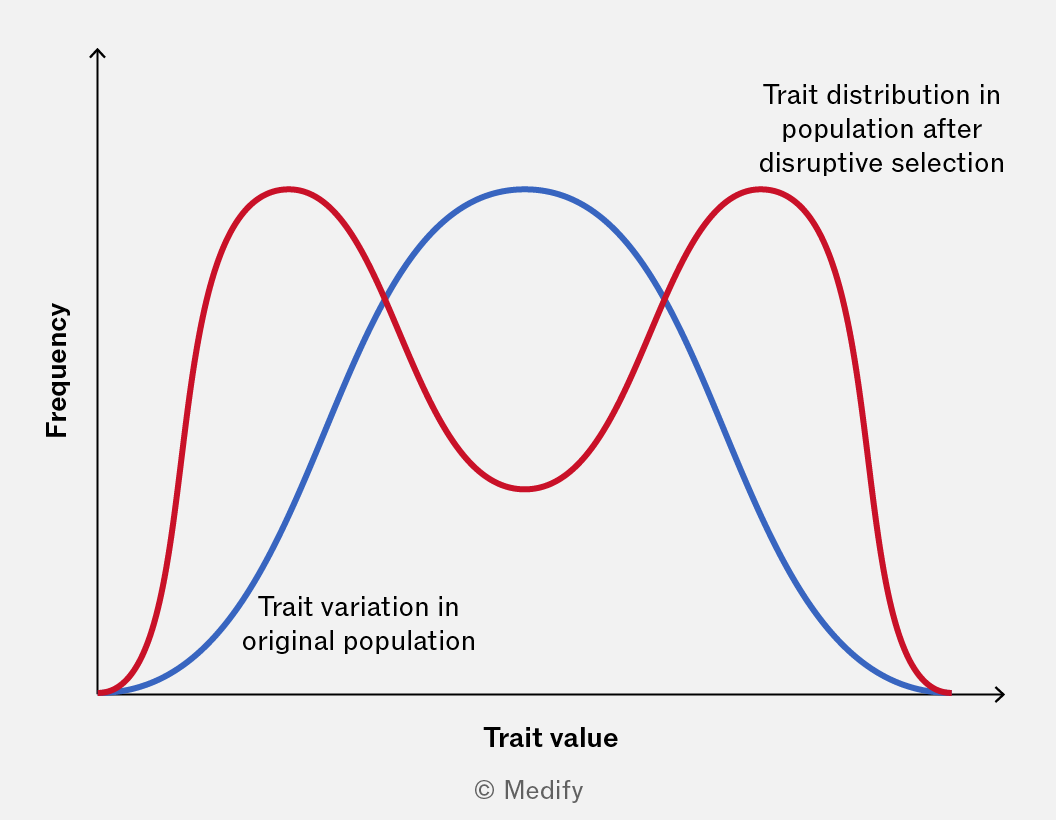
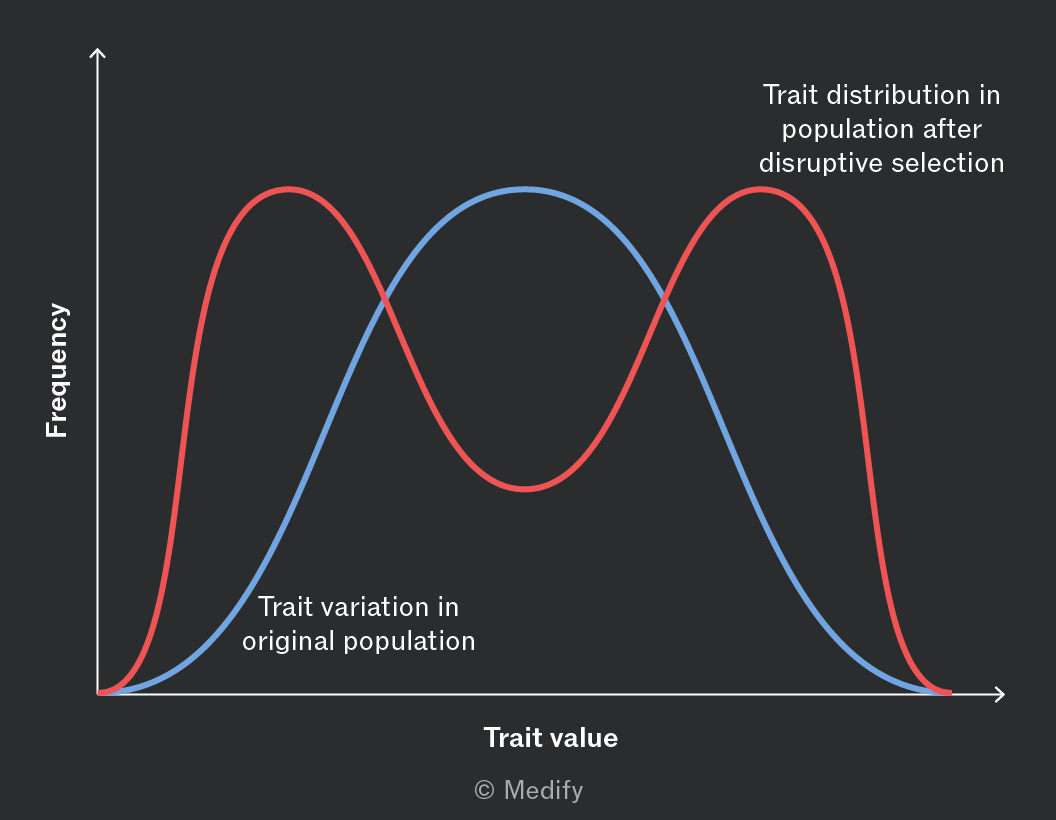
Disruptive selection favours individuals at both extremes of the phenotype range and selects against the intermediate phenotype.
This can increase variation within a population and may eventually lead to the formation of two distinct groups.
For example, in a population of seed–eating birds, those with very large or very small beaks may be favoured if large and small seeds are abundant but medium–sized seeds are scarce, selecting against birds with average beak sizes.
Genetic drift is the random change in allele frequency in a population due to chance events, not because an allele is advantageous.
It has a greater effect in small populations, where each individual represents a larger proportion of the gene pool. Random events such as which individuals breed or die can cause large shifts in allele frequency between generations. Rare alleles may be lost entirely or become fixed by chance, reducing genetic diversity and making the population less able to adapt.
In large populations, random effects are averaged out and allele frequencies remain more stable.
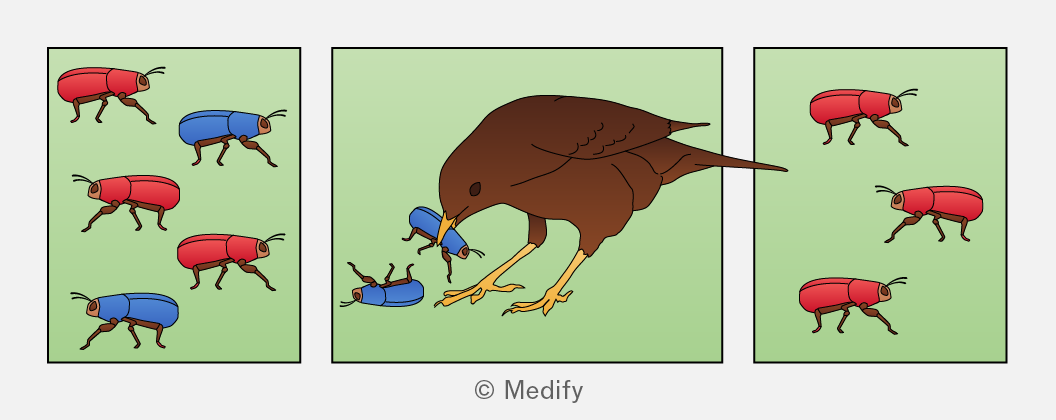
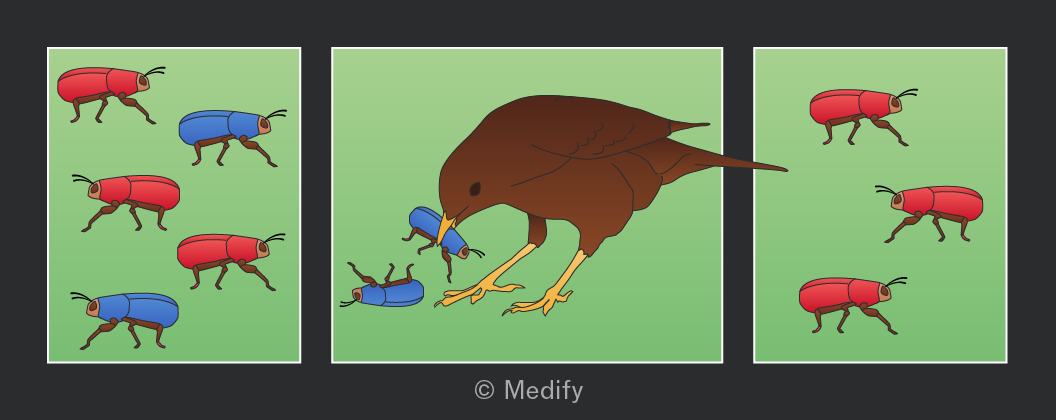
New species can arise from populations of an existing species.
When populations are reproductively isolated from each other, they evolve independently. Their gene pools may be under different selection pressures or may experience different mutations or genetic drift.
Over time, changes to the allele frequencies in the separate populations accumulate to such a degree that they cannot interbreed to produce fertile offspring. They have become different species.
A geographical barrier (e.g., mountains, rivers, seas) separating populations is the most common cause of reproductive isolation, leading to the formation of a new species. This process is called allopatric speciation.
Either side of the barrier, each population experiences:
- Different selection pressures (e.g., climate, predators, food) which favour different alleles.
- Mutations introducing new alleles.
- Genetic drift (especially in small populations).
Over time, allele frequencies change independently in each population, and the gene pools diverge.
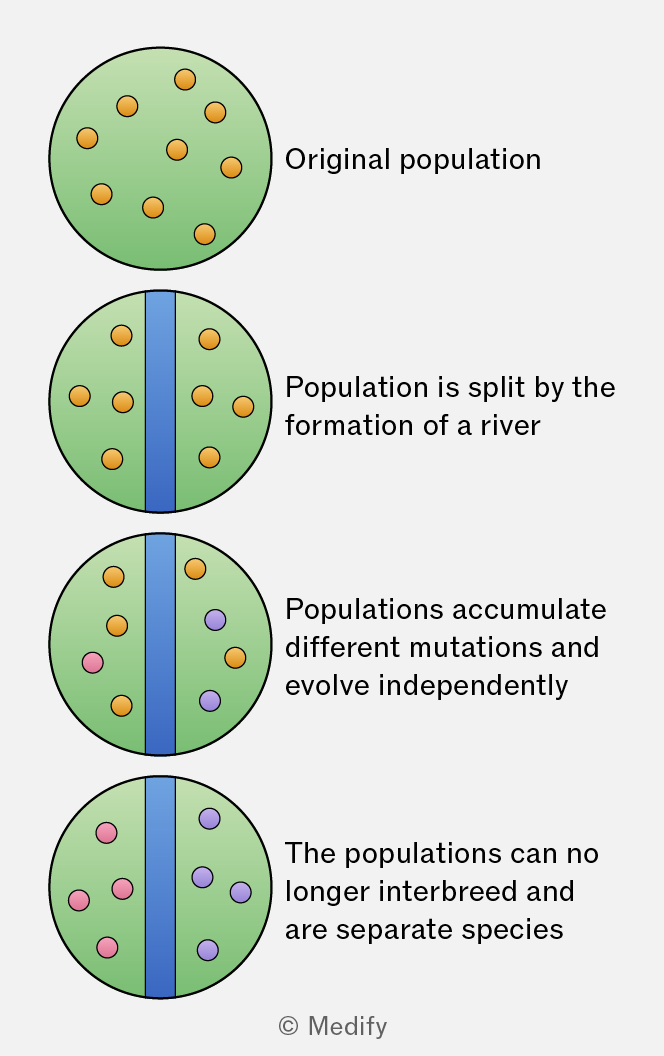
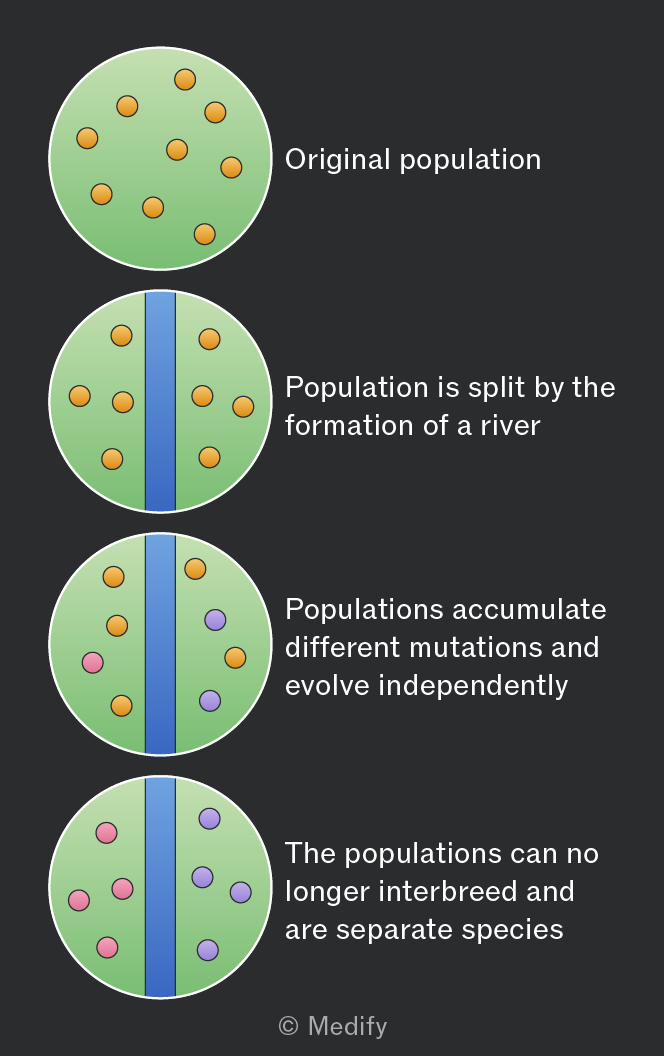
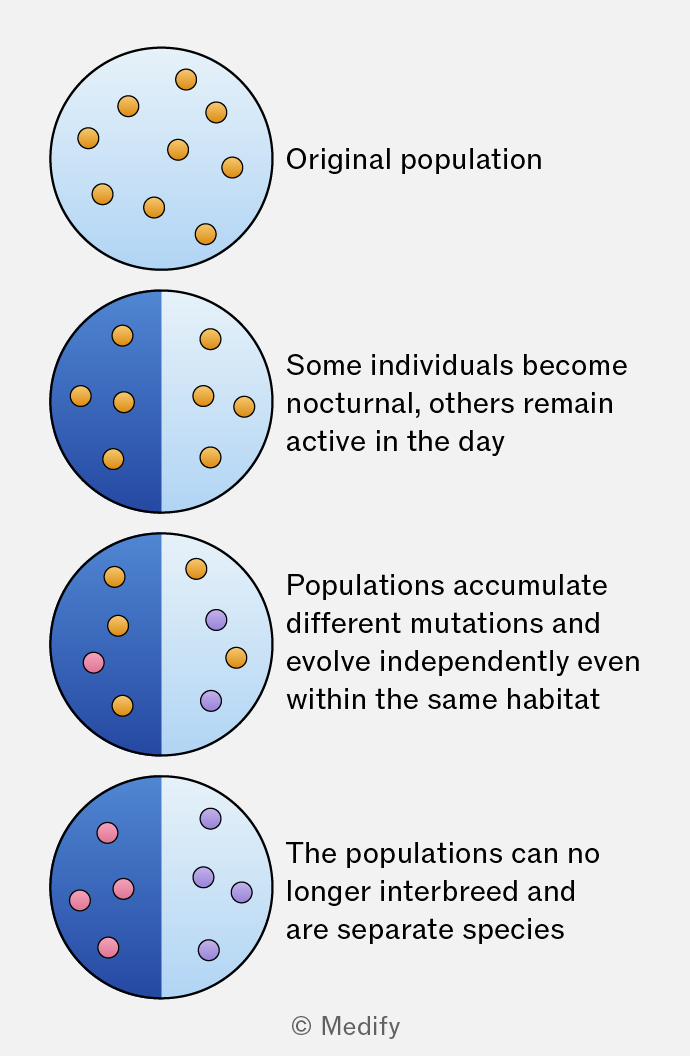
Less commonly, speciation can occur in populations that share a habitat. This is called sympatric speciation.
Reproductive isolation can be arise in many ways, including by:
- Behavioural differences (mating calls, courtship rituals).
- Ecological differences (feeding in different habitats).
- Temporal isolation (breeding at different times of year / day).
- Polyploidy differences (extra sets of chromosomes – common in plants).
Over time, a lack of interbreeding means there is no gene flow between the populations, and genetic differences build up.