
Photosynthesis (5.2.1)
On this page
Producers, such as plants and algae, carry out photosynthesis to make their own glucose. This glucose is used for cellular processes such as polysaccharide synthesis or for respiration (to release energy).
Respiration requires glucose and oxygen and releases carbon dioxide, water and energy in the form of ATP. Chemical energy is released during this process.
Overall equation:
Photosynthesis is an endothermic process which converts energy from sunlight into chemical energy. Energy from sunlight splits water molecules, which are then combined with carbon dioxide to form glucose. Oxygen is produced as a waste product.
Overall equation:
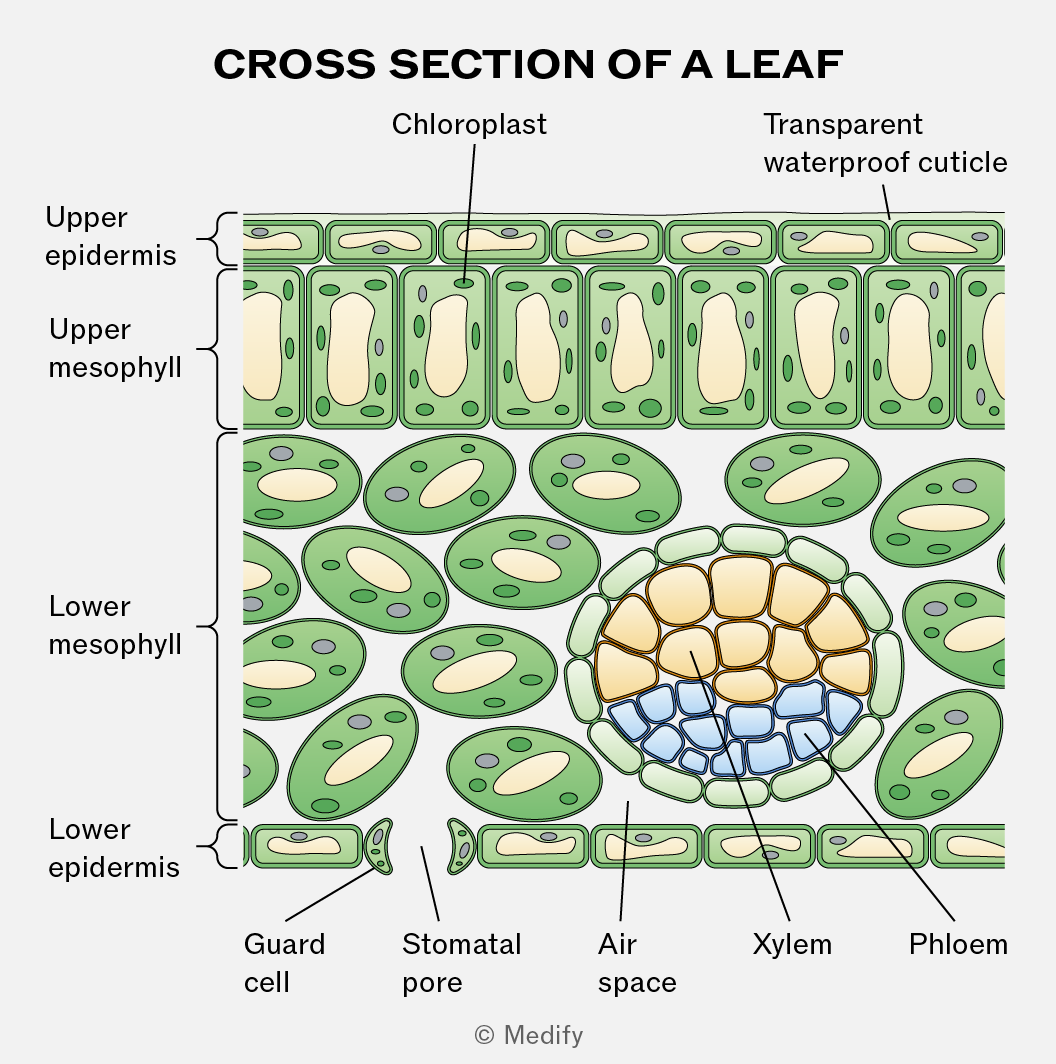
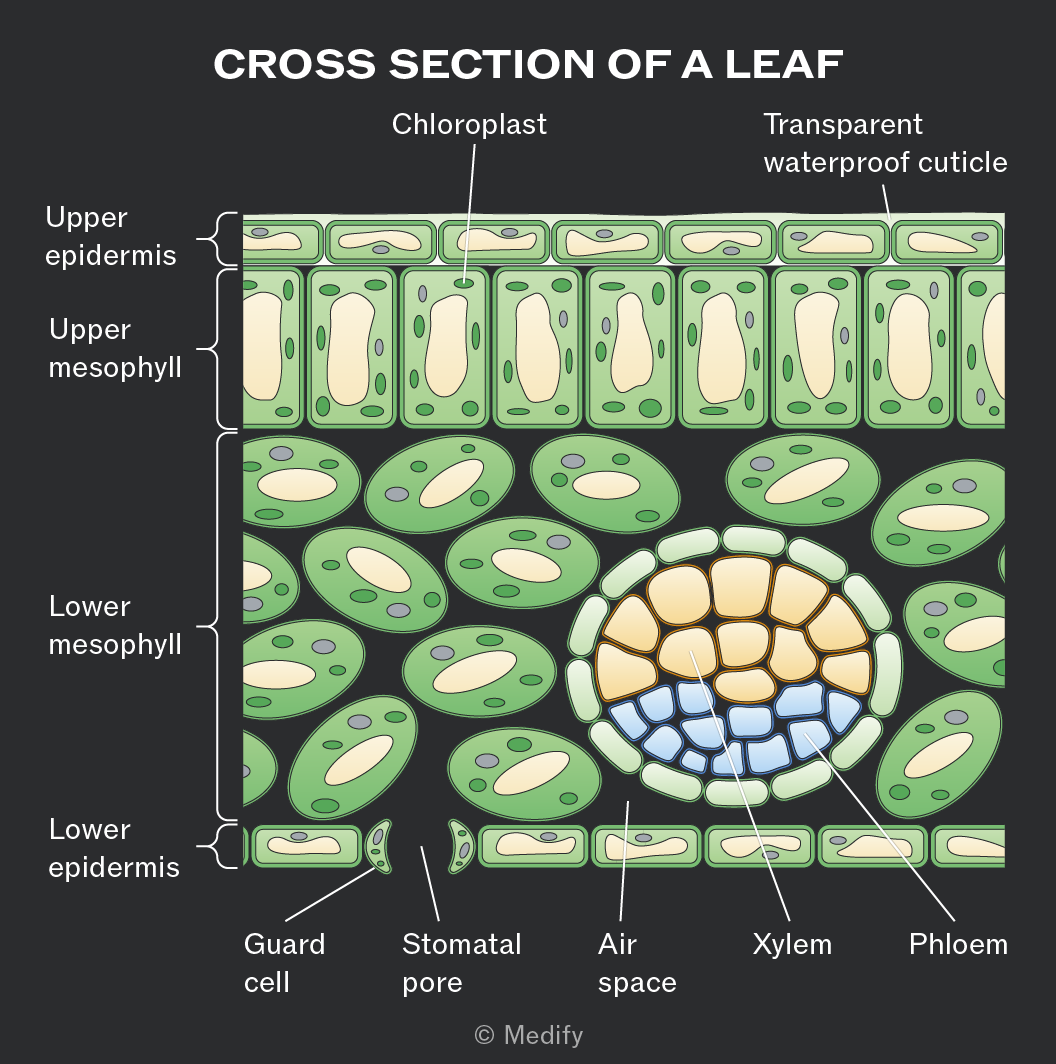
Leaves have many adaptations to maximise photosynthesis:
- Large surface area to absorb sunlight.
- Leaves are usually thin to reduce the diffusion distance of gases.
- Transparent cuticle and upper epidermis to allow light to pass through.
- Columnar upper mesophyll cells contain many chloroplasts.
- Stomata open and close depending on light intensity to balance water loss and gas exchange.
- Air spaces in the lower mesophyll layer allow diffusion of gases.
- Xylem and phloem to transport water to the leaves and remove sugars produced during photosynthesis.
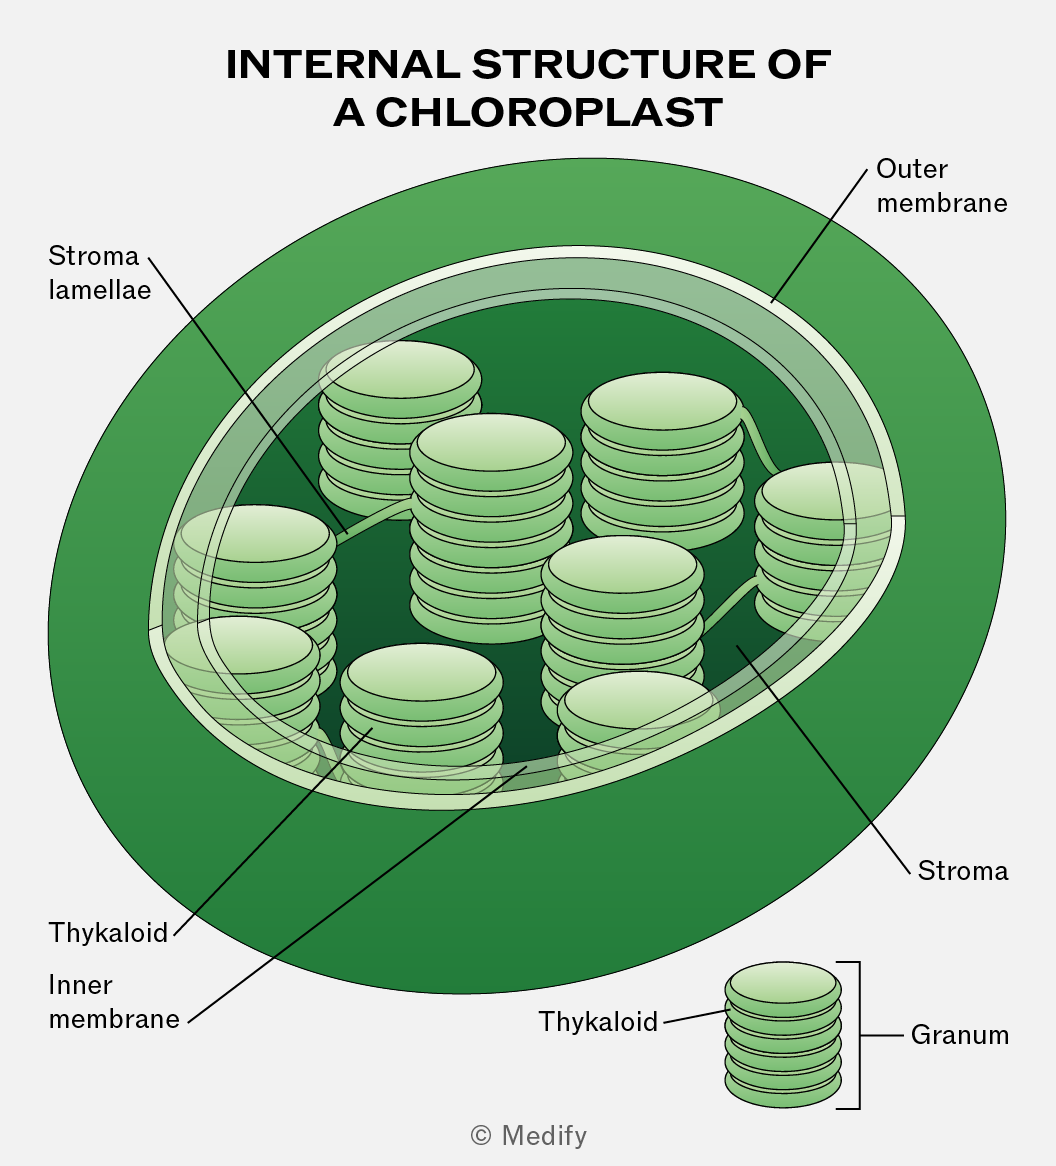
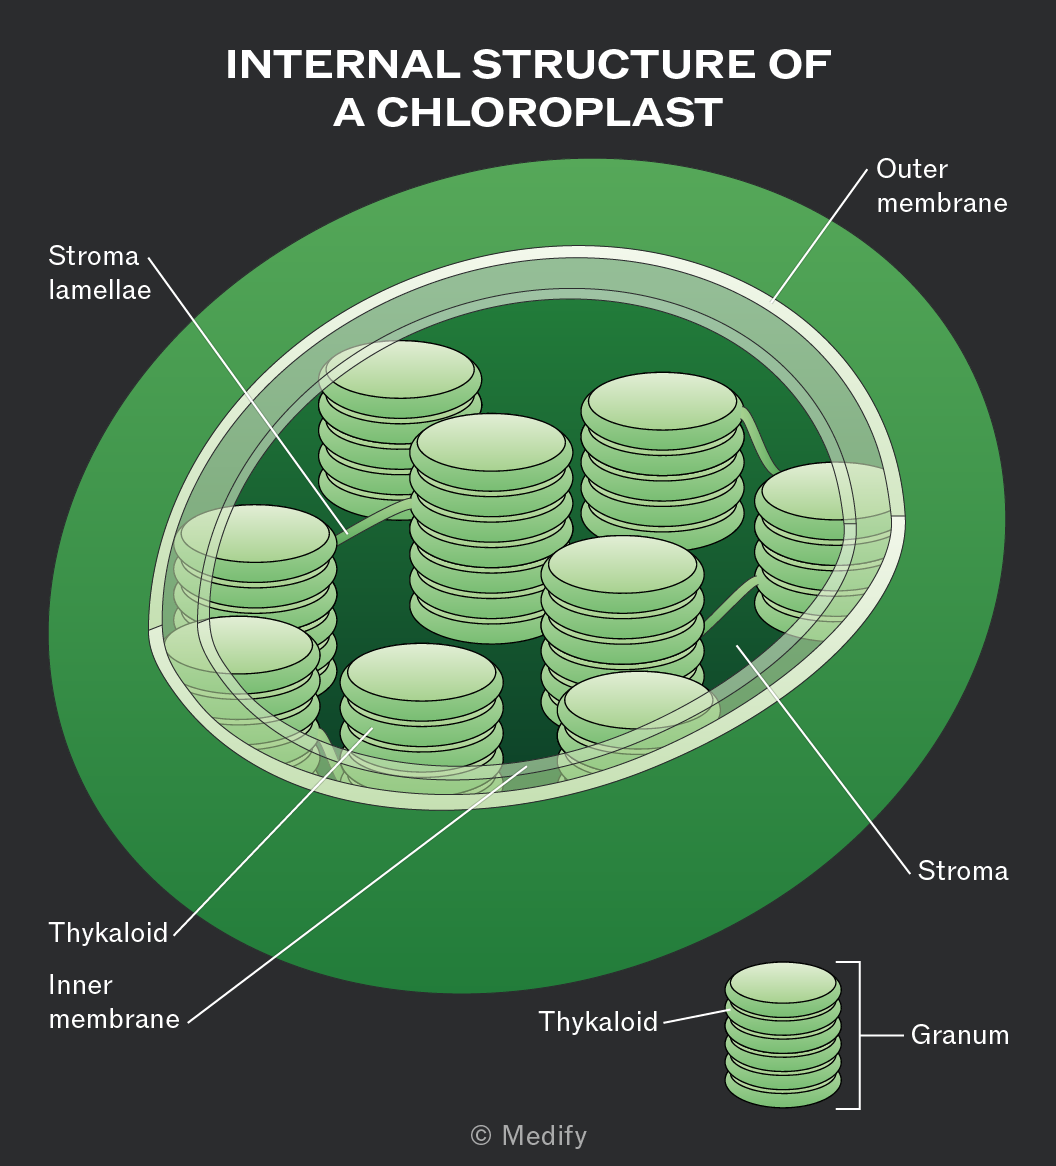
Chloroplasts are specialised organelles found in plants and algae where photosynthesis occurs.
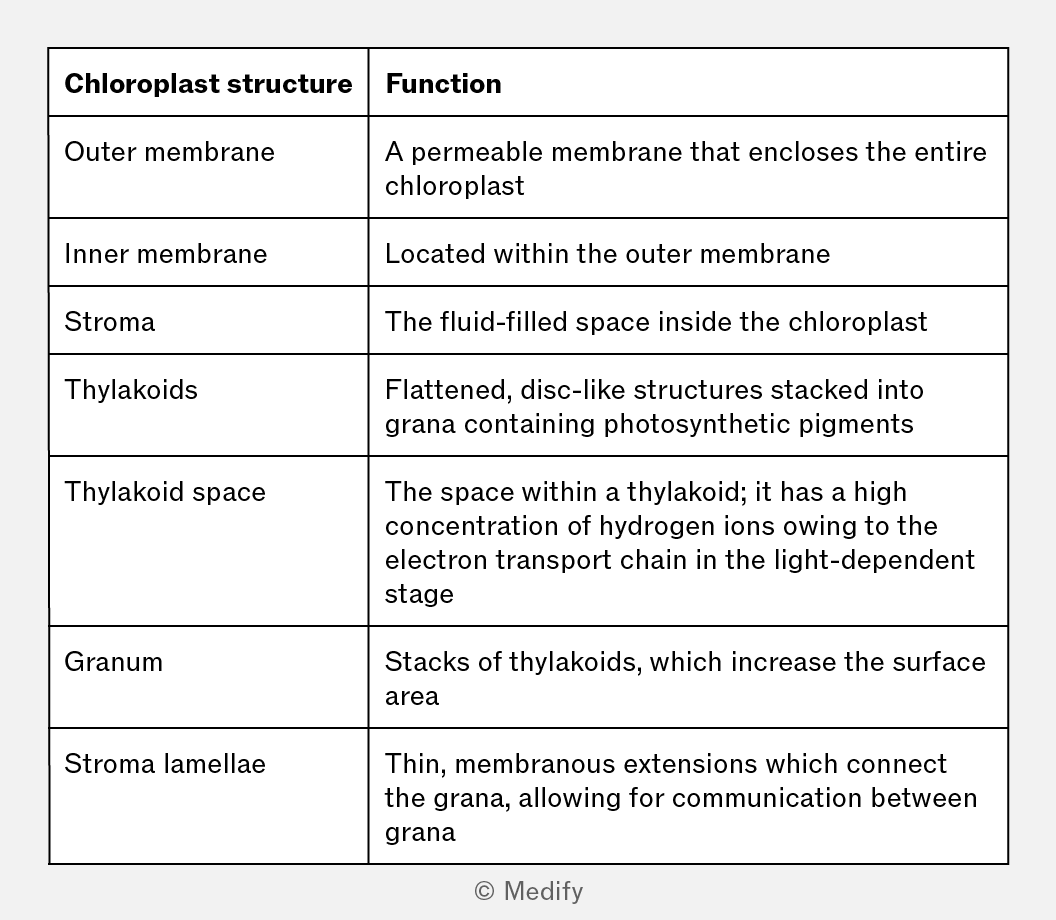
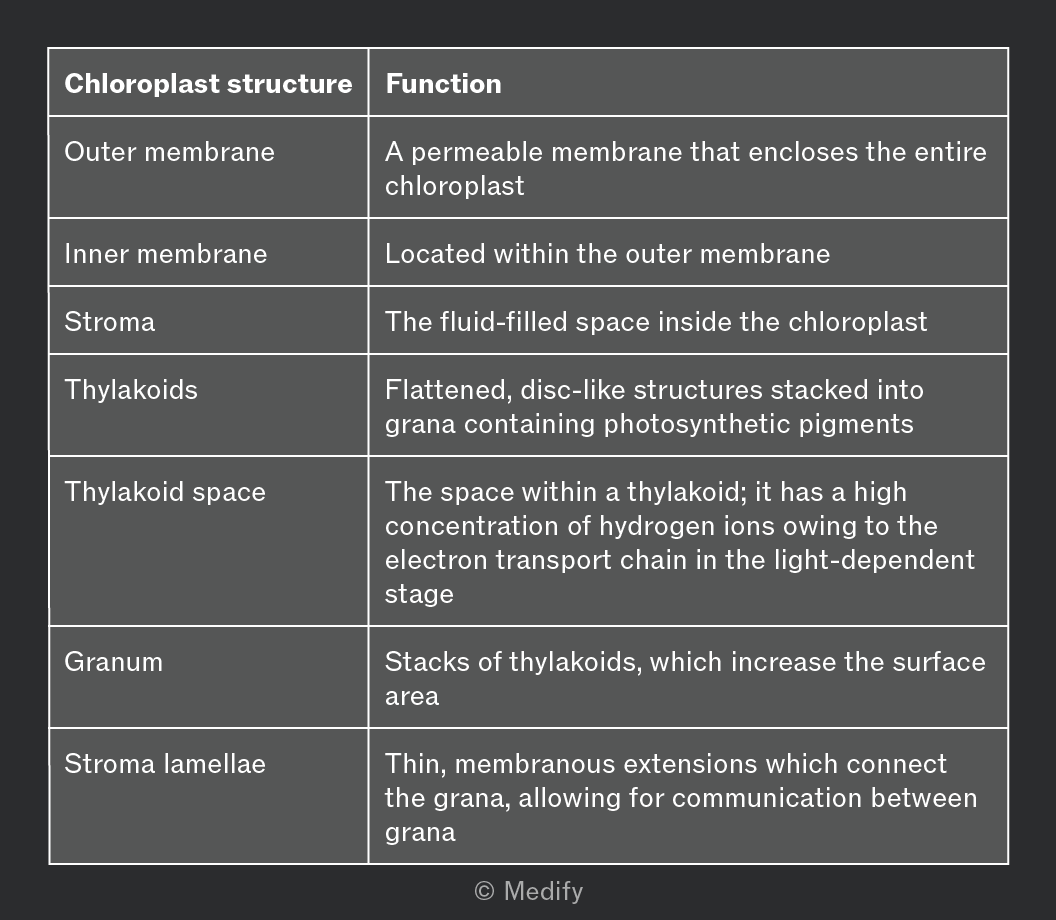
The light-dependent reactions occur in the thylakoid membrane. The thylakoids have a large surface area, increasing the membrane surface available for photosynthetic reactions. Chlorophyll, other photosynthetic pigments and enzymes involved in the light-dependent reaction are found within the thylakoid membrane.
The light-independent reaction occurs in the stroma. The stroma contains chloroplast DNA and ribosomes so is able to make some of its own proteins and enzymes. The stroma is where organic molecules are produced.
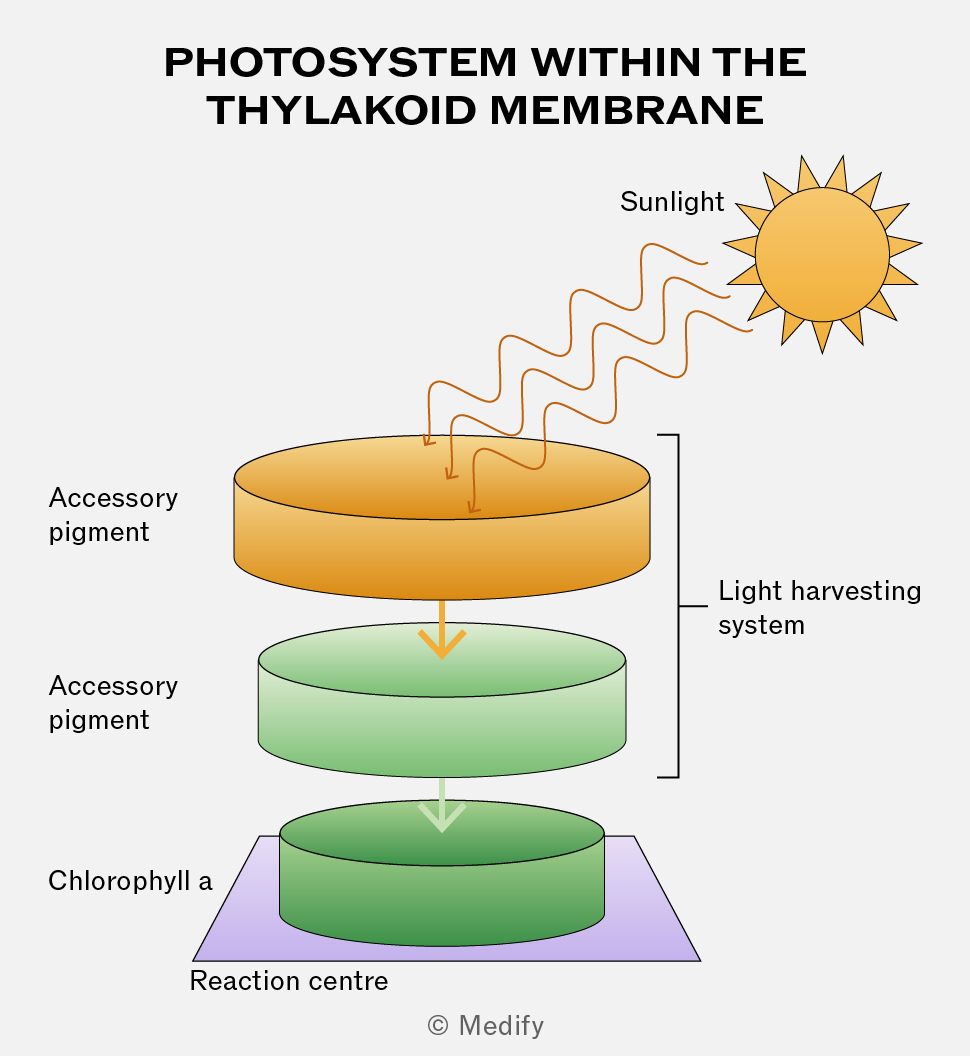
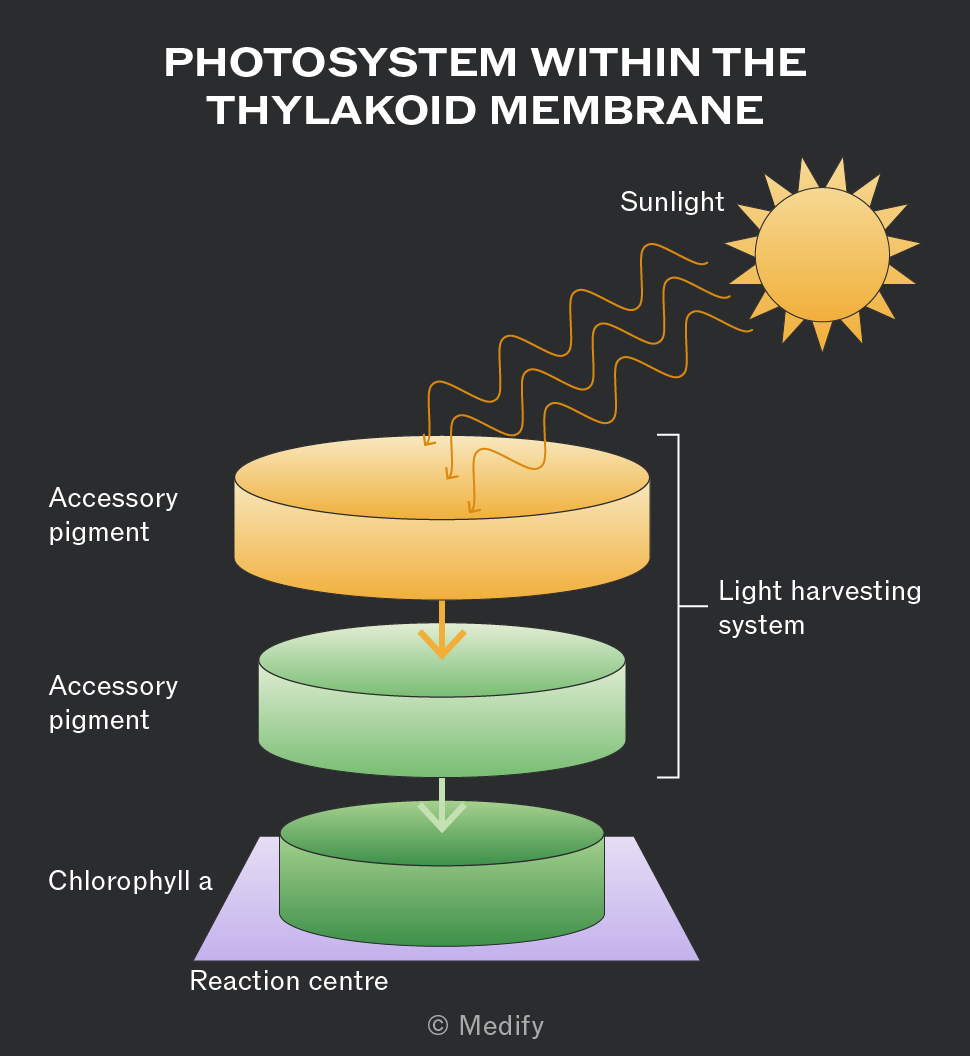
Chlorophyll a is the primary pigment within the reaction centre of the chloroplast. It is a green pigment which absorbs red and blue light.
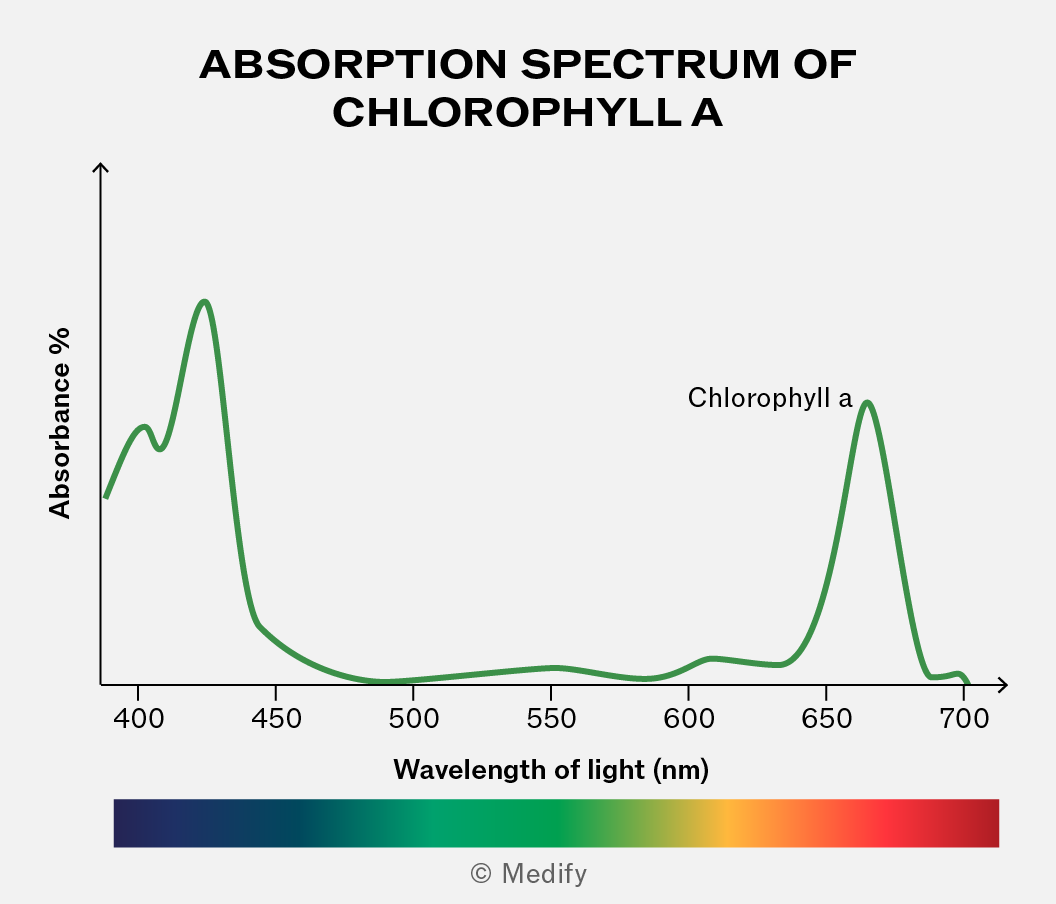
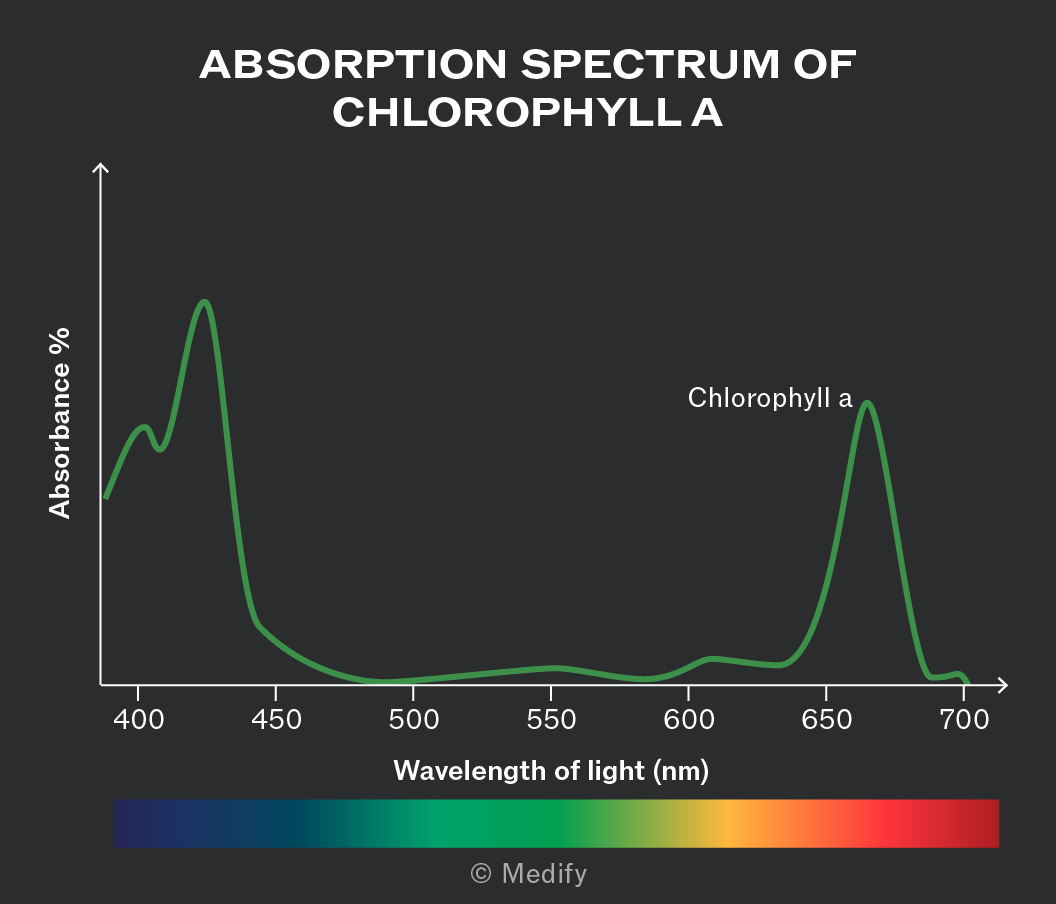
Accessory pigments, for example, carotenoids and chlorophyll b, are also embedded in the thylakoid membrane.
The accessory pigments are known as the light harvesting system. They absorb different wavelengths of light and transfer the energy to the primary pigment (chlorophyll a) in the reaction centre. The reaction centre uses the energy for the light-dependent stage of photosynthesis.
The reaction centre and light harvesting system together are known as the photosystem.
Thin layer chromatography (TLC) can be used to separate a mixture of photosynthetic pigments depending on their solubilities.
The stationary phase is silica, which is layered on plastic for support. The mobile phase is a mixture of different solvents.
The more soluble the pigment is in the mobile phase, the further the pigment will move.
Different plant species can use different accessory pigments, so the chromatogram may show a different mixture of photosynthetic pigments.
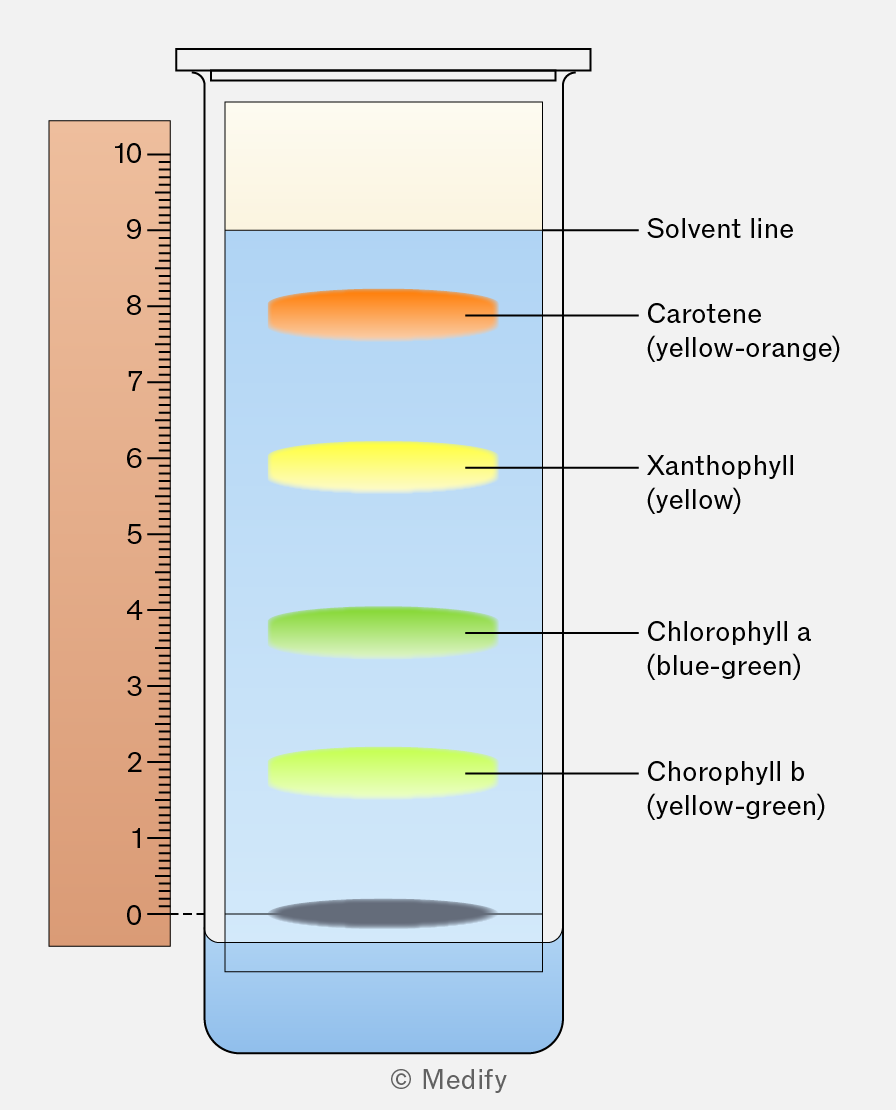
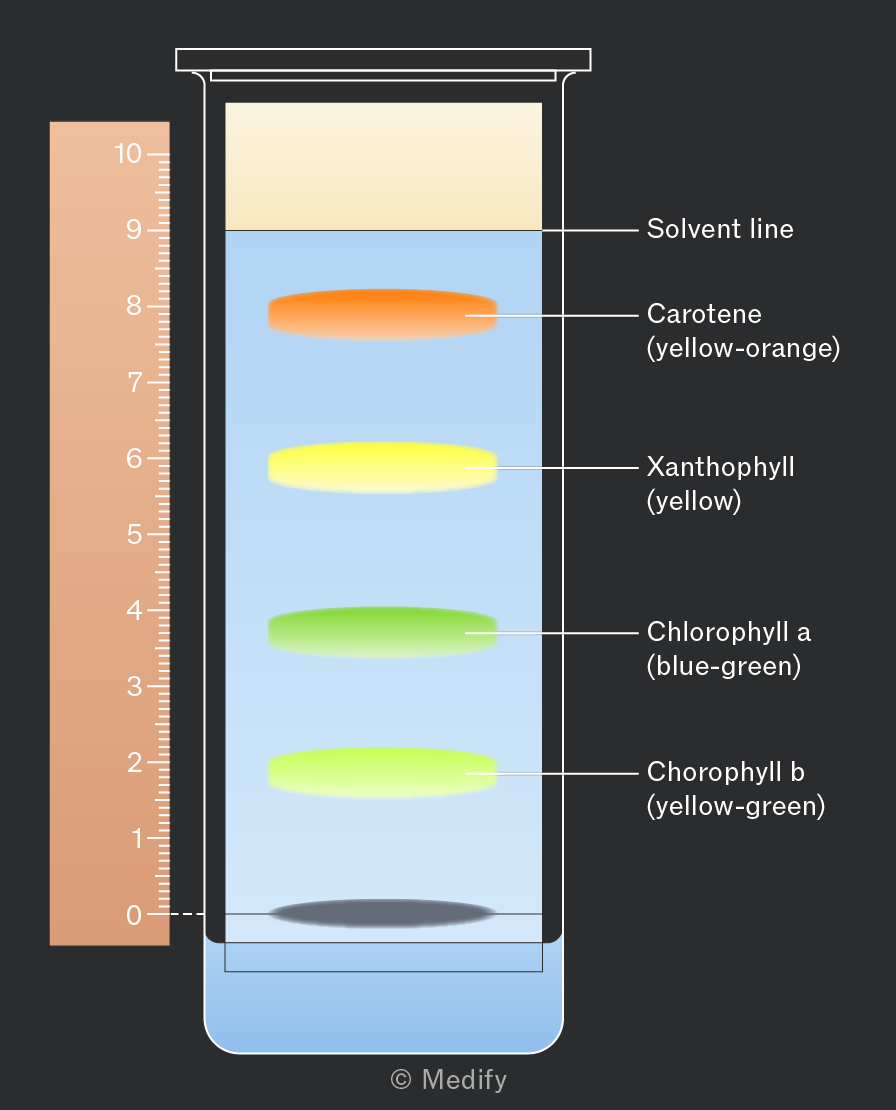
The retention factor (Rf) can be determined for each photosynthetic pigment.
The Rf value of the pigment may be different depending on the solvents used in the mobile phase.
Coenzyme NADP can be represented in different ways. For example, coenzyme NADP can also be written as NADP+, whilst reduced NADP can be shown as NADPH or NADPH + H+.
The coenzymes and their reduced forms in the following notes are shown in the same way as in the exam board specification.
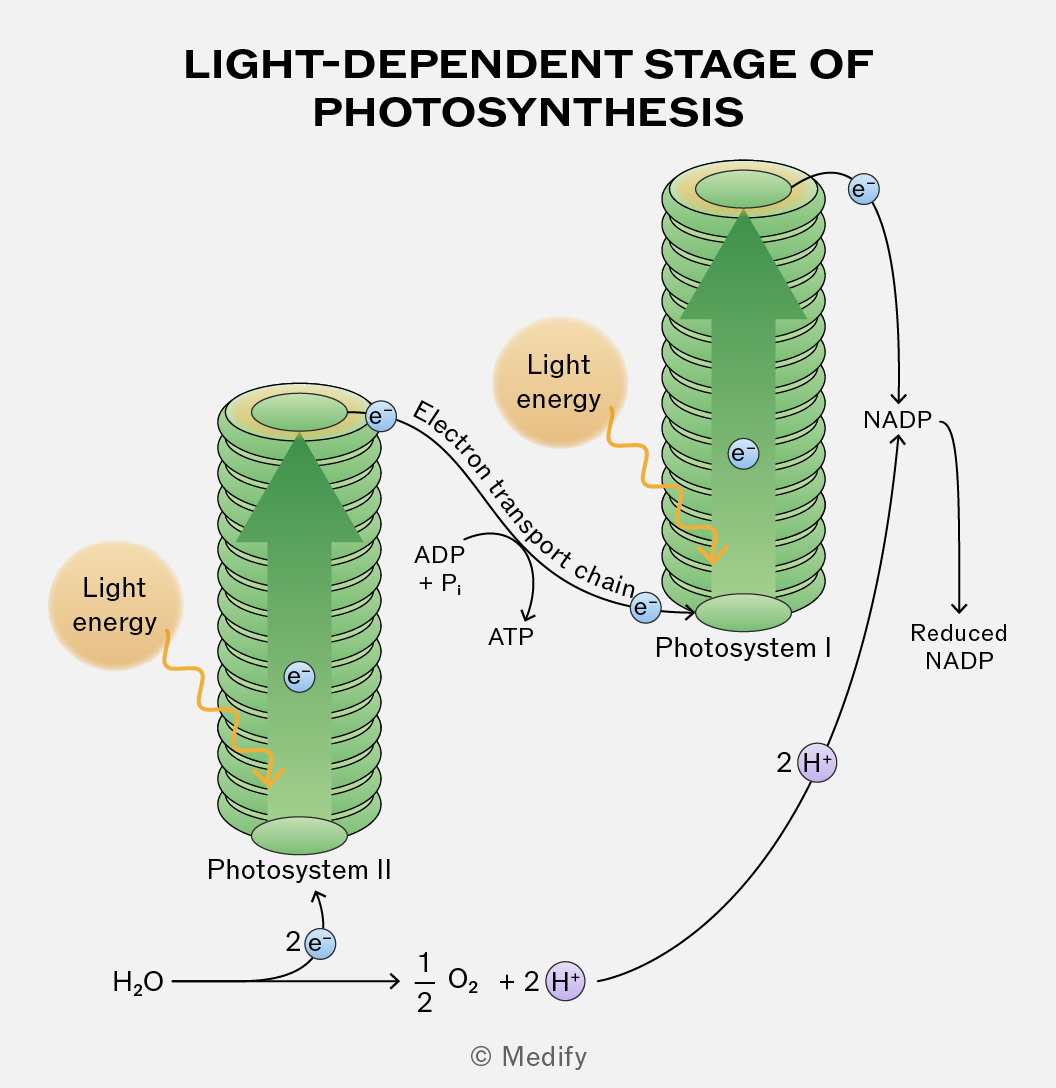
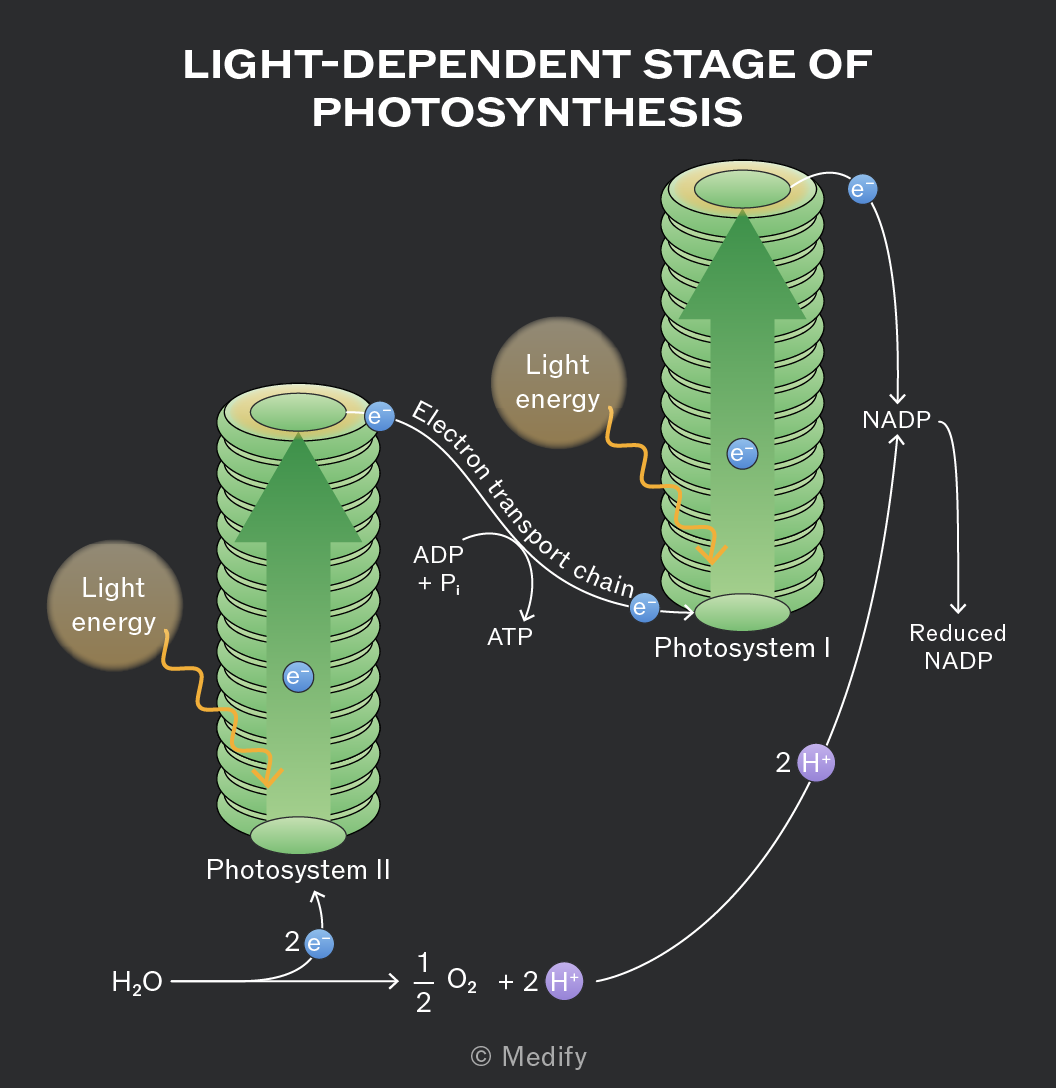
Photosynthesis occurs in two stages. The first is the light-dependent reaction where sunlight is used to split water molecules, producing ATP (and oxygen as a waste product). The coenzyme NADP is converted to reduced NADP by accepting hydrogen ions and electrons.
The second stage is the light-independent stage. This stage uses the ATP and reduced NADP made in the first stage. It also uses carbon dioxide, along with the hydrogen ions and electrons from reduced NADP, to build organic molecules such as glucose.
During photosynthesis, photolysis occurs when light splits water molecules into oxygen, hydrogen ions, and electrons.
This process is carried out by the oxygen-evolving complex, which is part of photosystem II.
Overall yield:
In the light-dependent stage, 680 wavelength light is absorbed by photosystem II. This light is used to excite the electrons released during photolysis. These electrons are used in an electron transport chain to produce ATP by the process of chemiosmosis.
The same excited electrons are then used by photosystem I which absorbs 700 wavelength light and transfers this energy to the electrons. The electrons are excited and used for another electron transport chain. These excited electrons are then combined with hydrogen ions and NADP to produce reduced NADP.
The transfer of electrons through both photosystems in the light-dependent reaction is called non-cyclic photophosphorylation.
Electron transport chains are used in cell processes such as photosynthesis and respiration.
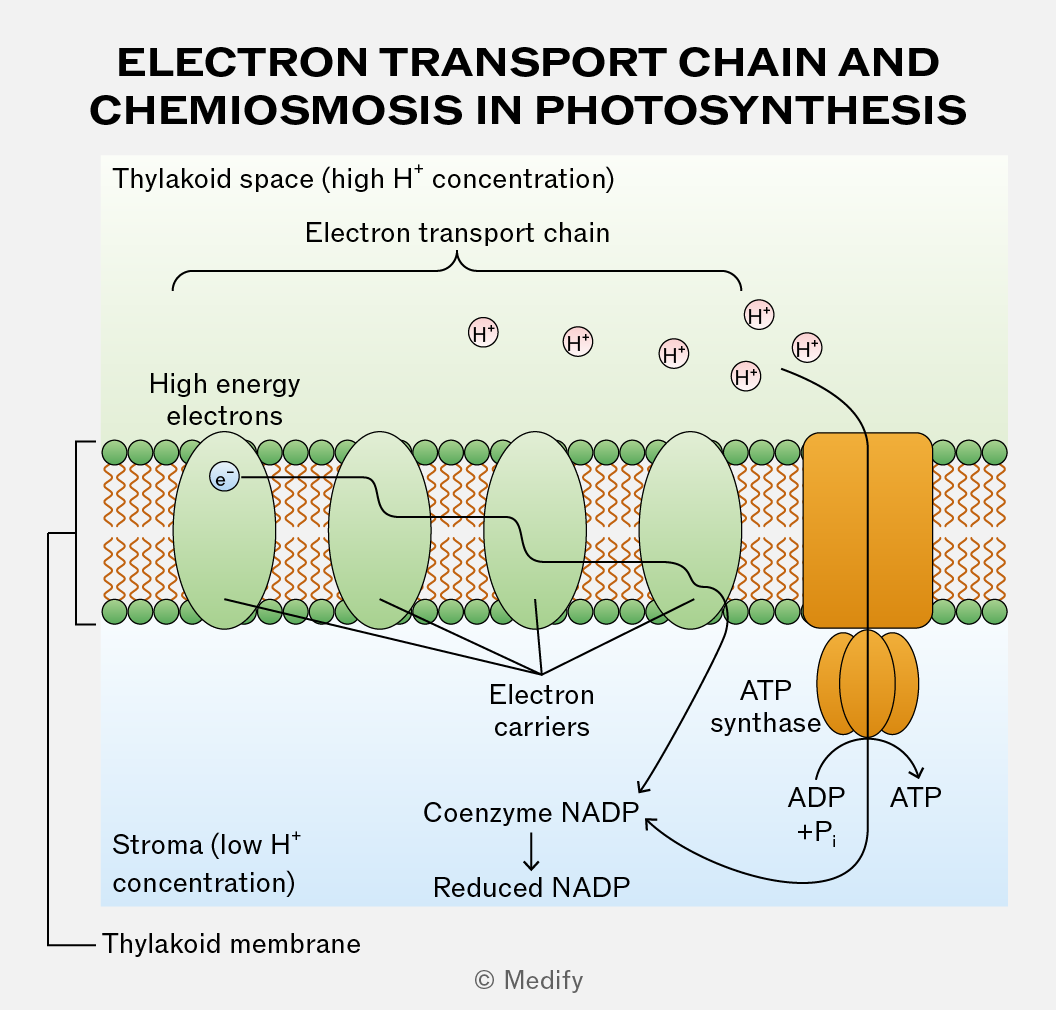
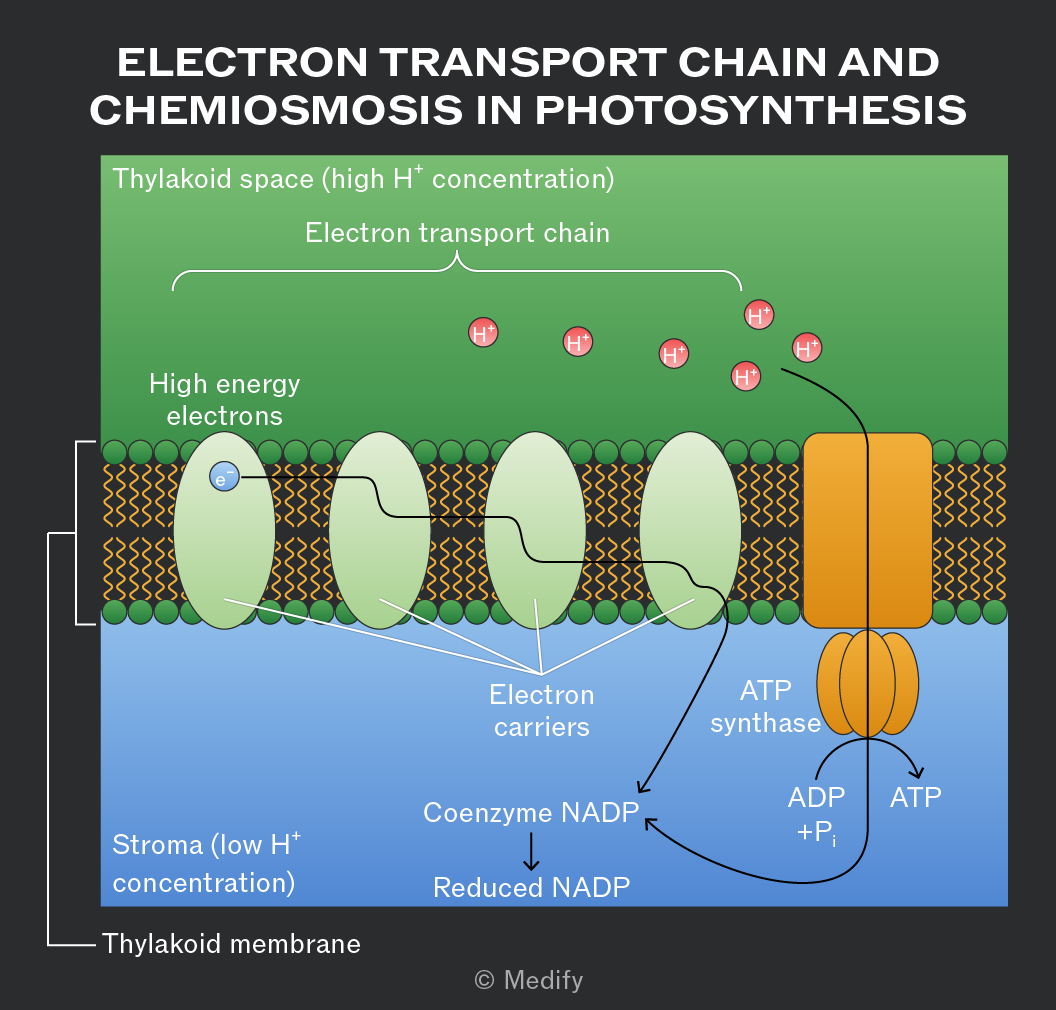
They transfer high-energy electrons through a series of four electron carriers (complexes) which are embedded in a membrane, such as the thylakoid membrane, in photosynthesis.
Each complex is reduced when it receives electrons and oxidised when it passes electrons to the next complex. The energy from the electrons is gradually transferred during the process and is used to create a hydrogen ion gradient.
Chemiosmosis is used to produce ATP in cell processes such as respiration and photosynthesis.
A hydrogen ion gradient is produced by the energy released in the electron transport chain. In photosynthesis, there is a higher concentration of hydrogen ions in the thylakoid space than the stroma. As hydrogen ions flow through the ATP synthase, the ATP synthase converts ADP and Pi into ATP.
The hydrogen ions, electrons from the electron transport chain and NADP are combined to make reduced NADP.
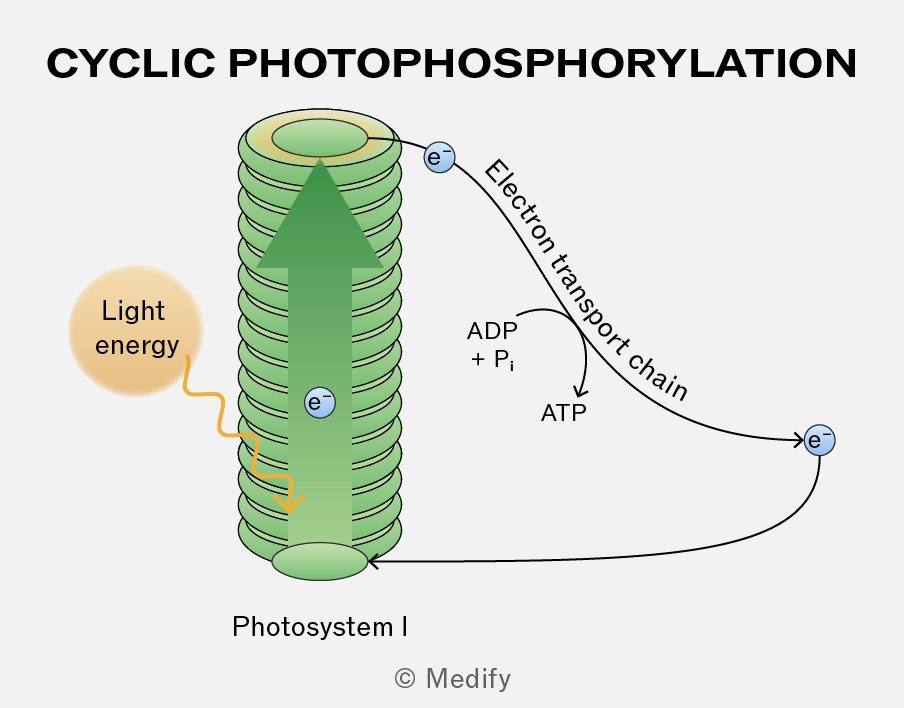
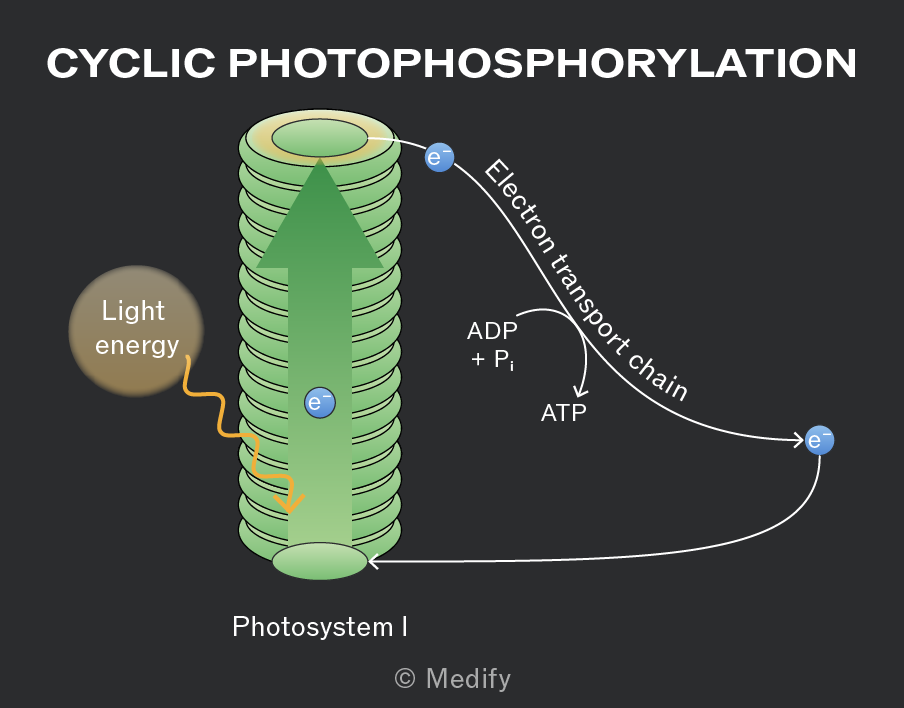
In cyclic photophosphorylation, the electrons from the electron transport chain after photosystem I can be returned to the start of photosystem I, to repeat the process. This process does not produce reduced NADP; instead, the electrons are recycled by photosystem I and excited using sunlight to produce ATP. This means electrons do not need to be supplied by photosystem II.
The light-independent stage of photosynthesis occurs in the stroma of the chloroplast.
This stage uses the ATP and reduced NADP from the light-dependent stage along with carbon dioxide to produce organic molecules such as glucose, lipids and proteins.
The light-independent stage remakes NADP which can then be used again in the light-dependent stage.
Carbon dioxide diffuses into the stroma for the light-independent stage of photosynthesis. This involves a series of enzyme-controlled reactions called the Calvin cycle.
In the Calvin cycle, carbon dioxide reacts with ribulose bisphosphate (RuBP), a 5C molecule, in a carboxylation reaction catalysed by the enzyme ribulose bisphosphate carboxylase (RuBisCO). This forms an unstable 6C intermediate, which breaks down to form 2 × 3C glycerate 3-phosphate.
Each glycerate 3-phosphate is converted to 3C triose phosphate. This reaction uses reduced NADP and ATP to produce NADP, ADP and Pi.
Triose phosphate can then either be recycled into RuBP or used to make organic molecules such as glucose, lipids and amino acids.
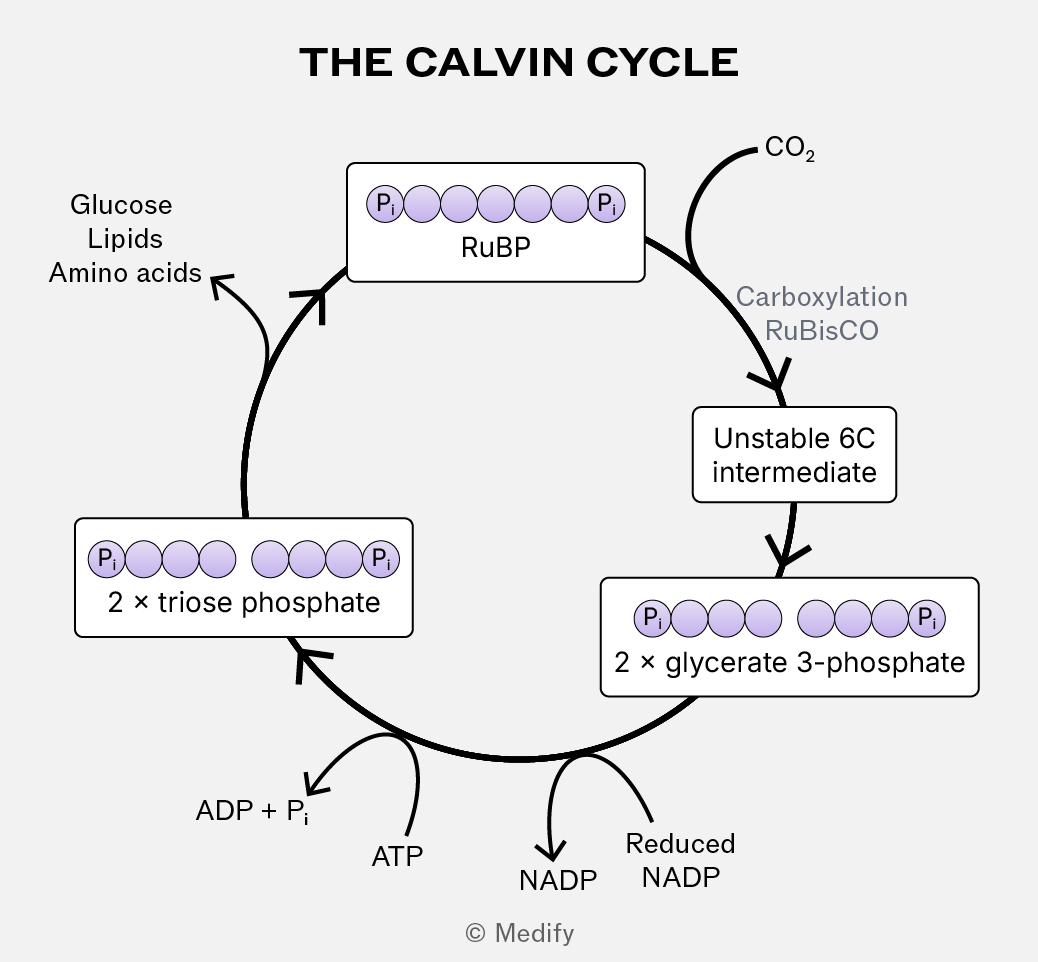
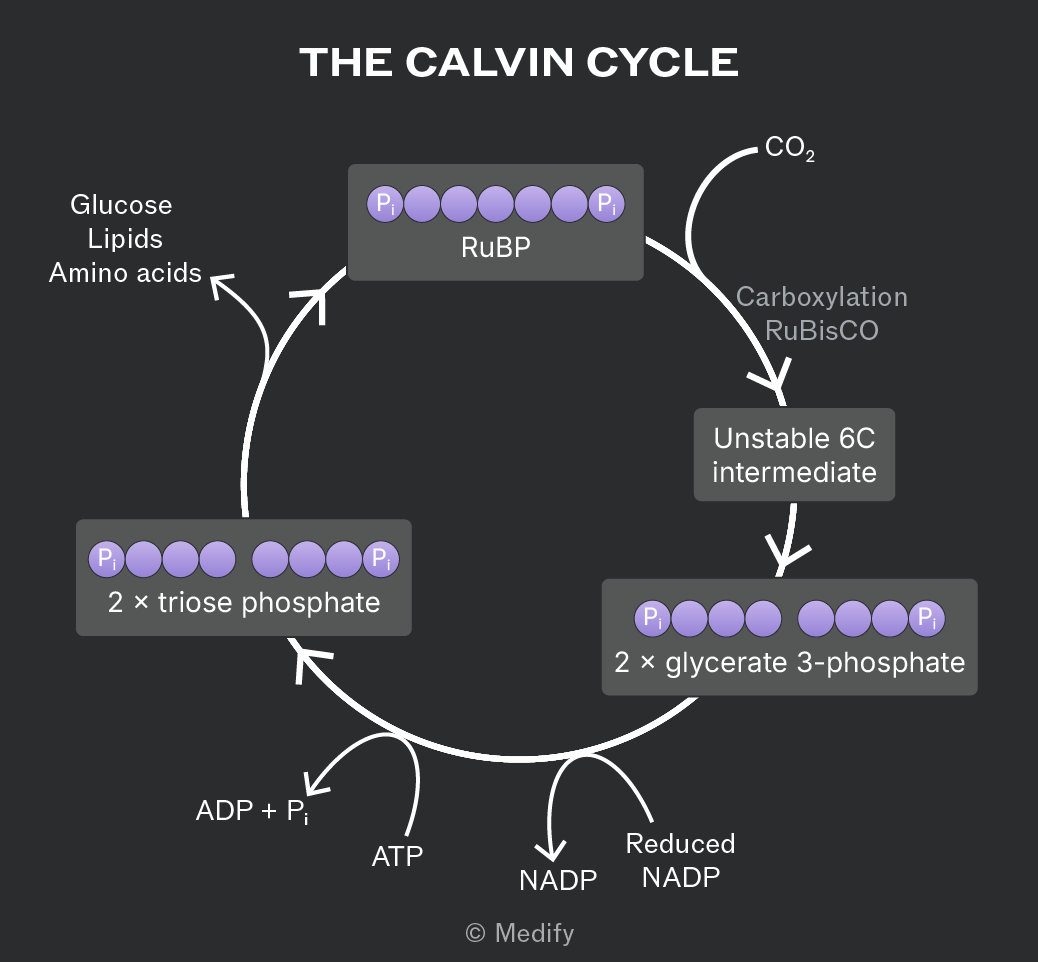
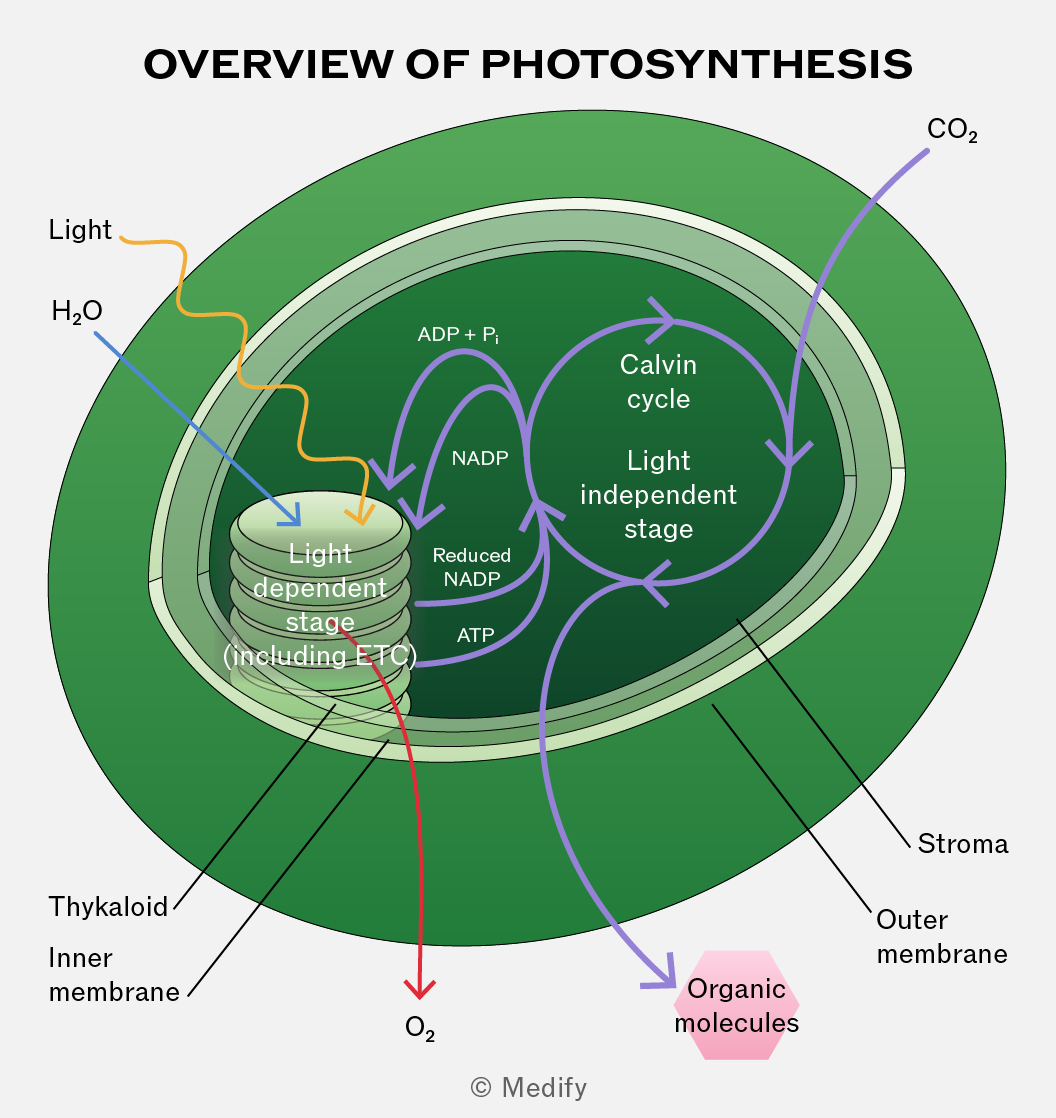
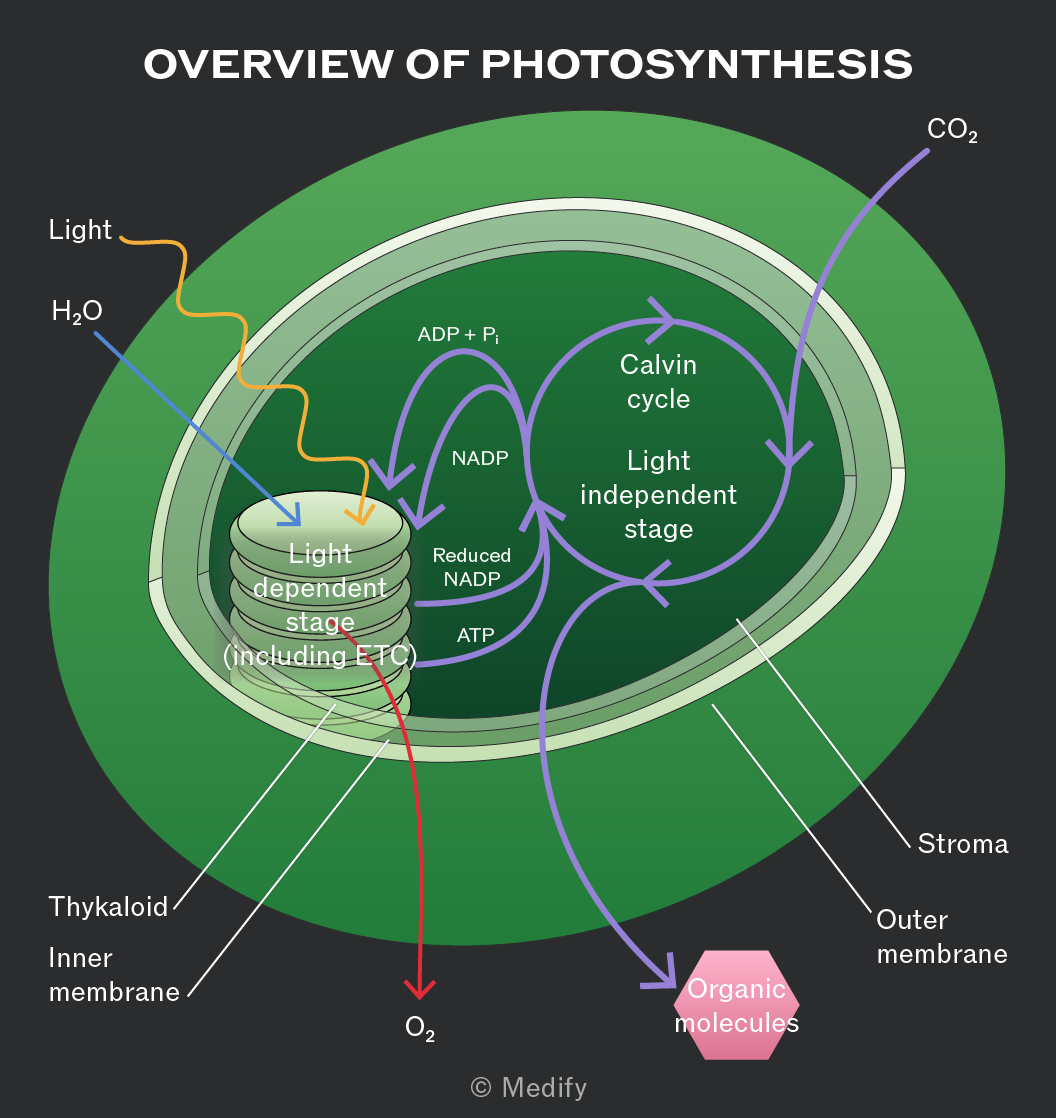
Most of the triose phosphate produced in the Calvin cycle is recycled to produce RuBP, which requires ATP and allows the Calvin cycle to continue. Some of the triose phosphate is used to produce organic molecules, such as glucose.
Six Calvin cycles require 6 molecules of carbon dioxide and produce 12 triose phosphate molecules. 10 triose phosphate molecules are used to regenerate the original 6 RuBP molecules. The remaining 2 triose phosphate molecules can be used to make 1 molecule of glucose.
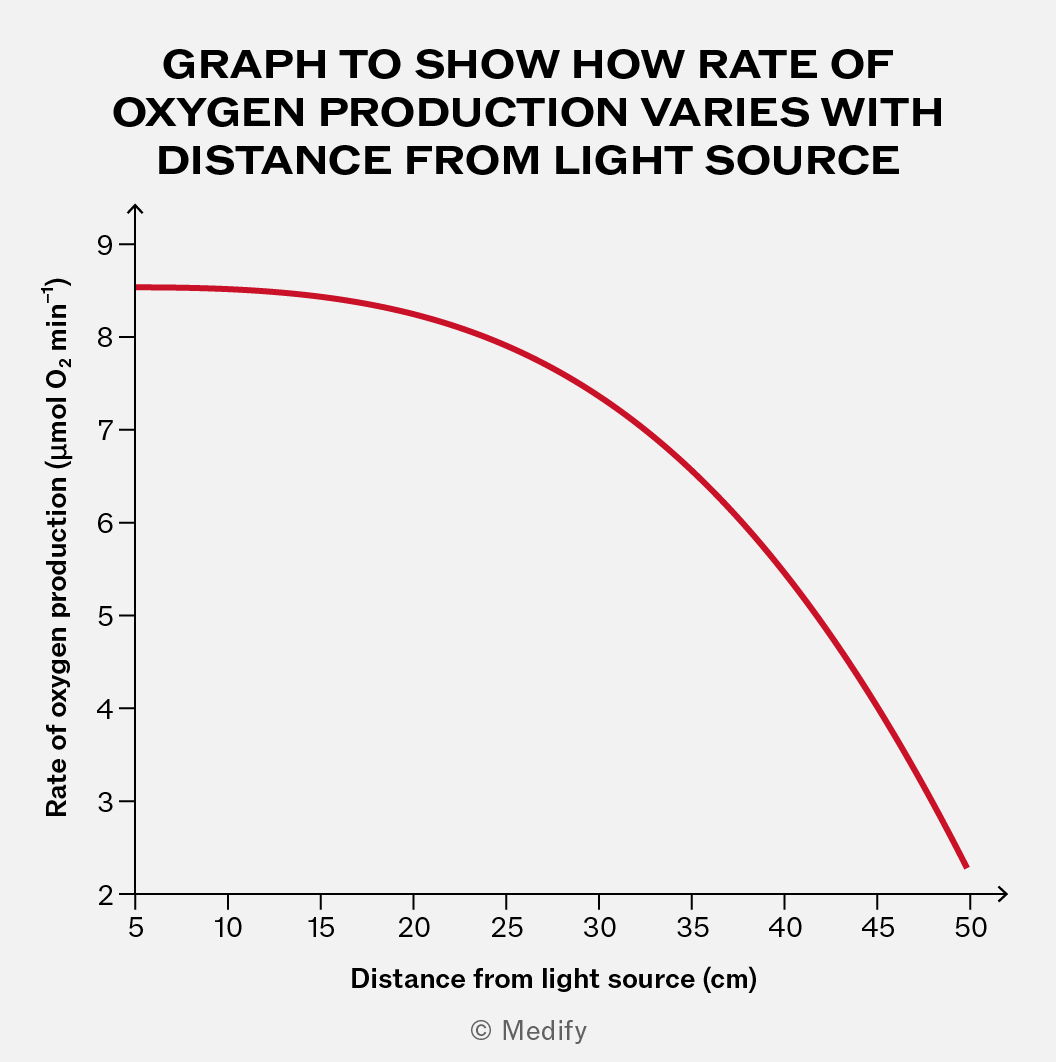
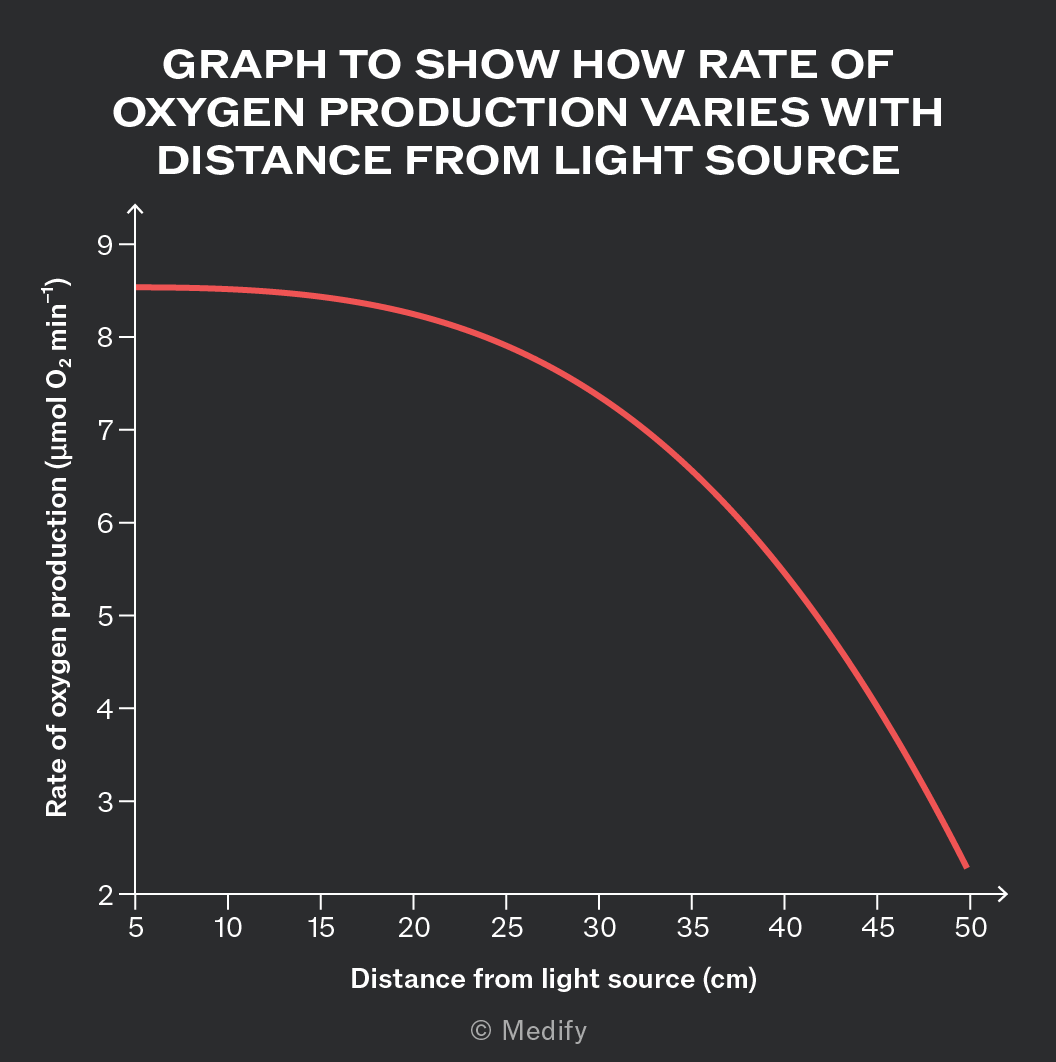
As light intensity increases, the rate of photosynthesis increases. The rate of photosynthesis will level off when a different factor limits the process.
As light intensity increases, the rate of the light-dependent stage will increase. This leads to increased ATP and increased reduced NADP production.
As the Calvin cycle will have sufficient ATP and reduced NADP, RuBP and triose phosphate production will increase. This will also increase the rate at which glyceraldehyde 3-phosphate is produced in the Calvin cycle.
As the distance between a plant and a light source decreases, the rate of photosynthesis increases. This can be measured by observing an increase in oxygen production.
As the concentration of carbon dioxide increases, the rate of photosynthesis increases. The rate of the reactions in the Calvin cycle will increase which increases the rate at which RuBP is used and triose phosphate is produced.
Carbon dioxide accounts for 0.04 of atmospheric gases and is often the limiting factor in photosynthesis.
The vast majority of the reactions involved in photosynthesis are catalysed by enzymes. As temperature increases, the rate of photosynthesis initially increases because particles have more kinetic energy.
Above the enzymes’ optimum temperature, the rate of photosynthesis will decrease due to enzyme denaturation.
Water is rarely a direct limiting factor in photosynthesis.
If a plant does not have sufficient water for cell turgidity, it experiences water stress. The stomata will close in response, preventing carbon dioxide from diffusing into the leaf. The light-independent reaction will be unable to take place, which causes photosynthesis to stop entirely.