
Acids, bases and buffers (5.1.3)
On this page
A Brønsted–Lowry acid is defined as a chemical species which donates protons.
An example of this is the reaction between sulfuric acid and water.
A Brønsted–Lowry base is a chemical species which accepts protons.
An example of this is the reaction between a hydrogen ion and ammonia molecule, where a proton is accepted by the ammonia molecule:
Note that does NOT release hydroxide ions. It produces an excess of hydroxide ions by deprotonation of water in solution.
Conjugate acid: The species formed when a base gains a proton.
Conjugate base: The species formed when an acid loses a proton.
A conjugate acid–base pair consists of two species that transform into each other by the gain or loss of a proton.
In this reaction:
- is the acid, and is its conjugate base.
- is the base, and is its conjugate acid.
A monobasic acid, also known as a monoprotic acid, releases one proton per molecule when dissolved in water.
Hydrochloric acid
A dibasic acid, also known as a diprotic acid, can donate two protons per molecule. This usually occurs in two steps.
Sulfuric acid
is a dibasic acid because it donates two protons per molecule, one in each step.
A tribasic acid, also known as a triprotic acid, can donate three protons per molecule. This occurs in three steps.
Phosphoric acid
is a tribasic acid because it donates three protons per molecule, one in each step.
Question walkthrough
Conjugate acid-base pairs
Identification of conjugate pairs in an acid-base reaction
Metal + Acid → Salt + Hydrogen
Zinc reacts with hydrochloric acid:
In ionic form:
Carbonate + Acid → Salt + Water + Carbon Dioxide
Calcium carbonate reacts with sulfuric acid:
In ionic form this is:
The generation of carbon dioxide gas, following the addition of acid, tests for the presence of a carbonate.
Metal Oxide + Acid → Salt + Water
Magnesium oxide reacts with hydrochloric acid:
In ionic form:
Acid + Alkali → Salt + Water
Hydrochloric acid reacts with sodium hydroxide:
In ionic form:
The scale is a logarithmic scale used to measure the acidity or basicity of a solution. It is based on the concentration of hydrogen ions, , in the solution.
The of a solution is defined as the negative logarithm of the hydrogen ion concentration:
where:
- is the measure of the acidity or basicity of the solution.
- [] is the concentration of hydrogen ions in .
The hydrogen ion concentration can be calculated from the using the inverse logarithmic function:
The hydrogen ion concentration can be calculated from the using the inverse logarithmic function:
Neutral solution: Neutral solutions contain an equal concentration of hydrogen ions and hydroxide ions. A of indicates a neutral solution at s.t.p, where .
Acidic solution: Acidic solutions contain a higher concentration of hydrogen ions than hydroxide ions. A less than indicates an acidic solution at s.t.p, where [] is greater than .
Basic solution: Basic solutions contain a lower concentration of hydrogen ions than hydroxide ions. A greater than indicates a basic (alkaline) solution at s.t.p, where is less than .
The acid dissociation constant, , measures the strength of a weak acid by quantifying its degree of dissociation in aqueous solution.
For a generic weak acid , which partially dissociates into and , the equilibrium can be represented as:
The equilibrium constant for this dissociation is given by:
Where:
- is the concentration of hydrogen ions.
- is the concentration of the conjugate base.
- is the concentration of the undissociated acid.
A higher value indicates a stronger acid, which dissociates more in solution, producing more ions per mole of acid.
A lower is derived from a higher value, thus a lower indicates a stronger acid.
The is the negative logarithm of the acid dissociation constant :
The scale is used as values, like [], cover many orders of magnitude. This relationship provides a more convenient way to express acid strength on a logarithmic scale, which compresses the range of values.
Approximations are required to calculate the of a weak acid.
The concentration of the undissociated acid remains almost the same at equilibrium because the dissociation is minimal.
The concentration of hydrogen ions is approximately equal to the concentration of the conjugate base formed. This is due to the negligible dissociation of compared to the amount of hydrogen ions produced by dissociation of the weak acid.
For a weak acid dissociates as follows:
The acid dissociation constant is:
Using the approximations:
Which rearranges to give:
Allowing pH to be calculated from :
To calculate the for a weak acid, given the of a solution containing a known mass of acid, follow the steps below:
Determine initial concentration, using the mass and molar mass of the weak acid () to find initial concentration:
Convert the pH to the hydrogen ion concentration []:
Write down an expression for for weak acids applying the appropriate approximations:
Input the values to calculate .
For very weak acids, only a small fraction of the acid molecules dissociate in water. This justifies the approximations used to calculate , because the change in due to dissociation is minimal.
For stronger weak acids, where is higher, e.g. , the degree of dissociation increases.
As a larger fraction of the acid dissociates, the difference between and becomes more significant, invalidating the approximation.
Question walkthrough
Ka calculations with weak bases
Calculating the concentration of a weak base using Ka approximations
Water undergoes slight dissociation into and ions.
The ionic product of water, , is a special equilibrium constant that applies to the self-ionisation of water.
It quantifies the extent to which water dissociates into hydrogen ions () and hydroxide ions () at a given temperature.
Water molecules self-ionise according to the following equilibrium reaction:
The equilibrium constant for this dissociation, the ionic product of water, , and is defined as:
At (), the value of is:
This value changes with temperature; as temperature increases, increases because the dissociation of water is an endothermic process.
In a neutral solution the concentrations of and are equal.
In pure water, at s.t.p:
If an acid is added to water, increases and decreases to maintain
If a base is added, increases and decreases to maintain
The concentration of hydrogen ions [] in a solution of a strong monobasic acid, is equal to the initial concentration of the acid, since it fully dissociates.
Calculating the of a strong base requires the use of the ionic product of water.
At ()
- Determine the concentration of hydroxide ions from the concentration of the strong base.
- Rearrange the equation for , making the subject.
- Use the value obtained for [] to calculate pH.
Question walkthrough
Kw calculations
Using Kw to calculate the pH of a strong base
A buffer solution is a system that minimises changes in when small amounts of an acid or a base are added.
Stability in is crucial for many chemical and biological processes
A buffer solution typically consists of a mixture of:
- a weak acid () and its salt containing conjugate base ()
- a weak base () and its salt containing conjugate acid ().
The weak acid and its conjugate base, or the weak base and its conjugate acid, work together to maintain the equilibrium constant and neutralise added acids or bases, thus maintaining the of the solution within a narrow range.
Le Chatelier’s principle explains how the buffer system shifts equilibrium to minimise changes.
When a weak acid is mixed with a strong base, the strong base neutralises part of the weak acid, forming its conjugate base and water.
If the weak acid is in excess, the remaining acid and the formed conjugate base create a buffer solution:
In an acidic buffer solution containing a weak acid () and its conjugate base () the buffer system responds to the addition of acids and bases in the following way:
Addition of acid (): The excess conjugate base () reacts with the added to form more of the weak acid (), thus reducing the increase in concentration and minimising the pH change:
Addition of base (): The undissociated weak acid () reacts with the added to form water and more conjugate base (), thus reducing the increase in concentration and minimising the pH change:
In a basic buffer solution containing a weak base () and its conjugate acid , the buffer system responds to the addition of acids and bases in the following way:
Addition of acid (): The weak base () reacts with the added to form its conjugate acid (), reducing the increase in concentration and minimising the change:
Addition of Base (): The excess of conjugate acid () reacts with the added to form water and the weak base (), reducing the increase in concentration and minimising the change:
In an acidic buffer solution contain a ethanoic acid mixed with its salt, sodium ethanoate, the solution contains both the weak acid and its conjugate base.
Chemical equilibrium is maintained according to the value of the weak acid.
Buffer action and Le Chatelier’s principle:
Addition of acid (): The ethanoate ions () react with the added to form more ethanoic acid (). According to Le Chatelier’s principle, the system will shift to the left to counter the increase in , thus minimising the change.
Addition of base (): The ethanoic acid () reacts with the added to form water and ethanoate ions (). The system will shift to the right to counter the removal of by , again minimising the change.
In the conjugate base and weak acid buffer, the roles of each component are as follows:
Conjugate base: Acts as a proton acceptor. When extra ions (acid) are added to the solution, the conjugate base reacts with these ions, thereby removing them from the solution and forming more weak acid . This prevents the from dropping significantly.
Weak acid : Acts as a proton donor. When extra ions (base) are added to the solution, the weak acid donates protons to neutralise the ions, forming water and its conjugate base. This prevents the from rising significantly.
The of a buffer solution can be calculated by directly using the acid dissociation constant (), the concentrations of the weak acid, and the concentration of the conjugate base.
Substitute the concentrations into the equation:
Solve for []:
Calculate the pH:
Remember that, when a pair of solutions are mixed to form a buffer, new concentrations must be calculated based on the combined volume.
The calculation process when a buffer solution is formed through the reaction of an excess of weak acid with a strong base needs to factor in the reduction of the moles of following reaction with the base.
The amount of conjugate acid, , can be calculated directly from the amount of strong base used.
The reaction stoichiometry can be used to work out the remaining amount of weak acid, .
Both amounts should be converted to concentration using the combined volume of the solutions.
Maintaining the of blood within the narrow range of 7.35 to 7.45 is crucial for proper physiological function; in particular, the stability of enzymes.
The carbonic acid () – hydrogencarbonate () buffer system plays a key role in this process.
- Carbonic acid (): A weak acid that can donate protons () to the solution.
- Hydrogencarbonate (): The conjugate base of carbonic acid, capable of accepting protons.
The equilibrium between these components can be represented as:
When a small amount of acid is added to the blood:
The additional hydrogen ions () from the strong acid react with to form .
This minimises change: The formation of reduces the concentration of ions, mitigating the decrease.
When a small amount of base is added to the blood:
The hydroxide ions from the base react with to form and .
This minimises change: The conversion of to and water consumes ions, mitigating the increase.
titration curves represent the change in as an acid is incrementally neutralised by a base, or vice versa.
Titration curves are crucial for understanding the neutralisation process and for selecting appropriate indicators to determine the endpoint of a titration.
Strong acid with strong base
Example: Hydrochloric acid () titrated with sodium hydroxide ().
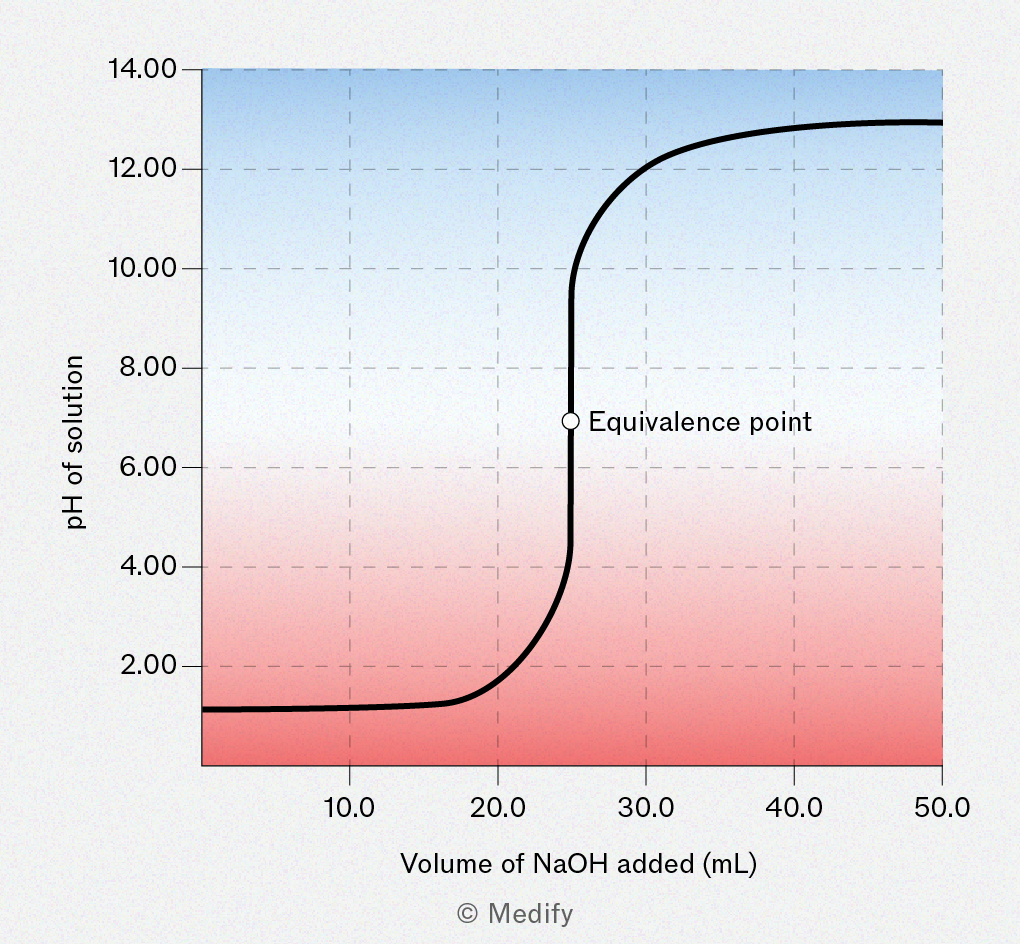
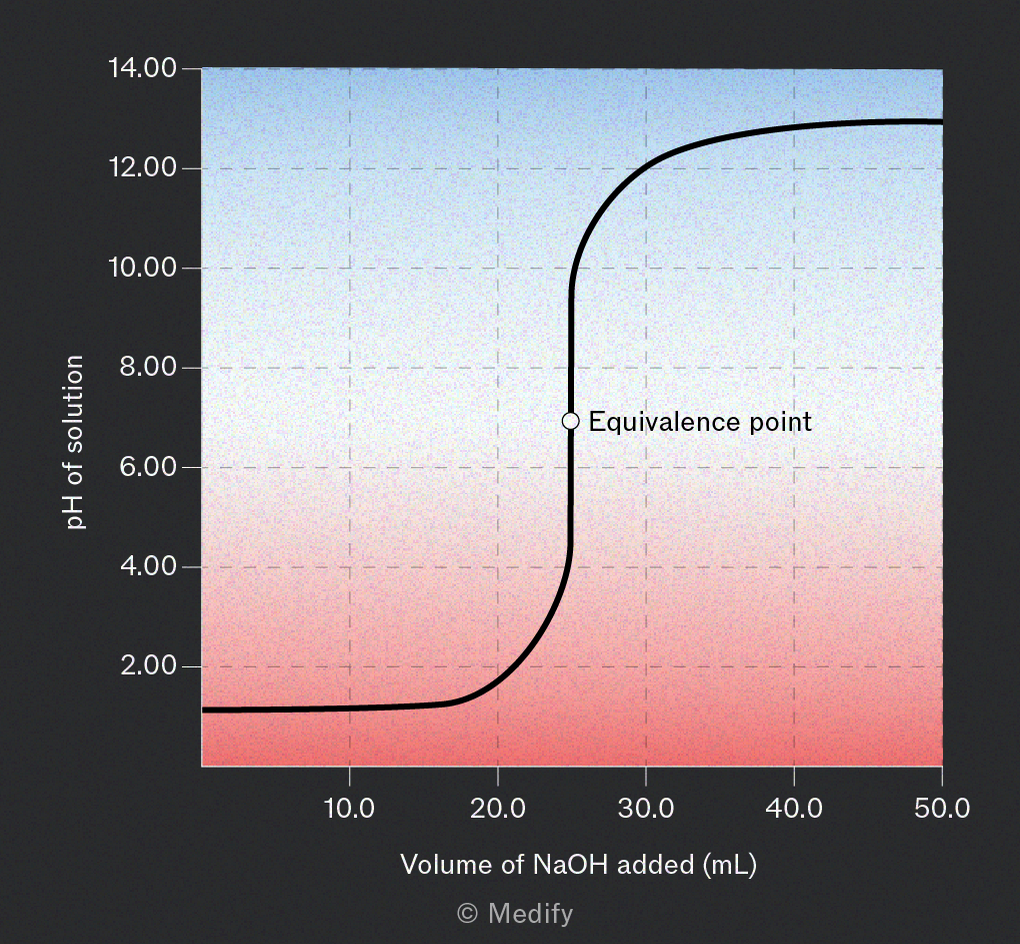
Starts at a low (strong acid), rises slowly initially, then steeply at the point of neutralisation.
There are a range of values which can represent neutralisation centring at an equivalence point of 7.
Following neutralisation the quickly levels off at a high .
Weak base with a strong acid
Example: Ammonia () titrated with .
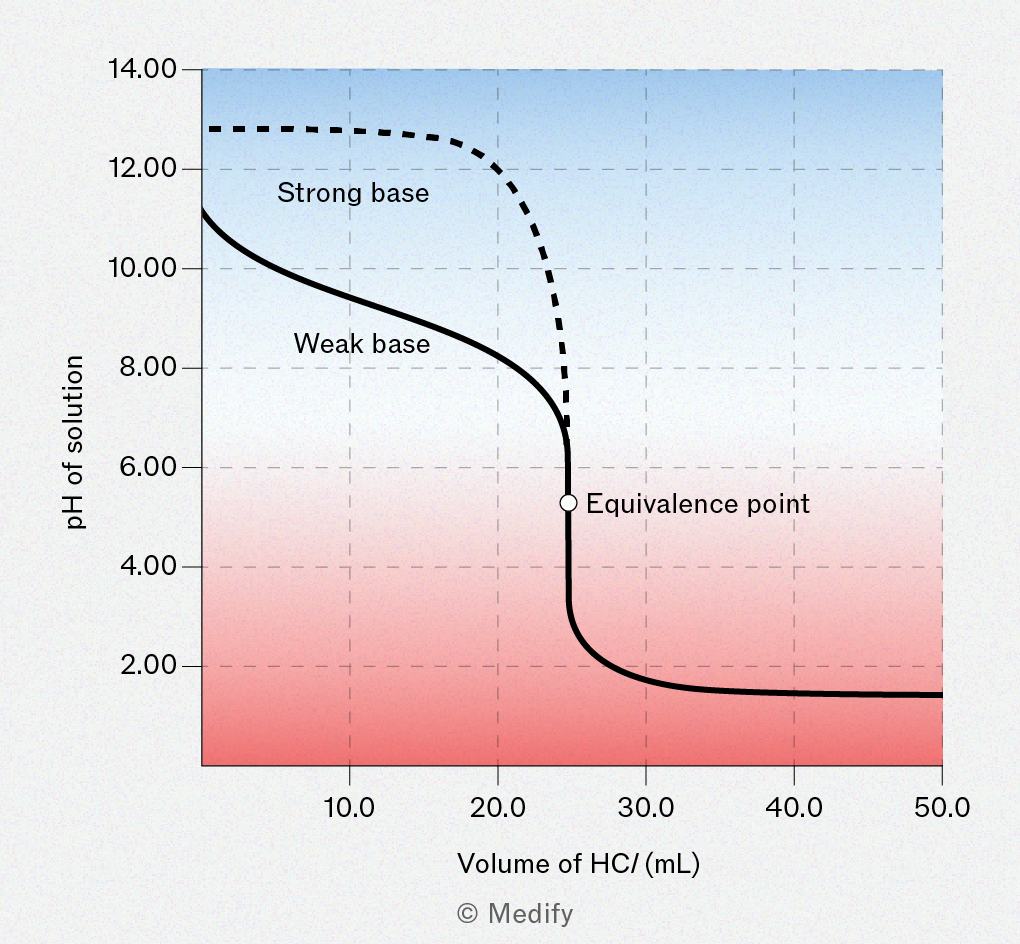
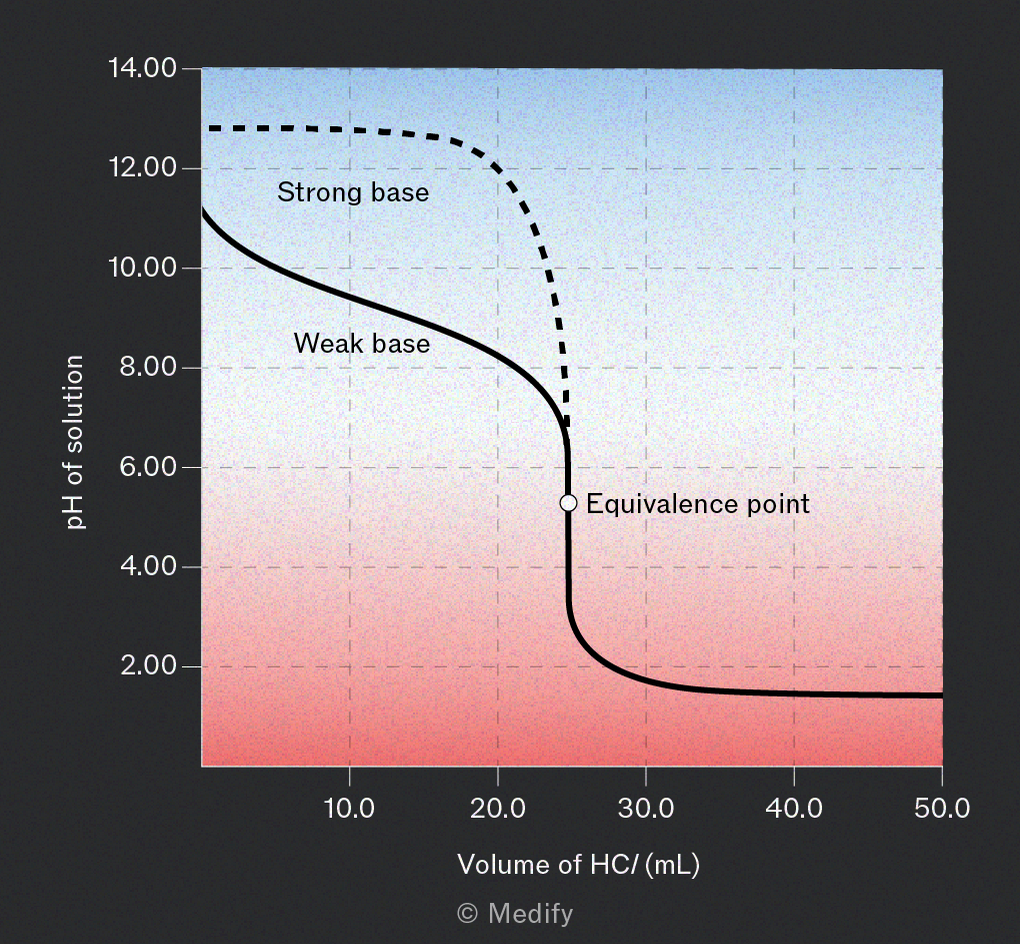
Starts at a lower than a strong base, initially falls gradually then remains steady for a period of acid addition. This is the buffer region; the solution contains a mixture of the weak base and its conjugate acid.
There is then a sharp fall near the point of neutralisation. There are a range of values which can represent neutralisation centering at an equivalence point of below .
The levels off at a low value quickly following neutralisation.
Weak acid with strong base
Example: Ethanoic acid () titrated with ().
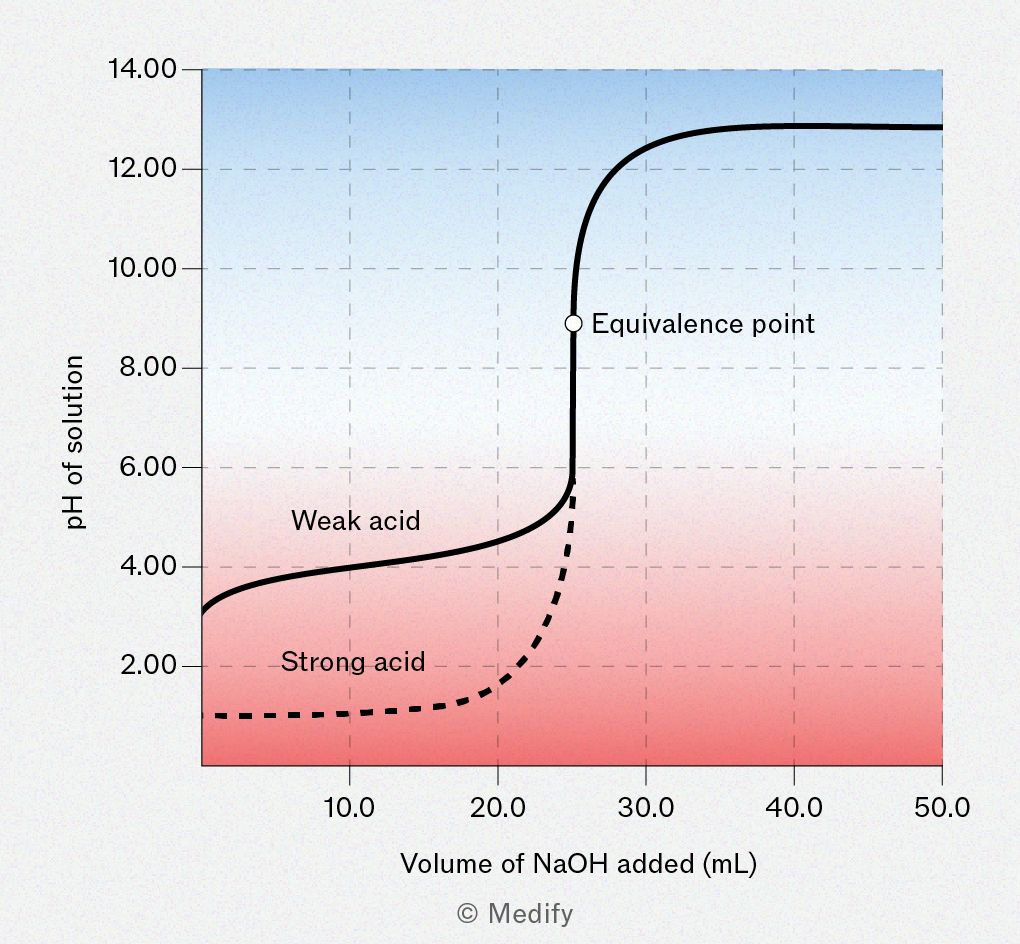
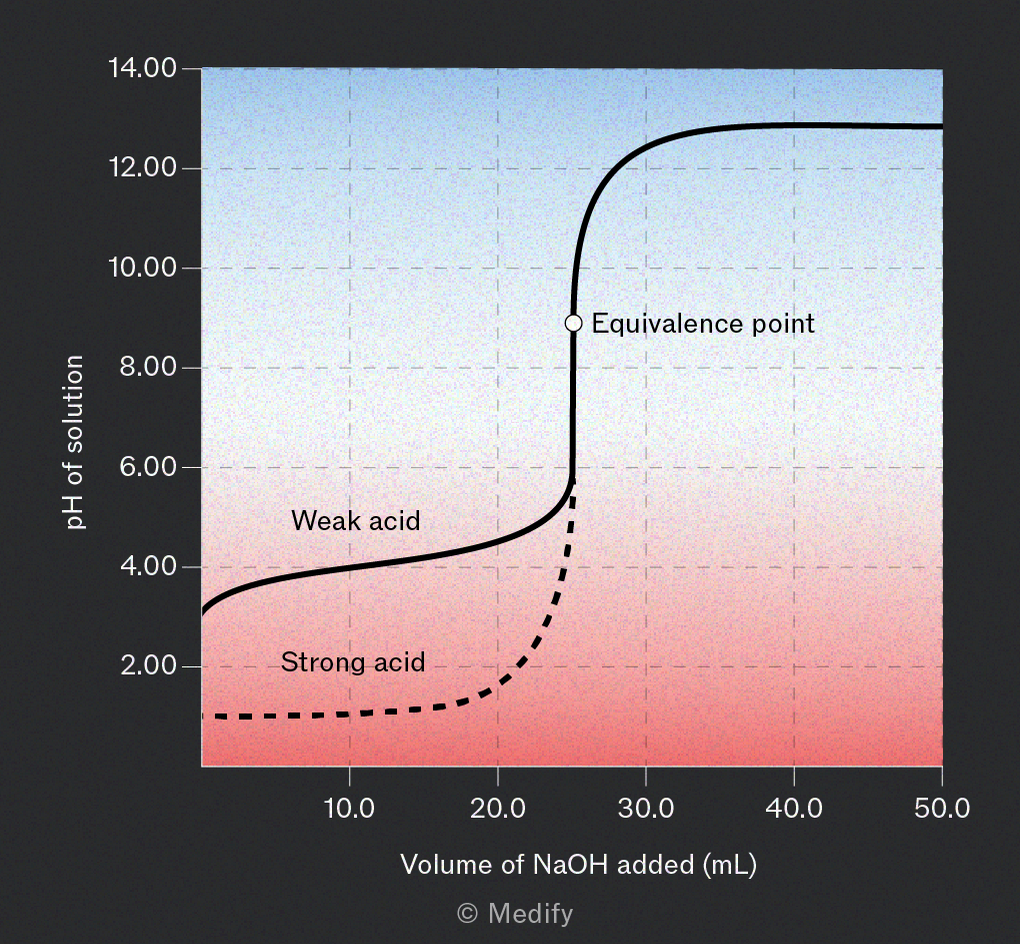
Starts at a higher than a strong acid. rises gradually initially then remains steady for a period of base addition. This is the buffer region; the solution contains a mixture of the weak acid and its conjugate base.
There is a steep increase in as the neutralisation point approaches. There are a range of values which can represent neutralisation centering at an equivalence point above .
Following neutralisation, the quickly levels off at a high .
Weak base with weak acid
Example: Ammonia () titrated with ethanoic acid ().
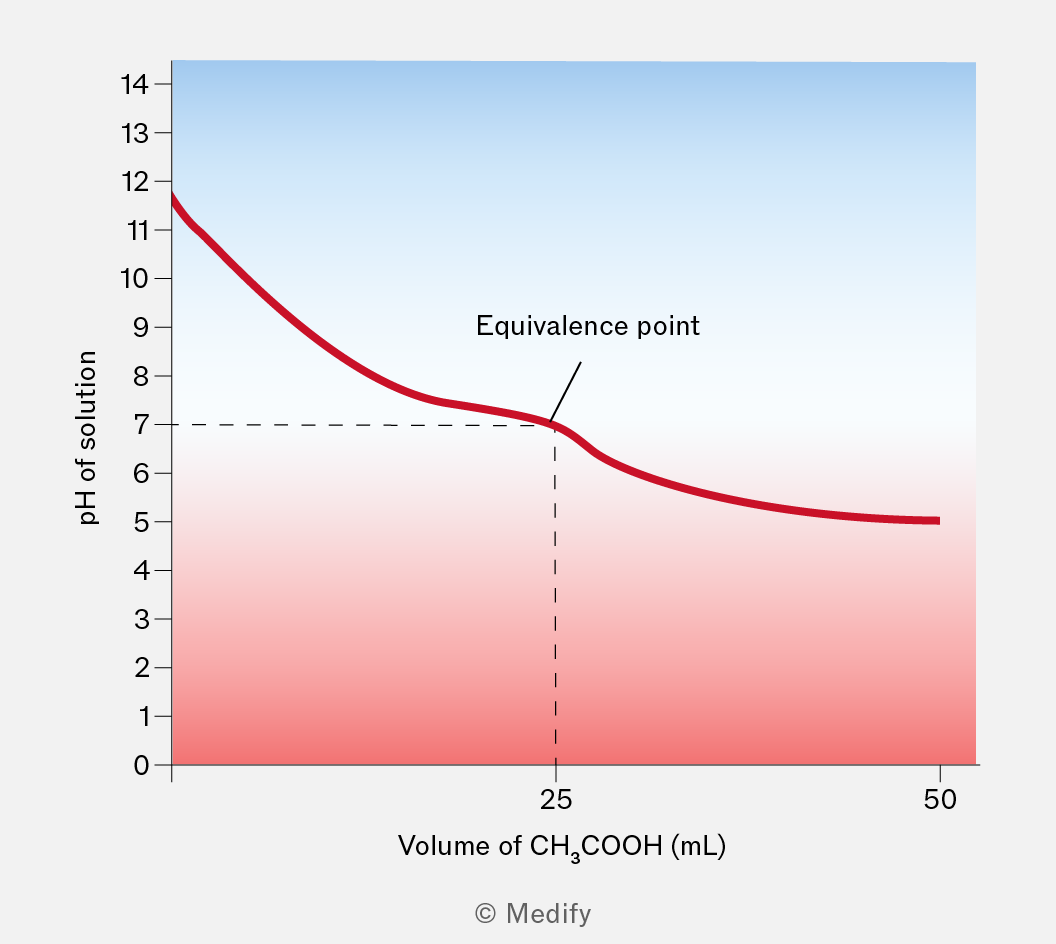
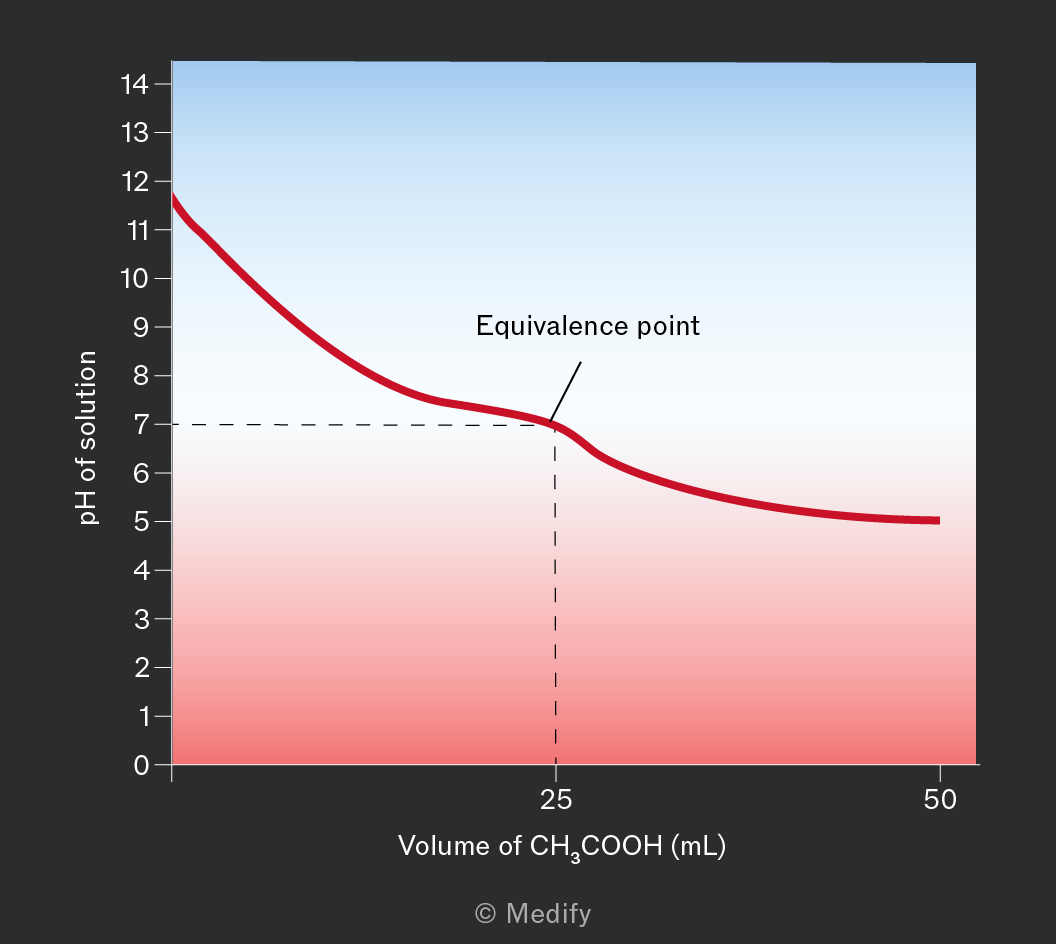
Starts at a lower than a strong base and steadily reduced as the solution approaches neutralisation.
There is only a short range of values, centred around , which can be used to indicate neutralisation.
Following neutralisation the continues to fall gradually.
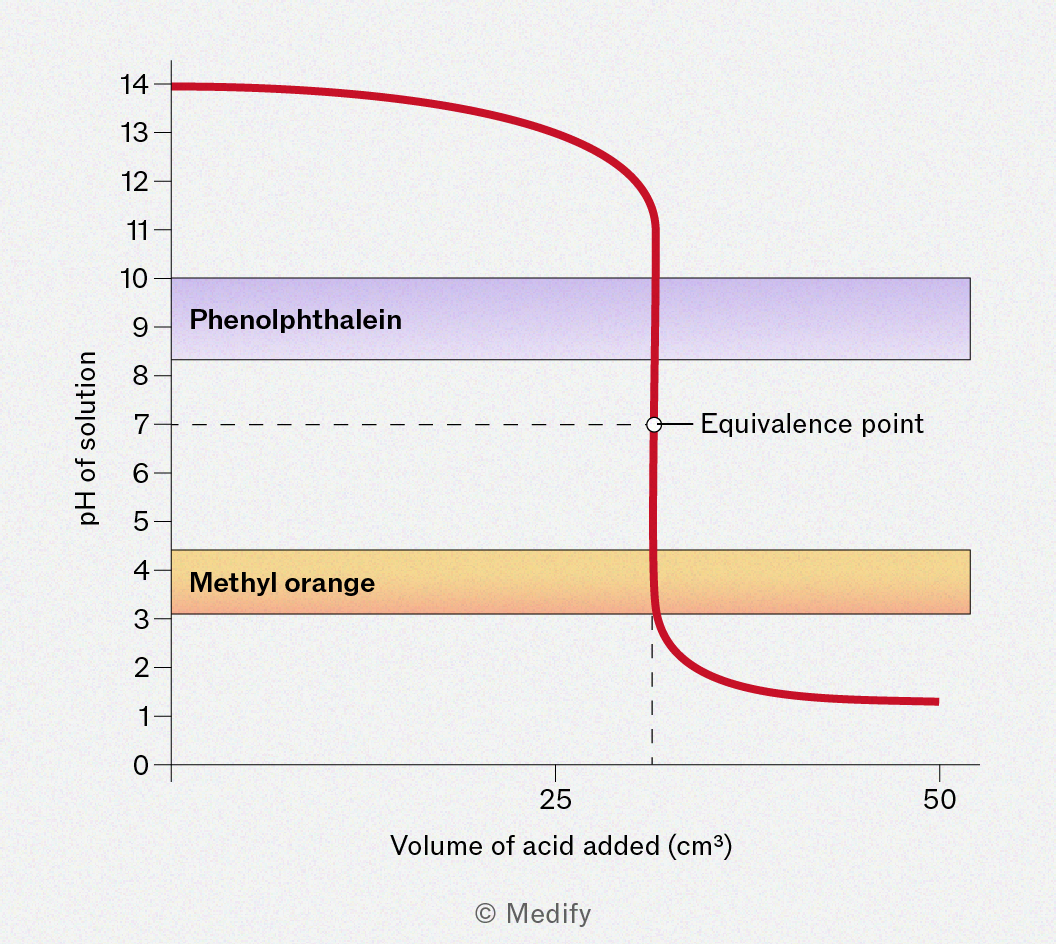
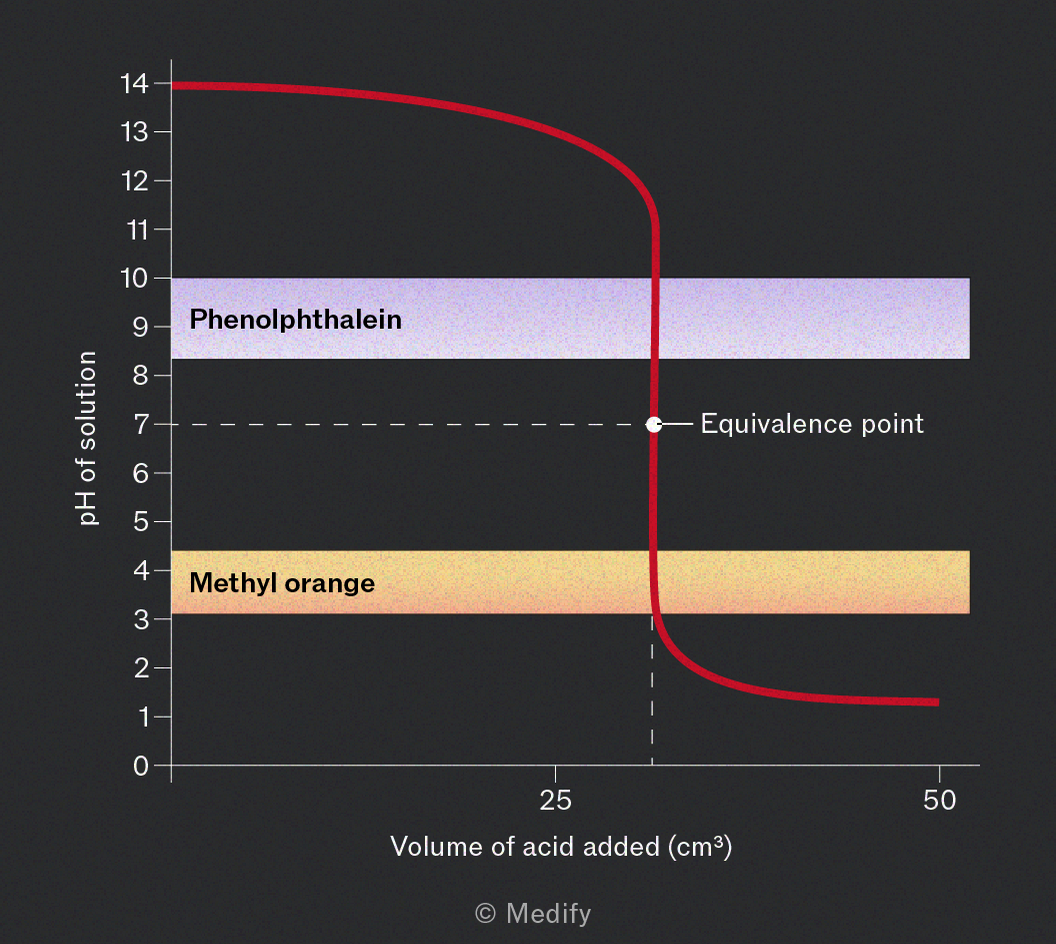
At the point of neutralisation there is a steep change in . The midpoint of this range is the equivalence point.
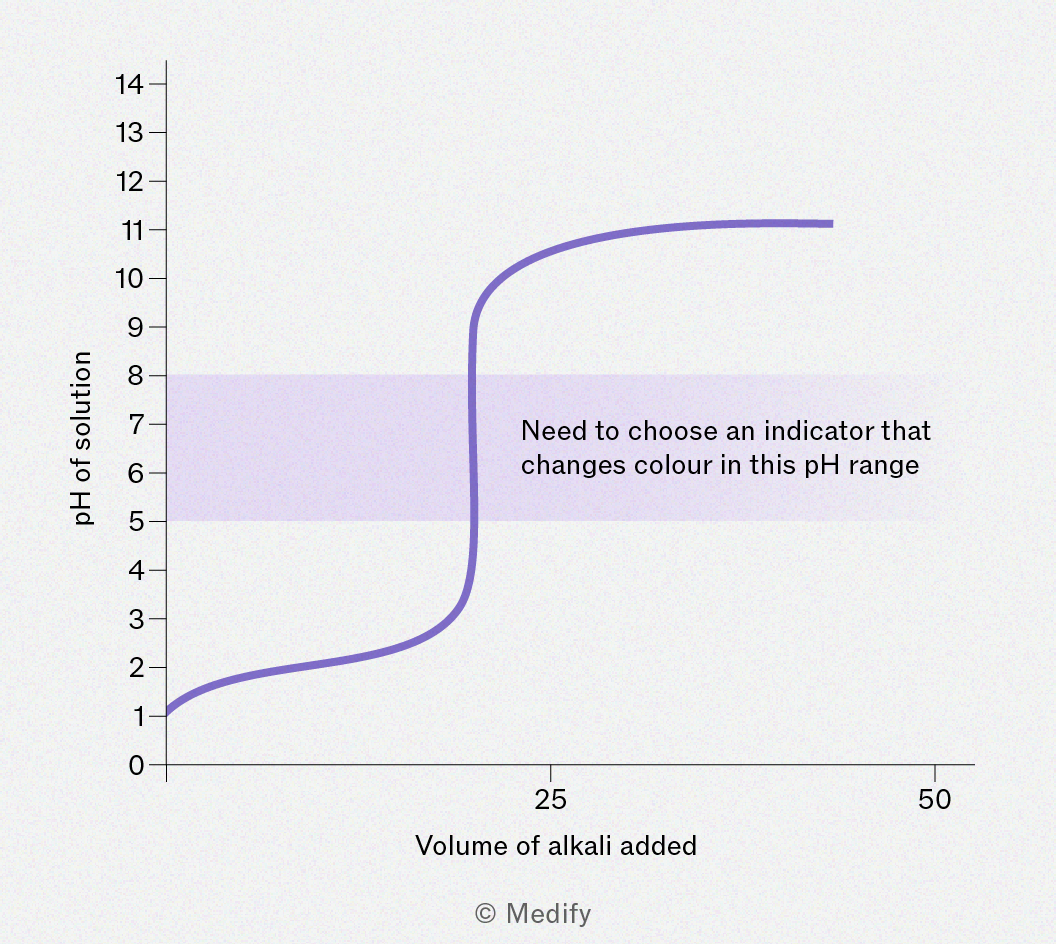
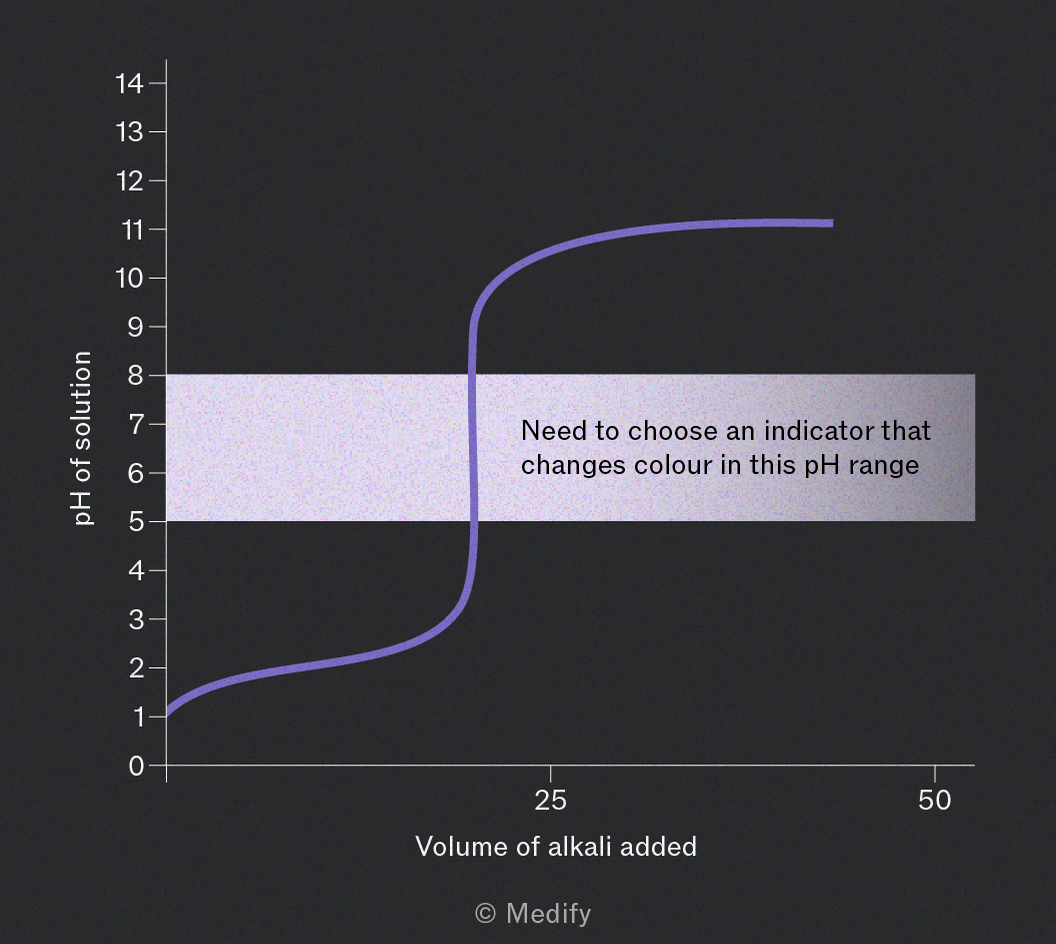
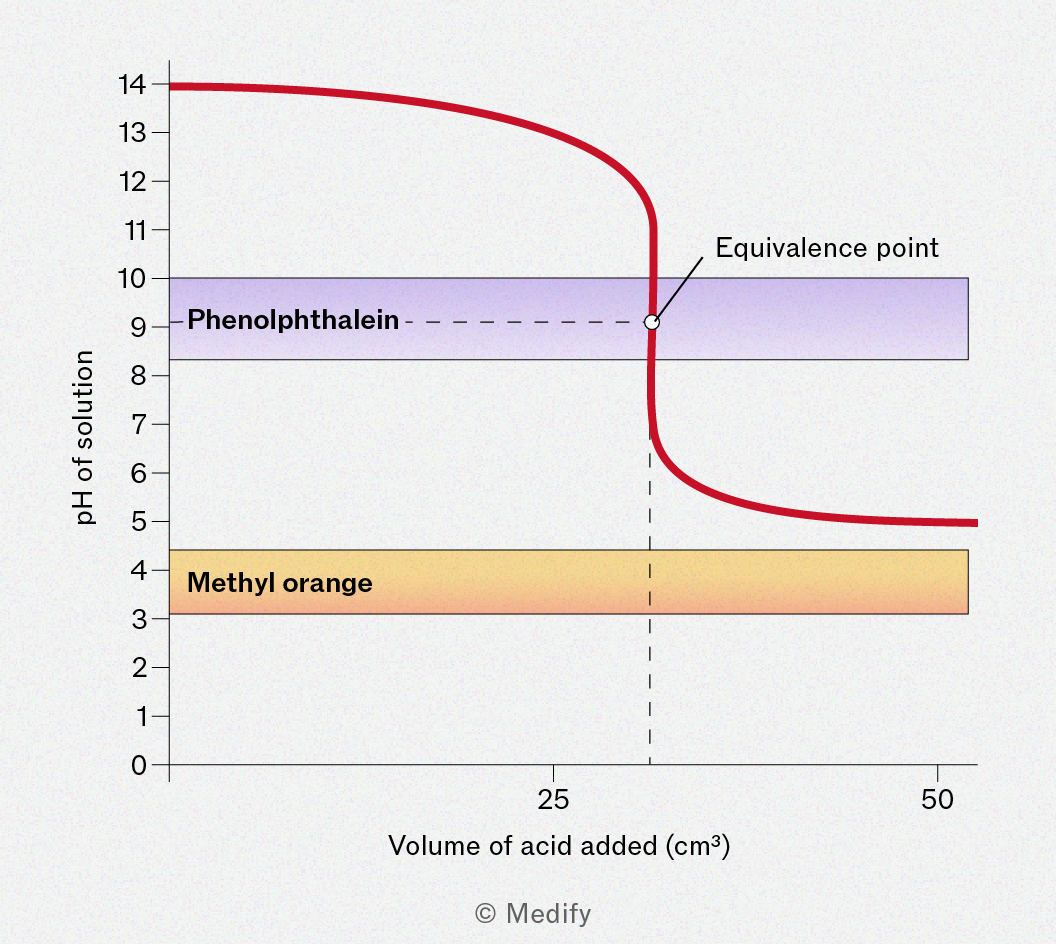
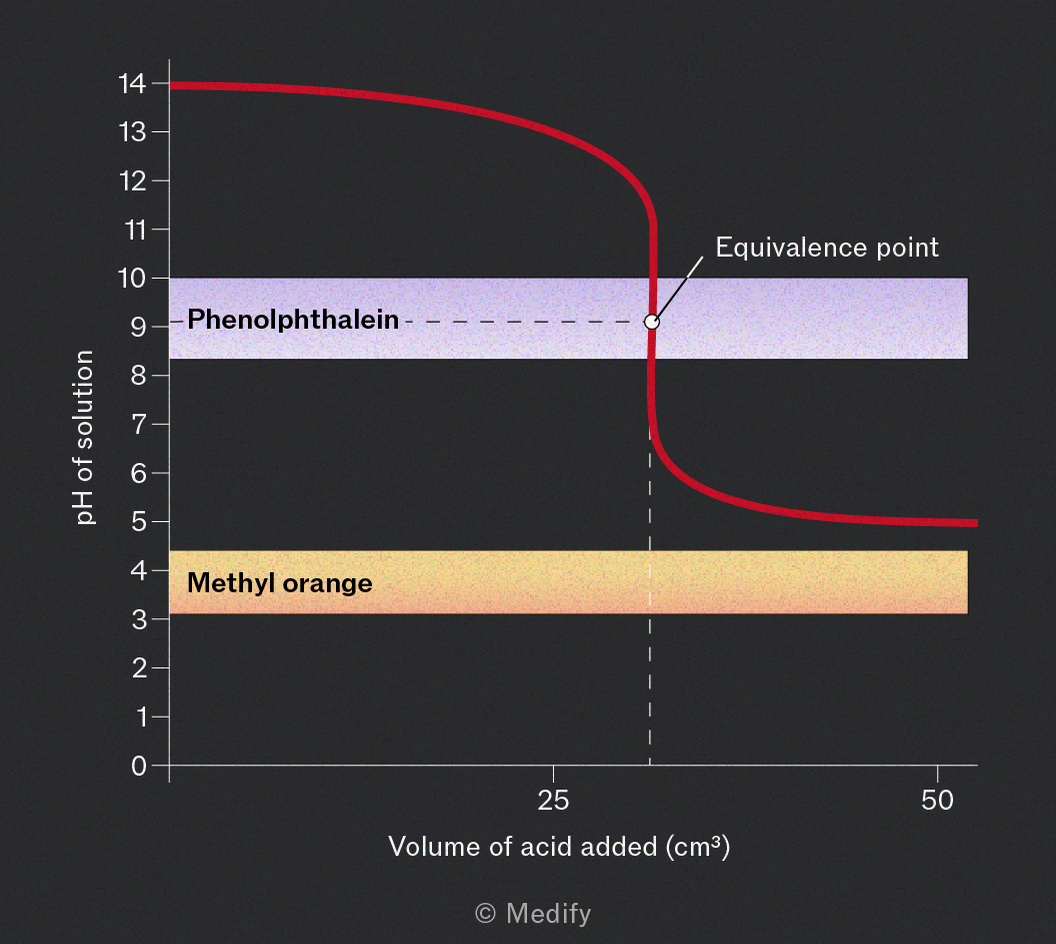
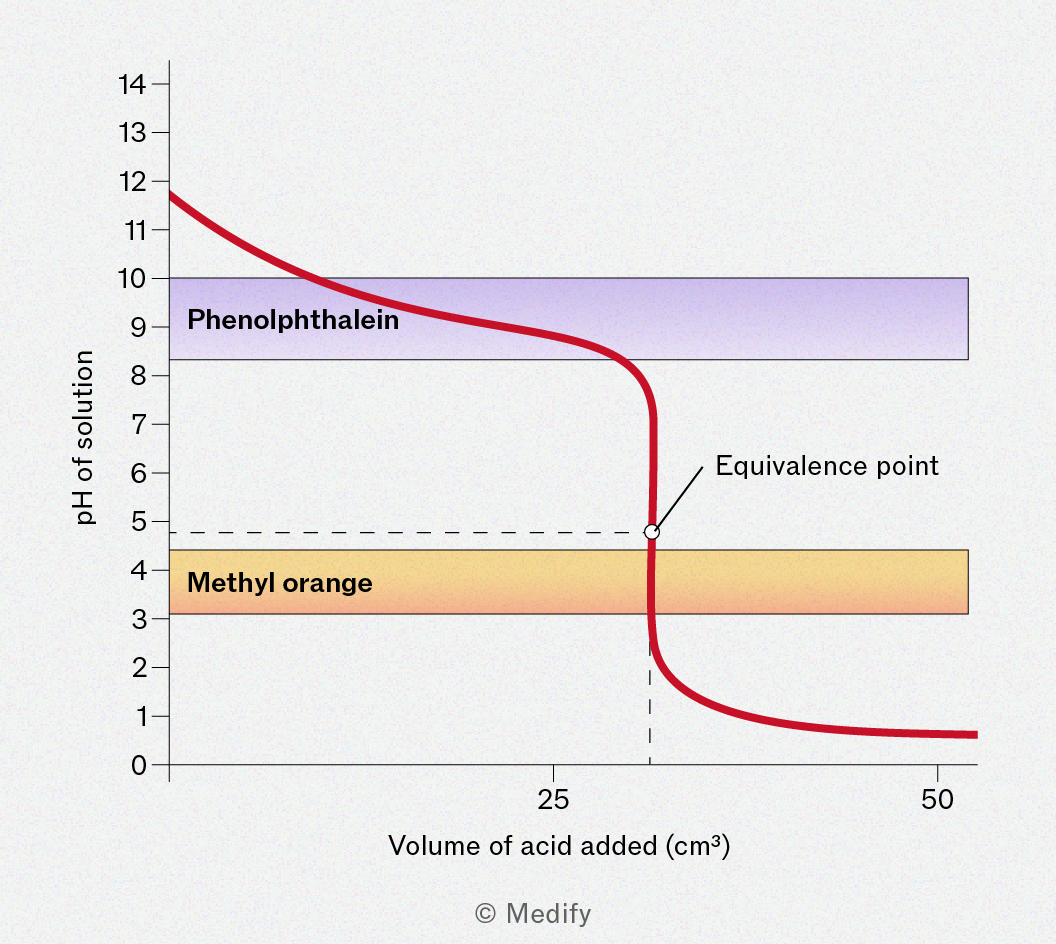
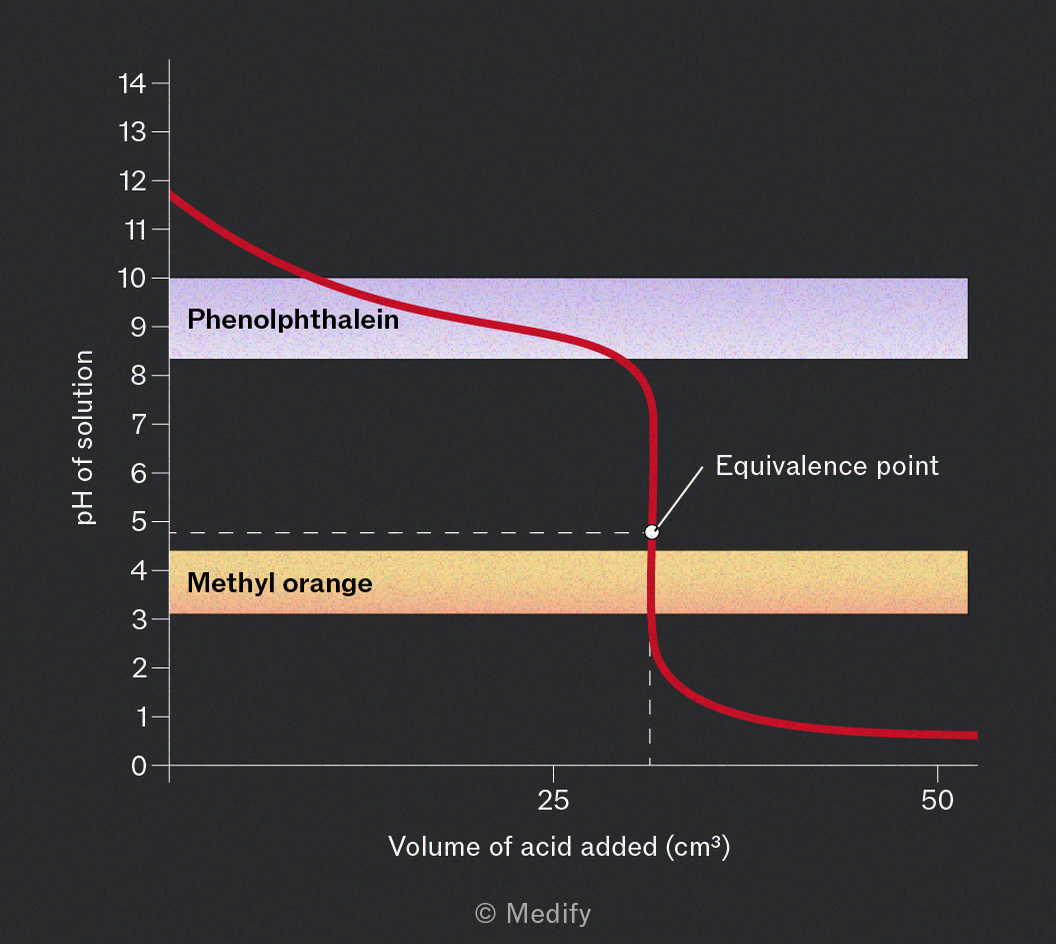
In order for an indicator to be effective at identifying the endpoint of a neutralisation reaction it must exhibit a colour change within the range of the steep change of .
The best indicators will exhibit a change at, or very close to, the equivalence point .
Suitable indicator for a strong acid/strong base titration
The range around the equivalence point is typically wide, from around .
Use indicators with a colour change at a within this range, such as phenolphthalein or methyl orange ().
Suitable indicator for a weak acid/strong base titration
The range around the equivalence point is typically narrower and at a higher equivalence point than a strong acid/strong base titration. It is around .
Use indicators with a colour change at a range above 7, such as phenolphthalein ().
Suitable indicator for a strong acid/weak base titration
The range around the equivalence point is typically narrower and at a lower equivalence point than a strong acid/strong base titration. It is around .
Use indicators with a colour change at a range below 7, such as methyl orange ().
There is no suitable indicator for titrations of weak acids with weak bases, as there is no sharp equivalence point. As a result, these pairings are not used in quantitative analysis.
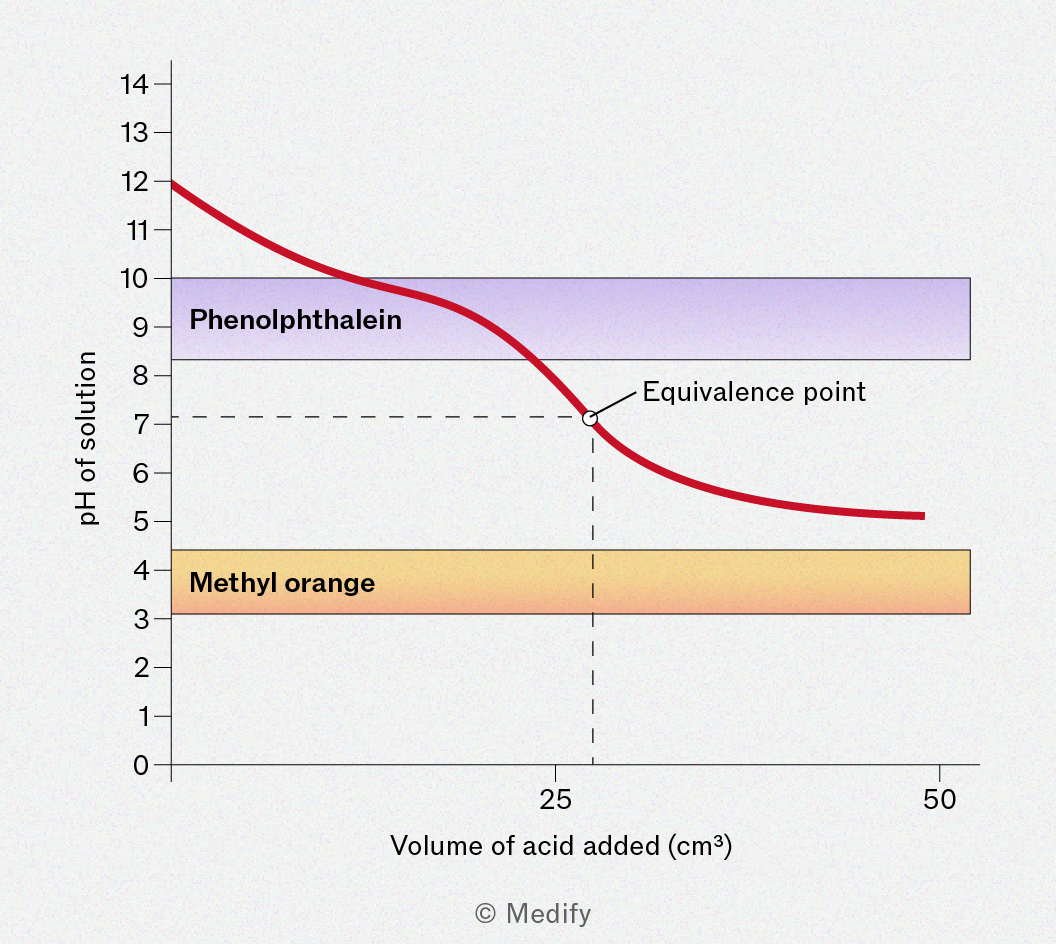
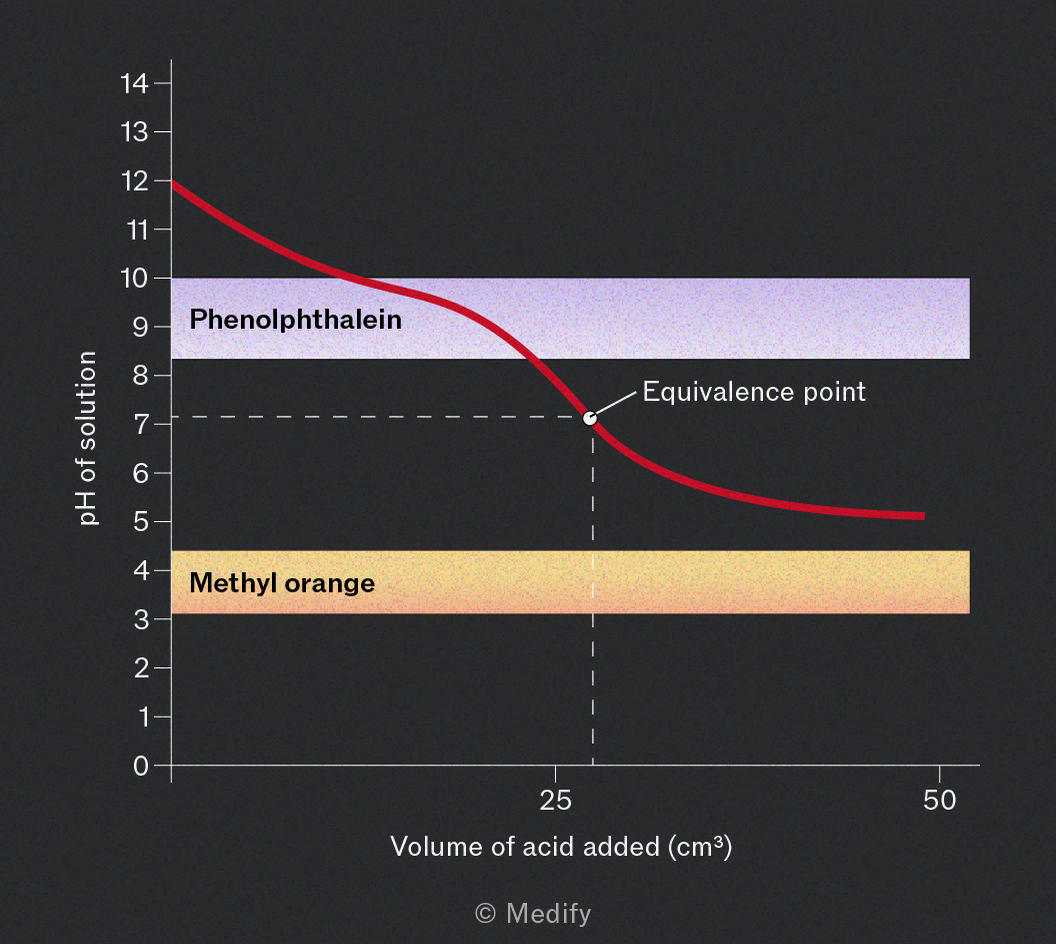
Indicators are weak acids () that change colour depending on the .
The range of over which the colour change is observed depends on the of the indicator.
Phenolphthalein is a commonly used indicator. It is colourless in acidic form () and pink in basic form ().
Acidic solution:
- High , equilibrium shifts left.
- predominates, the solution is colourless.
Basic solution:
- Low , equilibrium shifts right.
- predominates, the solution is pink.
meter and probe
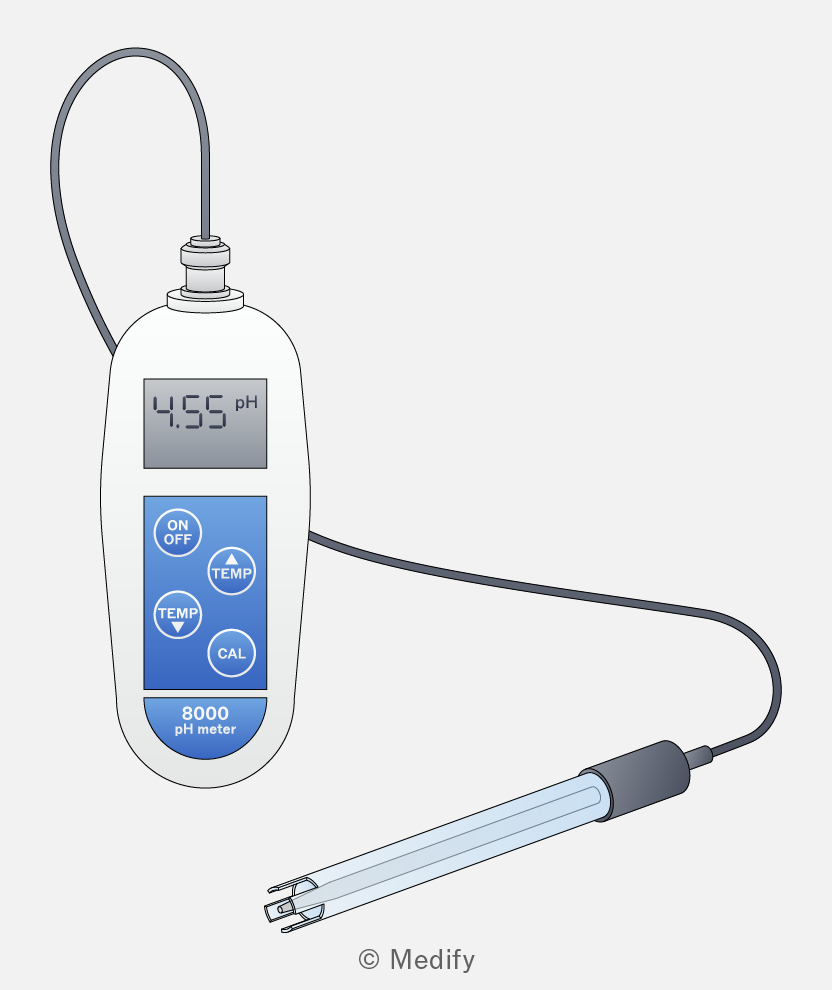
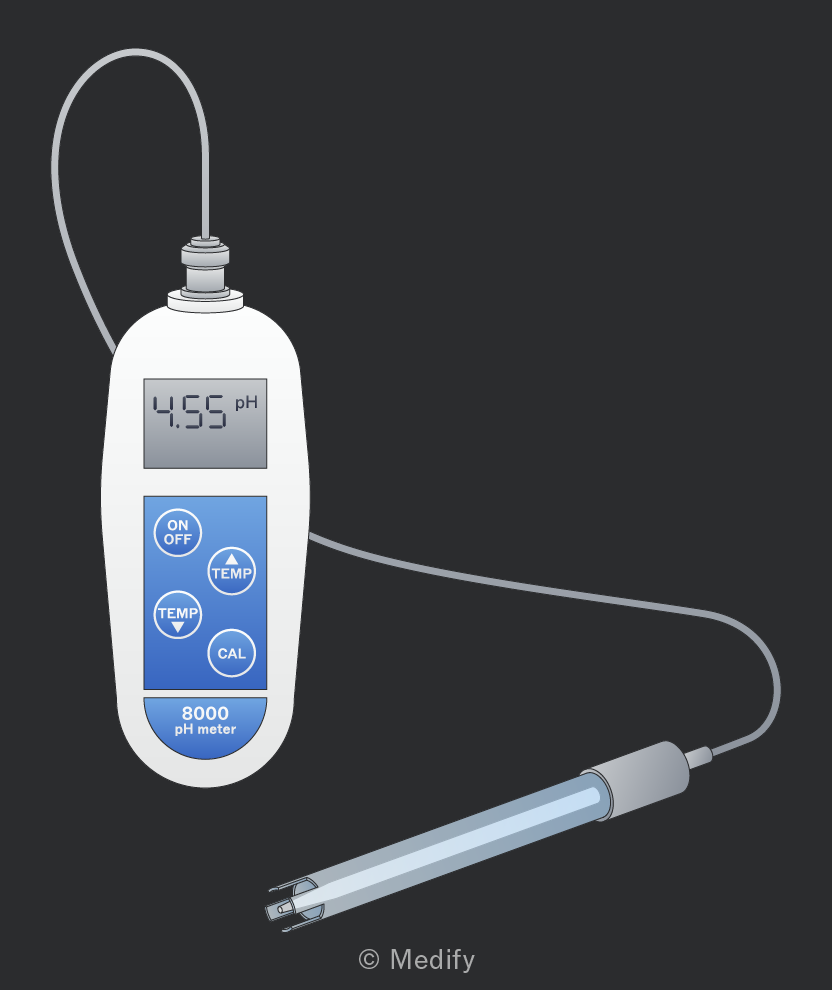
meters are used where a precise numerical value of is required. The meter must be calibrated by dipping the probe into a set of buffer solutions of known values.
When using a probe, stir the sample before measuring it and take care not to knock the fragile glass tip on the wall of the container.
A meter is an essential tool in chemistry labs for quantitatively measuring the acidity or alkalinity of a solution.
Accurate measurements are crucial in various fields, including biochemistry, environmental science, and medicine.
meters should be calibrated before use
Calibration of the meter:
- Turn on the meter: Allow it to warm up if required.
- Rinse the electrode: Use distilled water to rinse the electrode to remove any contaminants, and gently blot it dry with a lint-free paper.
- Calibrate at neutral : Place the electrode in a buffer solution. Stir gently and allow the reading to stabilise. Adjust the meter to read if necessary.
- Second calibration point: Rinse the electrode, then immerse it in either a or buffer solution, depending on the expected range of the sample . Adjust the meter to the corresponding value.
A third calibration point can be added if the range of required measures is wider.
Once a probe is calibrated it can be used to measure samples.
- Rinse the electrode: Rinse the electrode with distilled water and blot dry.
- Immerse in the sample: Place the electrode in the sample solution. Ensure the electrode is fully immersed and that the sample is well-stirred.
- Wait for stabilisation: Allow the reading to stabilise. This may take a few seconds to a minute.
- Record the : Once the reading is stable, note the value.
Post-measurement procedures:
- Rinse the electrode: After measuring the sample, rinse the electrode with distilled water.
- Store the electrode: If you are finished, store the electrode according to the manufacturer’s instructions, often in a storage solution to keep it hydrated and prevent contamination.
To reduce error in readings made with a meter:
- Regular calibration: Calibrate the meter before each set of measurements, to ensure accuracy.
- Proper rinsing: Always rinse the electrode between different solutions to avoid contamination and inaccurate readings.
- Electrode care: Handle the electrode gently. Avoid scratching the glass bulb and follow the manufacturer’s instructions for storage and maintenance.
- Temperature consideration: measurements can be temperature dependent. Ensure the calibration and sample measurements are at the same temperature.
indicator colour chart
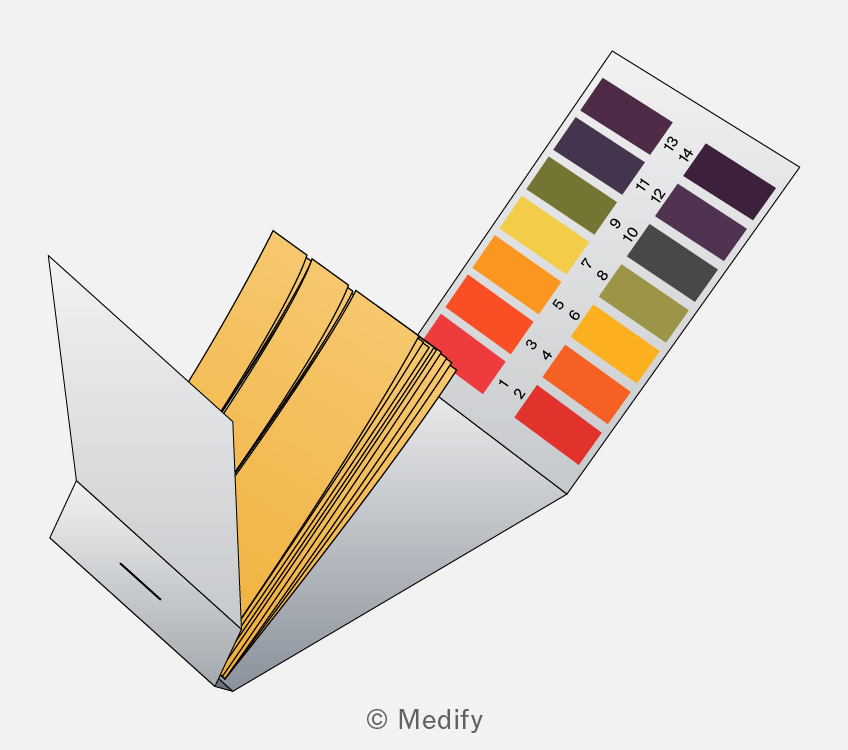
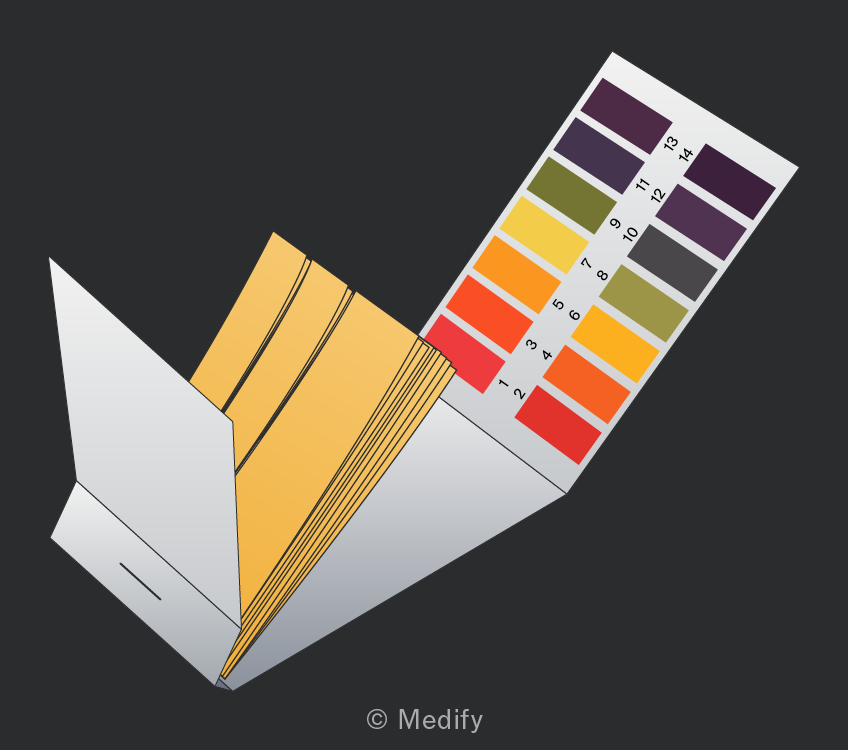
can be measured approximately using an indicator and a colour chart.
A universal indicator can be added to a sample, or indicator paper can be dipped into the solution. The is determined by comparing the colour to a colour chart.
The precision of an indicator-based measurement is very low and should only be used for qualitative measurements.