
Algebra (M2)
On this page
You need to be able to express relationships between different quantities using mathematical symbols.
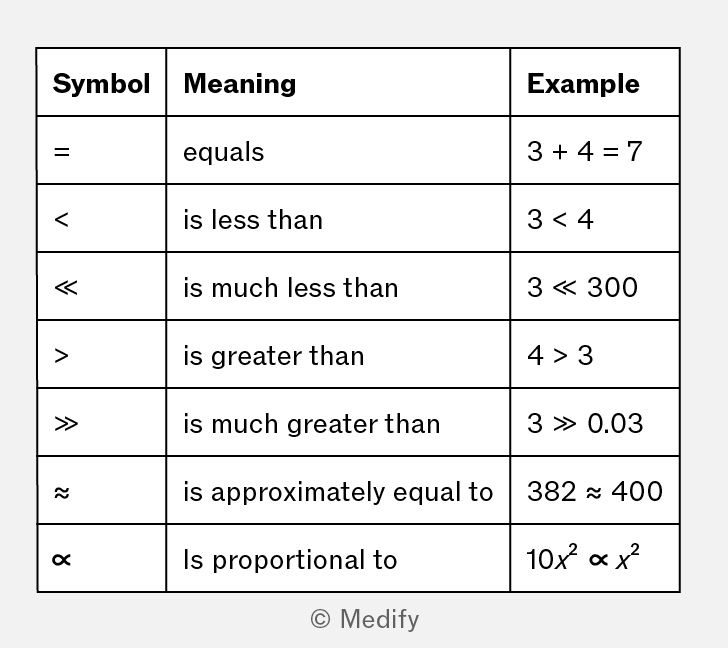
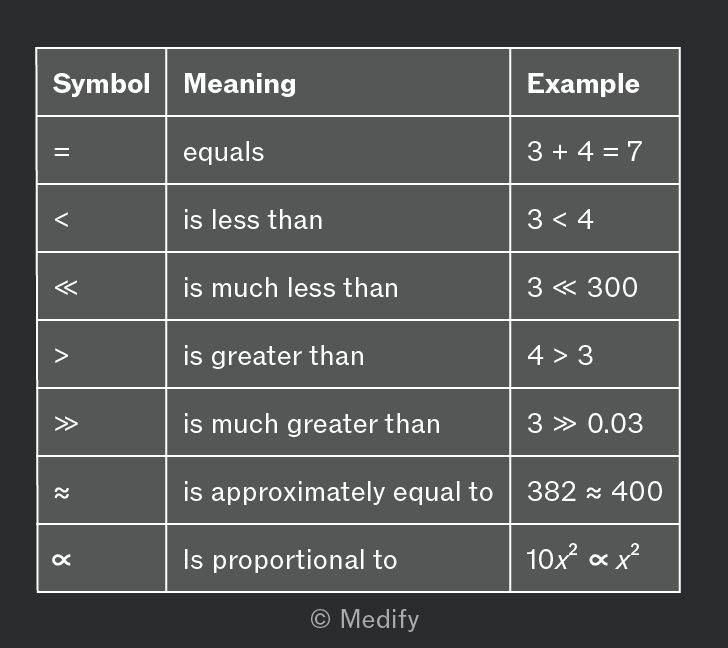
It is important to note that you need to know and be able to use these symbols correctly:
Question walkthrough
Understand and use the symbols
Determine the correct symbol for each of the gaps in the mathematical sentences below.
The symbol means ‘is proportional to’.
When the quantity A is directly proportional to the quantity B, you can write it as
When the quantity A is inversely proportional to the quantity B, you can write it as
You can also introduce the constant of proportionality, and change the proportionality symbol to an equals sign:
- Direct proportionality:
- Inverse proportionality:
Question walkthrough
Recognising graphs showing direct proportionality and inverse proportionality
Translating graphical data to mathematical statements with correct symbol usage.
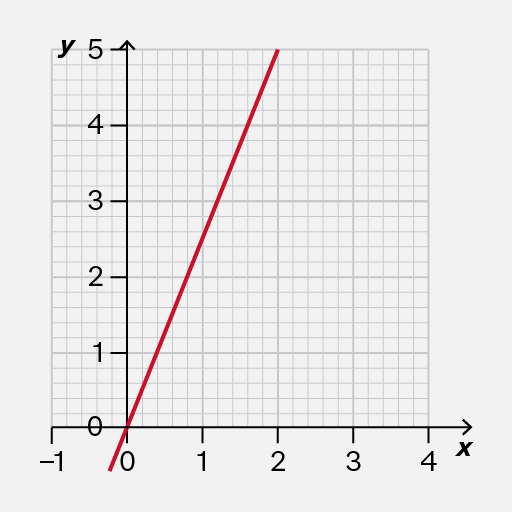
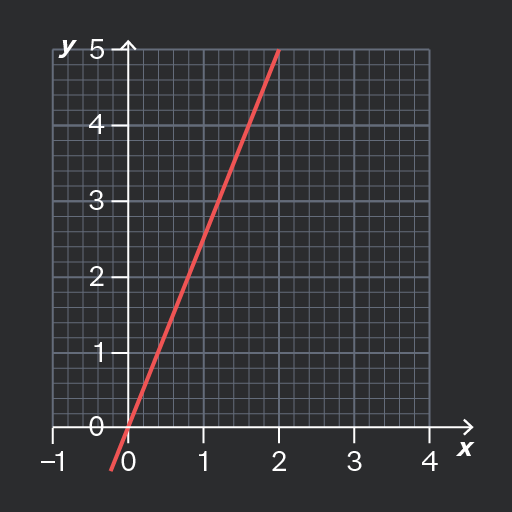
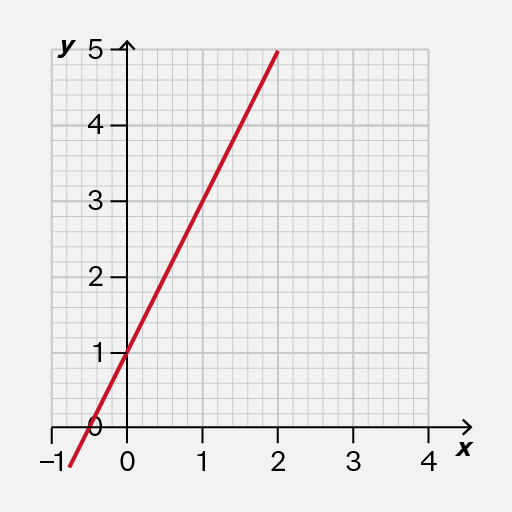
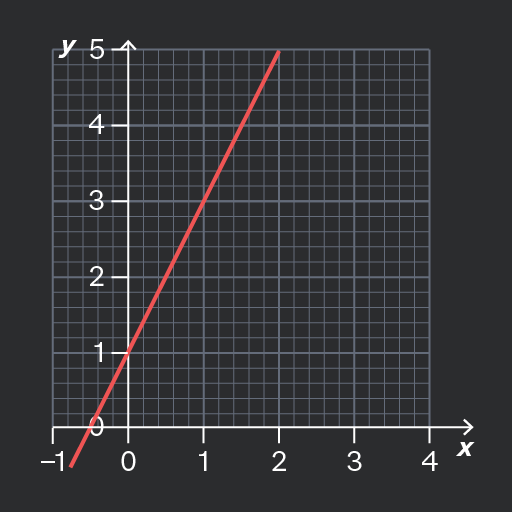
Two quantities are only directly proportional when a linear graph of the two quantities is plotted, and the graph goes through the origin.
Scientists often need to discuss changes in a quantity. So they use to mean “change in”.
For example, the following are all typical notations to mean “change in velocity”:
- velocity,
- final velocity – initial velocity,
- and
- .
Equations describe rules and relationships between quantities.
Consider the following linear equation:
It is straightforward to determine the value of if the other two terms are known, but what if we need to determine the value of or
Then, we must rearrange the equation to make either or the subject. Making something the subject of an equation means rearranging so that the desired term is isolated on one side in terms of the other variables.
It is important to note that you should generally rearrange an equation before inserting or substituting values into your terms to avoid any unnecessary confusion.
Question walkthrough
Rearranging Linear Equations I
Rearranges x=yz to make z the subject by dividing both sides by y, cancelling the y term to isolate z.
The order in which you rearrange terms is important to maximise your efficiency and reduce the time taken to isolate your desired quantity.
Consider the following linear equation:
Multiple valid methods exist to make the subject of the above equation. However, starting with operations that directly simplify the equation, such as addition or subtraction, is generally good practice. Afterwards, apply multiplication or division to fully isolate the term.
Question walkthrough
Rearranging Linear Equations II
Rearranges a=b/c+d to make c the subject by isolating b/c, multiplying through by c, then dividing by (a−d).
A non-linear equation contains terms raised to a power greater than or less than one. They can involve functions such as (but not limited to):
- Exponents e.g. or
- Logarithms e.g. or
- Trigonometric functions e.g. or
Non-linear equations involve complex relationships where the change in one variable is not directly proportional to the change in the other.
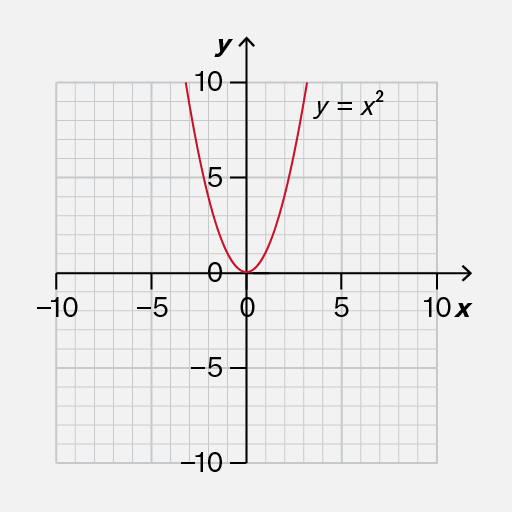
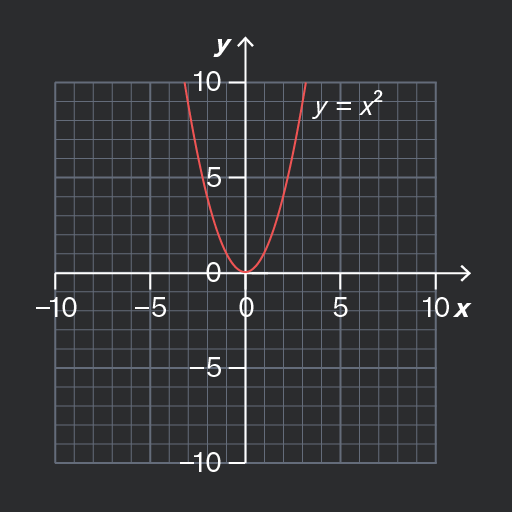
An example of a nonlinear equation is given as follows:
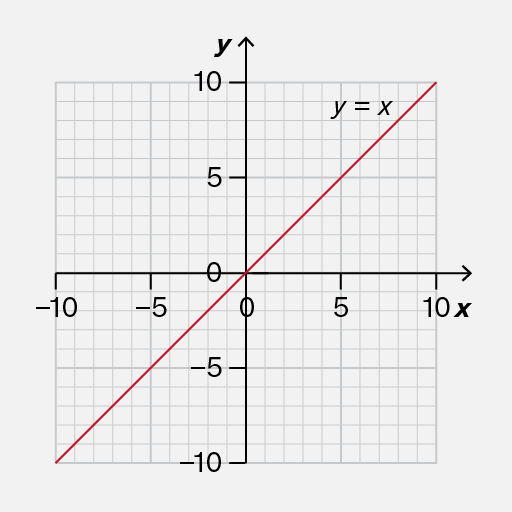
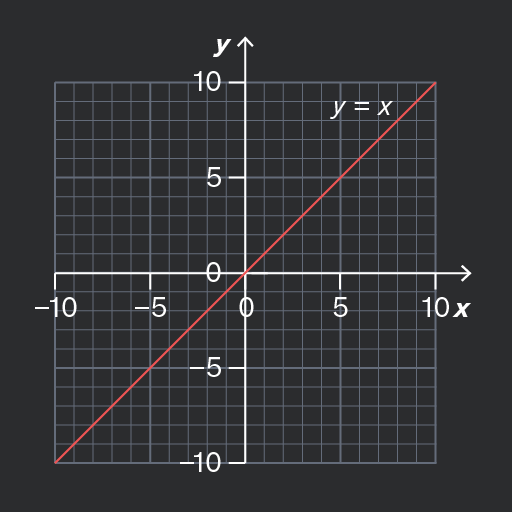
It is useful to know that a simple linear equation could be represented as follows:
When discussing linear terms and equations, we typically do not include the exponent of 1 because it’s understood that any quantity raised to the power of 1 is simply itself. Writing it out explicitly is redundant and doesn’t affect the meaning or the calculation.
Linear equations typically represent a relationship where one variable changes at a constant rate with respect to another.
Non-linear equations produce curves rather than straight lines when graphed.
Question walkthrough
Rearranging Non-Linear equations (exponents)
Isolates x² by subtracting the constant term (2k+1), then takes the square root of both sides to rearrange y=x²+2k+1 to make x the subject.
Question walkthrough
Easy exemplification to rearrange non-linear equations
Rearranges E=mc² to find the tiny mass converted into energy during nuclear fission, using the speed of light from the data booklet and the total energy released by a reactor over an eight-hour period.
Question walkthrough
Hard exemplification to rearrange non-linear equations
Uses the fission rate, energy released per fission, and E=mc² to calculate the total mass converted into energy by a nuclear reactor over an eight-hour period of steady operation.
When you substitute numerical values into an algebraic equation, you must use the correct order of operations.
Consider the equation:
When you substitute in a negative value, you must remember that the negative sign is part of the number that will be squared. For example, when
Use brackets around each negative number to make the calculation clearer.
It is useful to know that if two quantities have the same sign (both positive or both negative), then if you multiply or divide them, the result will be positive. If they have different signs, the result will be negative.
Question walkthrough
Substituting numerical values into algebraic equations
Substitutes negative values for x and y into z=2x²−y/x, using brackets around negative numbers to keep the calculation clear, then evaluates each term in turn.
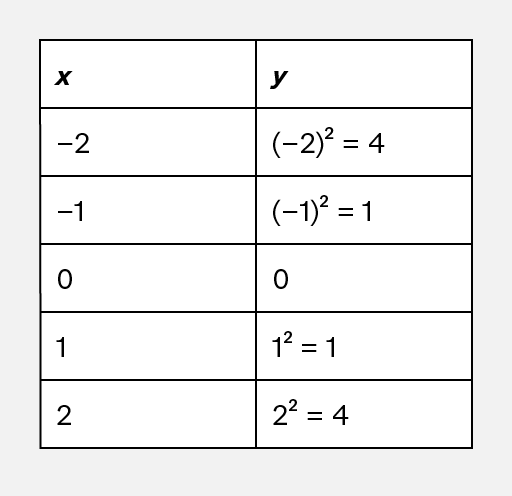
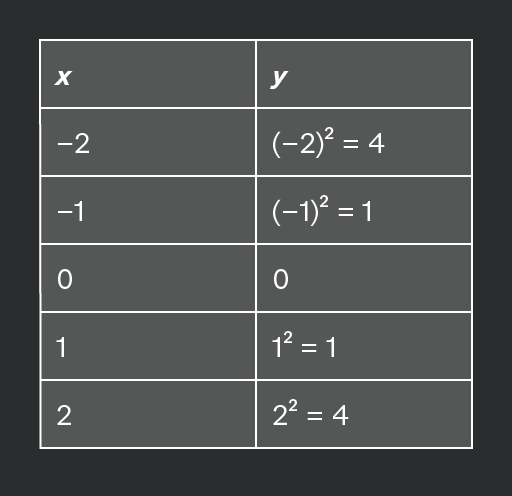
When plotting a graph of calculate the Y coordinates for negative X coordinates by squaring the X coordinates.
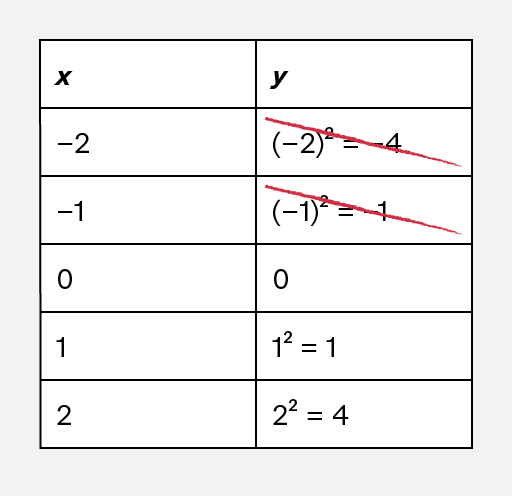
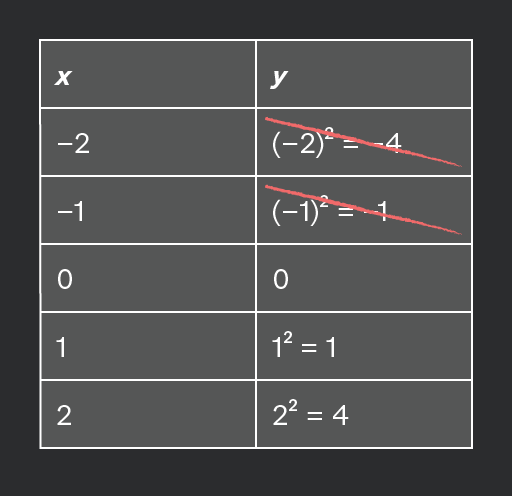
When carrying out a calculation, it is important that you follow the correct order of operations, BIDMAS:
- B rackets
- I ndices (also known as powers or exponents)
- D ivision and M ultiplication
- A ddition and S ubtraction
Consider this calculation:
For the first term of the equation, first do the subtraction inside the brackets, then the index, and finally the multiplication.
For the second term of the equation, first do the division, then the index inside the brackets, then the subtraction, and finally the multiplication.
Then add the two terms. The value of is
Question walkthrough
Using BIDMAS
Substitutes given values into a multi-term expression involving brackets, an index, and fractions, then evaluates step by step following BIDMAS.
For most simple equations, you can solve them using the same process that you might use to rearrange the equation to make the unknown variable the subject of the equation.
Consider the following equation, which is only true for one value of :
You can use any valid method to rearrange the equation to make the subject, which solves the equation:
Question walkthrough
Solve an equation by rearranging it.
Rearranges the SUVAT equation v-squared equals u-squared plus 2as to solve for the distance travelled, given the initial and final velocities and the acceleration.
Quadratic equations are often written in the form where x is unknown, and and have known values.
Quadratic equations can have zero, one, or two solutions.This depends on the values of and
You can determine the number of solutions by calculating the discriminant of the quadratic equation:
- Positive discriminant → two solutions.
- Zero discriminant → one solution.
- Negative discriminant → no solutions.
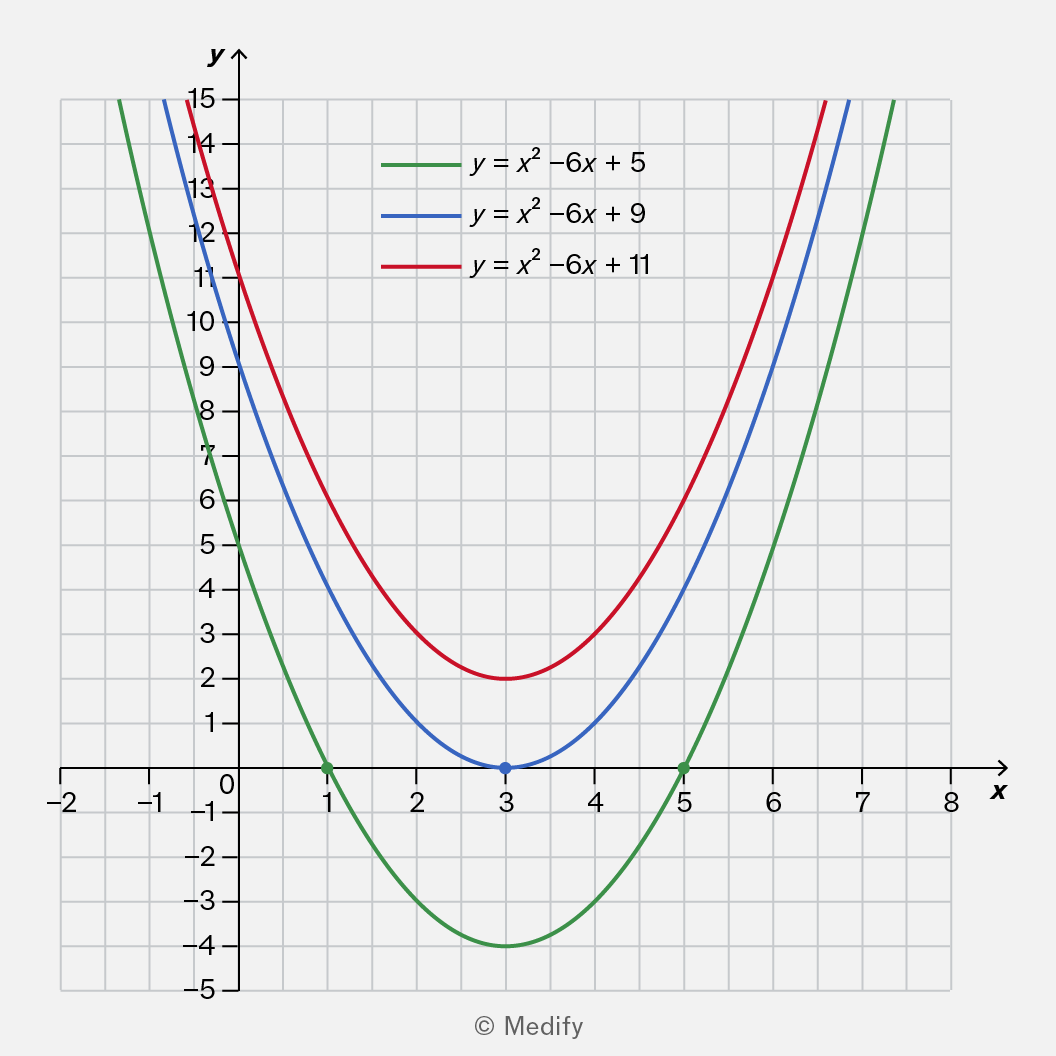
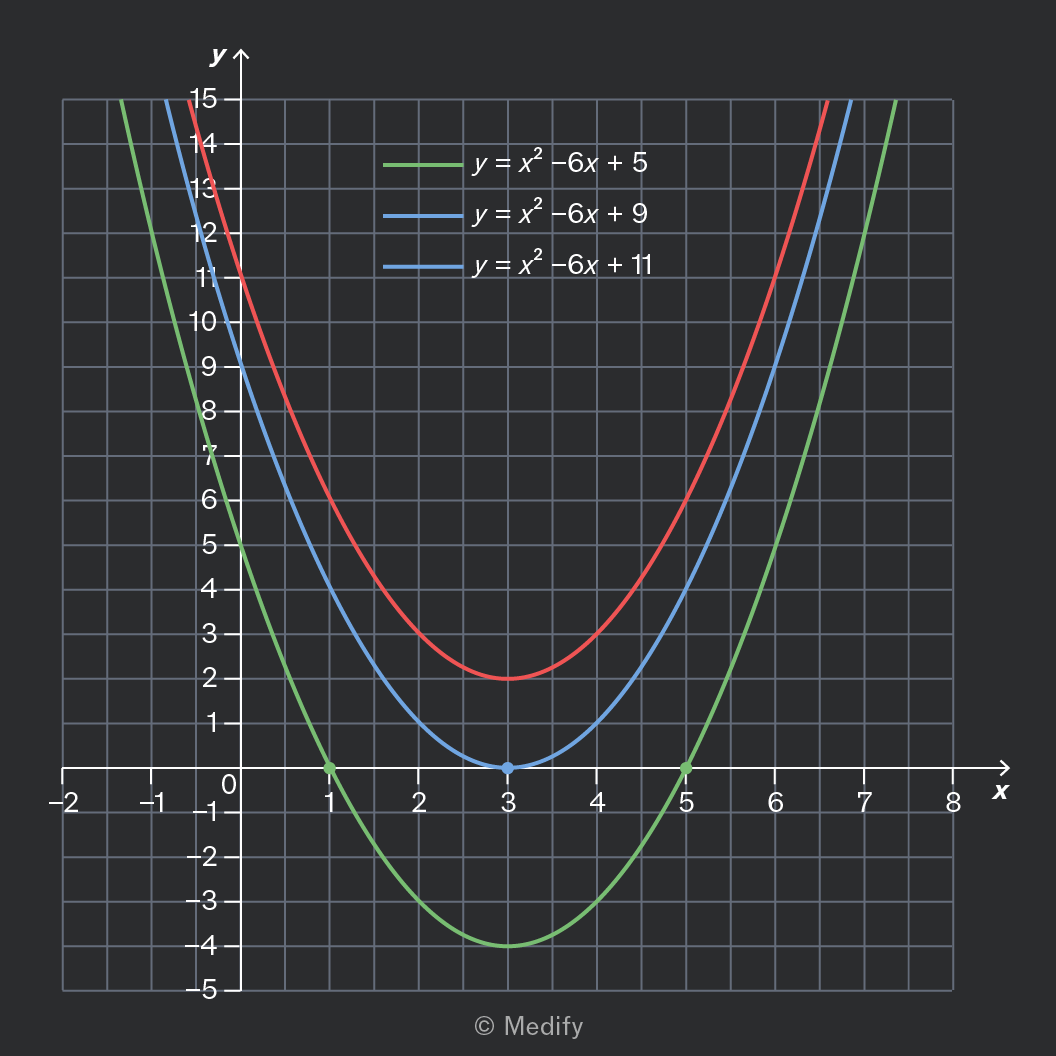
For , the equation has two solutions, where the curve crosses the -axis:
For , the equation has one solution, where the curve touches the -axis:
For , the equation has no solutions. The curve doesn’t cross the -axis:
Quadratic equations can be solved using three main methods. It is advisable to select the simplest and most applicable method that you can use.
Factorising
If you can quickly see a way to factorise the equation into two brackets, this is the easiest method. Otherwise, use a different method. Not all quadratics can be factorised!
For example, is easy to factorize:
One of these brackets must equal zero (otherwise their product could not be zero). So, or
Completing the square
For quadratics of the form where is even, the easiest method is completing the square.
For example, can be rearranged as . You can rearrange this easily to
The quadratic formula
This method looks more difficult, but it works for all quadratics: solve using the formula:
It is important to note that the quadratic formula should be memorised for your exams.
Question walkthrough
Solve a quadratic equation by completing the square
Uses completing the square to solve a quadratic equation with an even middle coefficient, then evaluates the two solutions to two decimal places.
Question walkthrough
Solve a quadratic equation using the quadratic formula.
Uses the quadratic formula to find when a cricket ball hits the ground, given its height as a quadratic function of time, then interprets which of the two solutions is physically valid.
When you solve a quadratic equation, there could be two solutions. Consider both of these and decide which one(s) answer the question.
For example, Maria says her younger brother’s height (in metres), when squared, is equal to his height minus one metre, multiplied by five. How could you determine his height?
Let the height be and form the equation:
Solve the equation using the quadratic formula.
Sometimes, you will encounter a quadratic equation that you need to rearrange before you can solve it.
For example, consider the quadratic equation:
Some quadratic equations have no solutions. The physical interpretation of these is usually that the situation is not possible.
For example, suppose a cricket player hits a ball vertically in a stadium. The height in metres, after seconds is modelled by the equation:
The stadium roof is metres high. Find the time when the ball hits the roof.
The solution involves the square root of a negative number. This means there are no real solutions, and you can conclude that the ball never hit the roof.
The equation means that when 4 copies of 3 are multiplied, as the result is 81.
The same fact can be expressed using a logarithm:
This means that the number of copies of 3 that must be multiplied together to get 81 is 4.
In each equation, 3 is the base. It is the base of the exponent and the base of the logarithm.
It is important to note that in your exam questions, the base will usually be 10 or base only.
Logarithms to base 10 tell you the power that 10 must be raised to to give a particular number.
For example, what is ?
Starting from 1:
multiply by 10 once → 10
multiply by 10 twice → 100
multiply by 10 three times → 1000
Therefore, =3
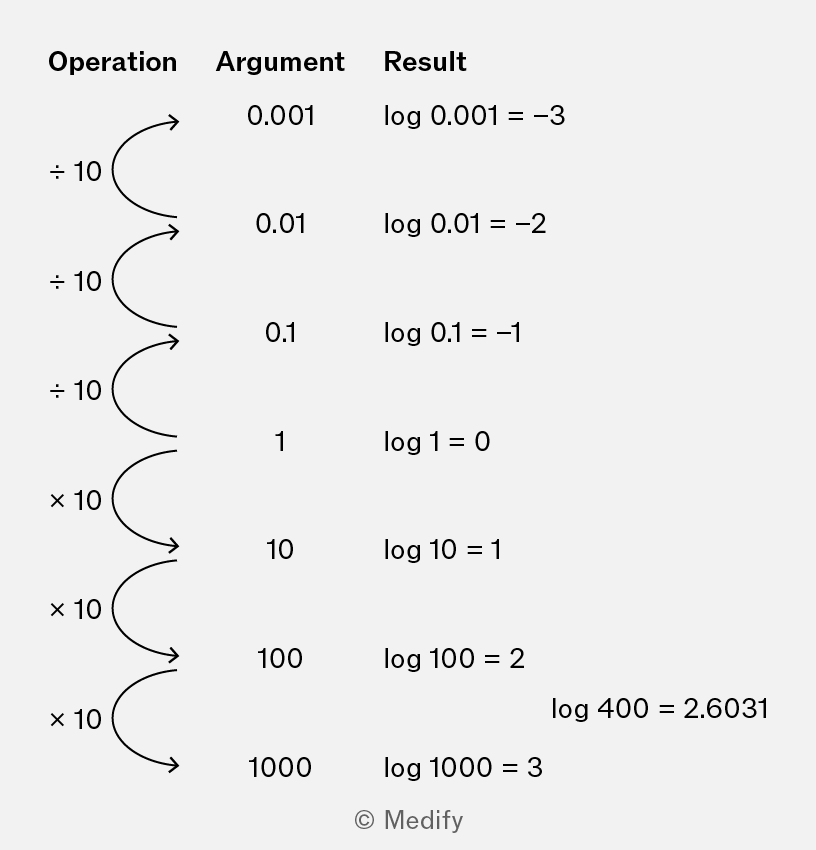
The logarithm of a number between 0 and 1 is negative. For example,
because =0.01.
You can think of this as starting from 1 and dividing by 10 twice to get 0.01.
A logarithm can use any positive number as its base. The following example uses base 7.
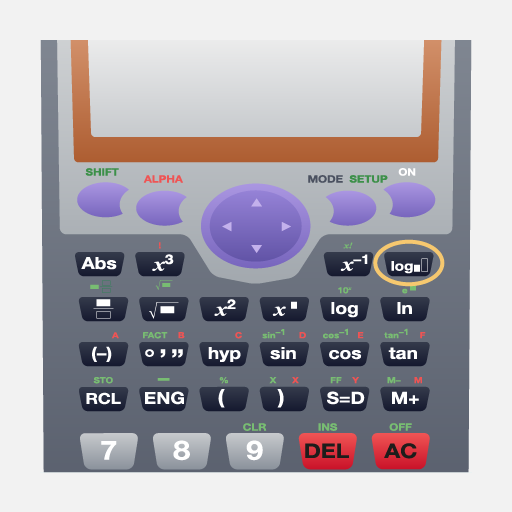
It is important to note that in your A-level science exam questions, logarithms will use base 10 or base only. As these logarithms are commonly used in mathematics and science, you will usually see them written without the base. Make sure to use the correct button on your calculator!
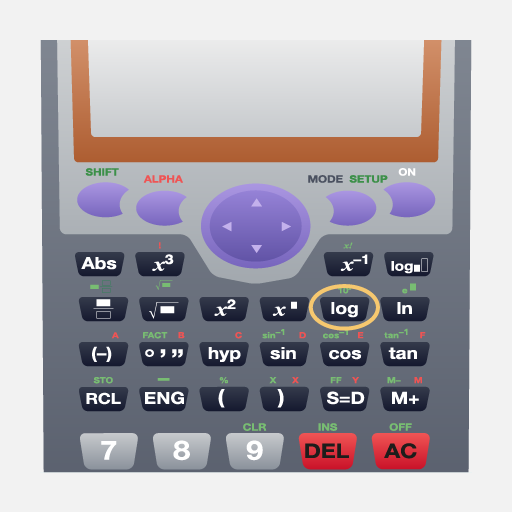
You may see graphs with one axis using a logarithmic scale. Typically, the numbers on the axis are powers of 10, such as 1, 10, 100, and 1000. The gridlines between these numbers are spaced unevenly.
Each gridline represents the next multiple of the lower number. For example, the gridlines between 100 and 1000 represent 200, 300, etc. Take care when reading logarithmic scales!
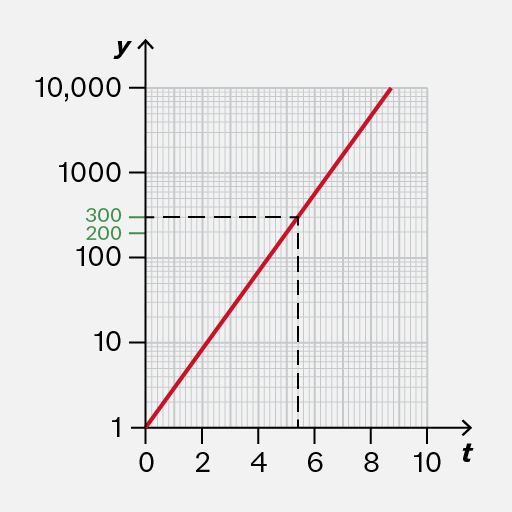
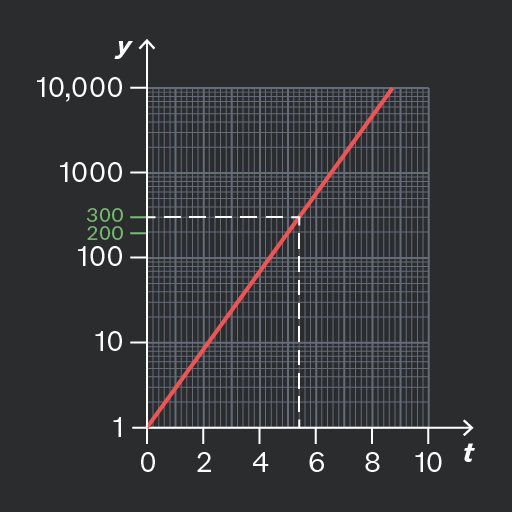
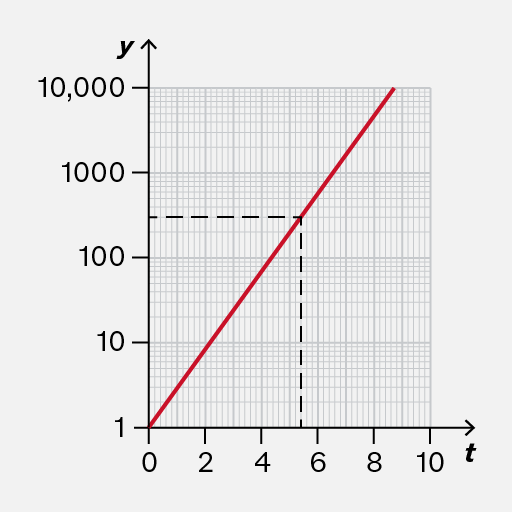
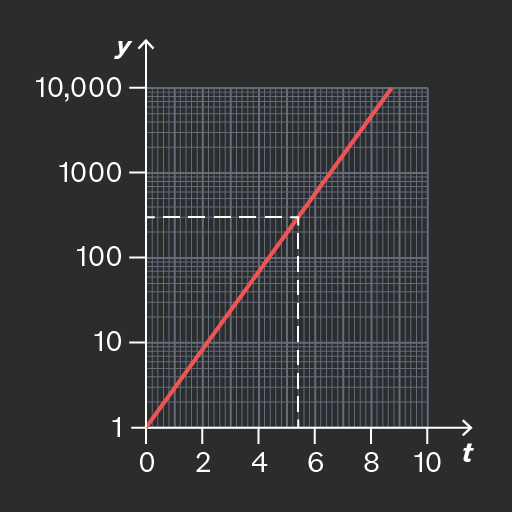
Graphs showing exponential growth or exponential decay can be difficult to read. So it is usual for the logarithms to be plotted instead. In this case, the graph of the logarithms will be a straight line. Easy to read!
You may sometimes see straight-line graphs with the vertical axis using logarithms. You need to be aware that the underlying relationship is exponential, not linear (and not proportional).
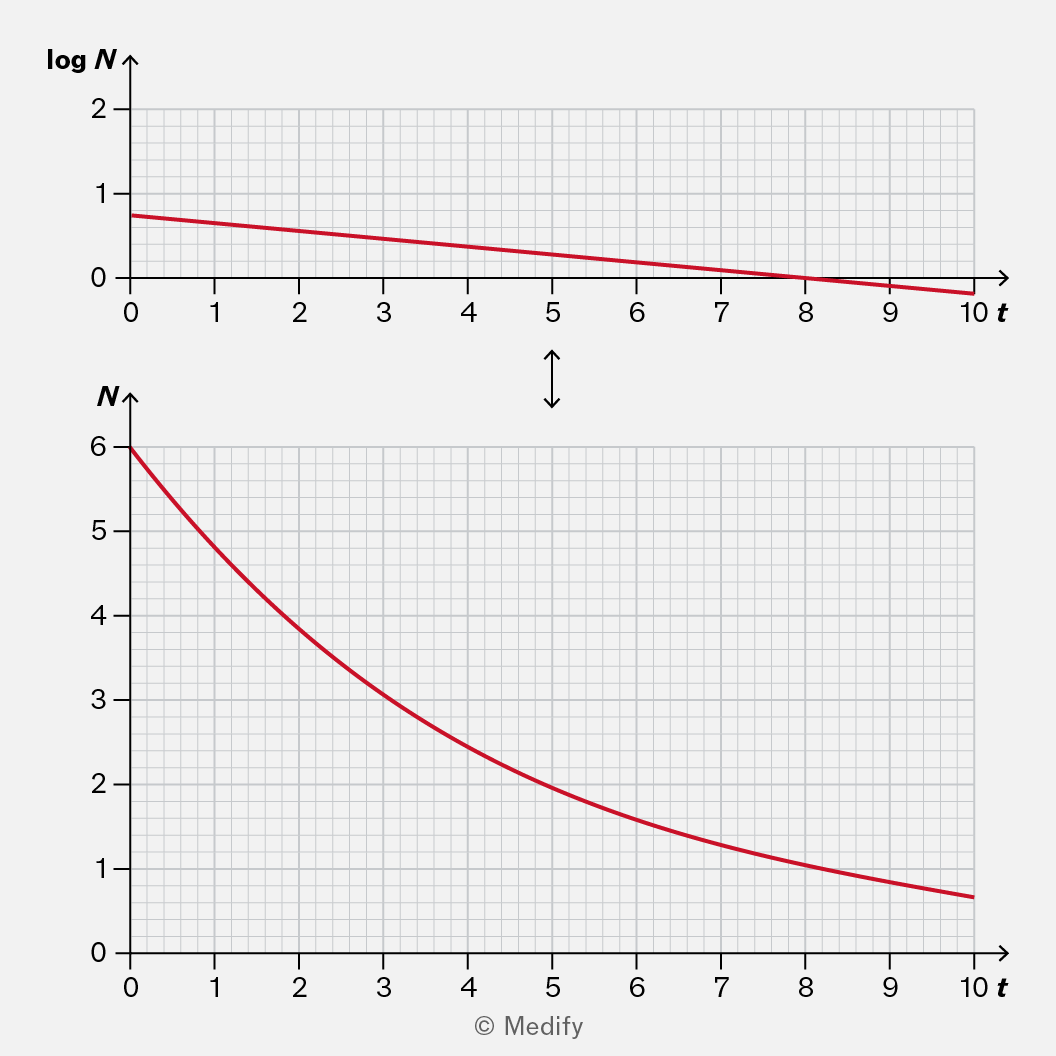
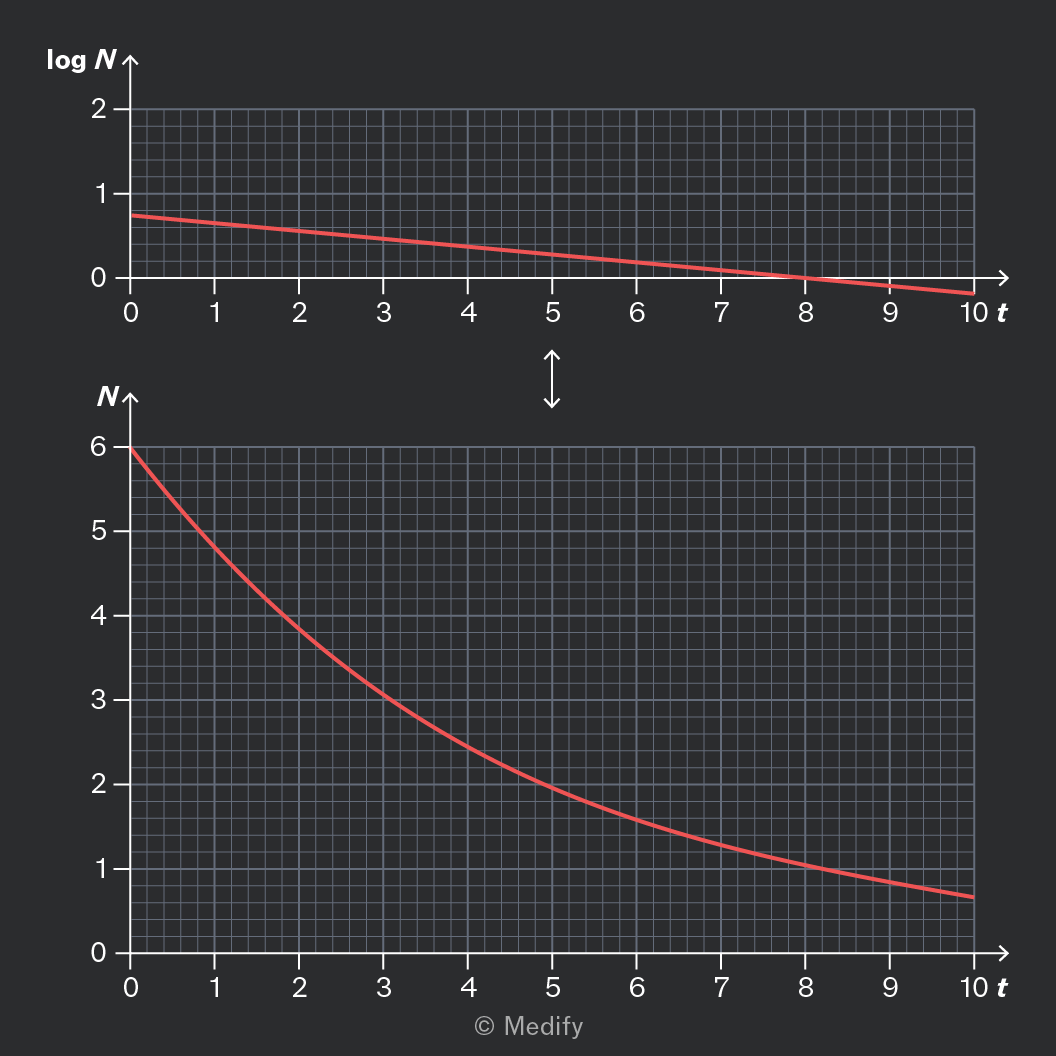
The first graph shows the straight-line
This actually illustrates the exponential decay in the second graph.
Question walkthrough
Solve a simple problem by reading data points from a log graph.
Solve a problem on a logarithmic graph by interpreting data points and trends.