Section III - Reasoning in Biological and Physical SciencesSection III skillsData manipulation in Section III

Data manipulation in Section III

How data manipulation skills are applied in GAMSAT Section III.
2 min
Data manipulation An ability to extract and use information from diagrams and tables
Add to favourites

In GAMSAT Section III, a core requirement will be your ability to interpret and manipulate a variety of types of graphical data.
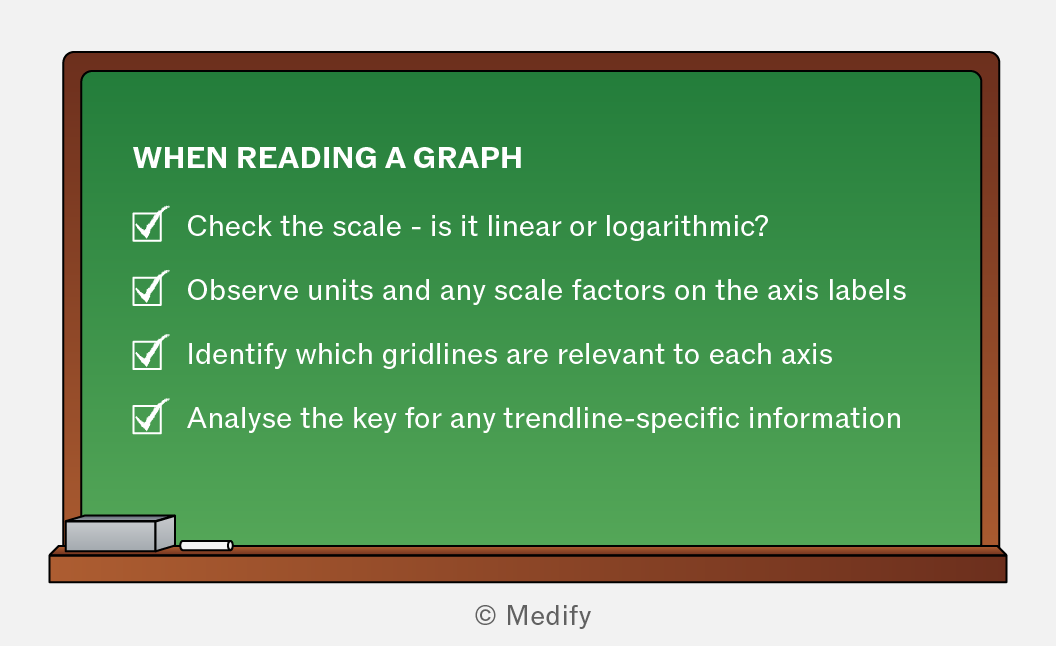
A green chalkboard with the title 'WHEN READING A GRAPH' at the top. Below are four checkmarked bullet points: 'Check the scale - is it linear or logarithmic?', 'Observe units and any scale factors on the axis labels', 'Identify which gridlines are relevant to each axis', and 'Analyse the key for any trendline-specific information'. The bottom right corner has the Medify logo.
Add to favourites

The variety of graphs you could encounter in Section III is large. Understanding different graphical forms of data representation and how to use them will reduce the ‘shock factor’ in the exam.
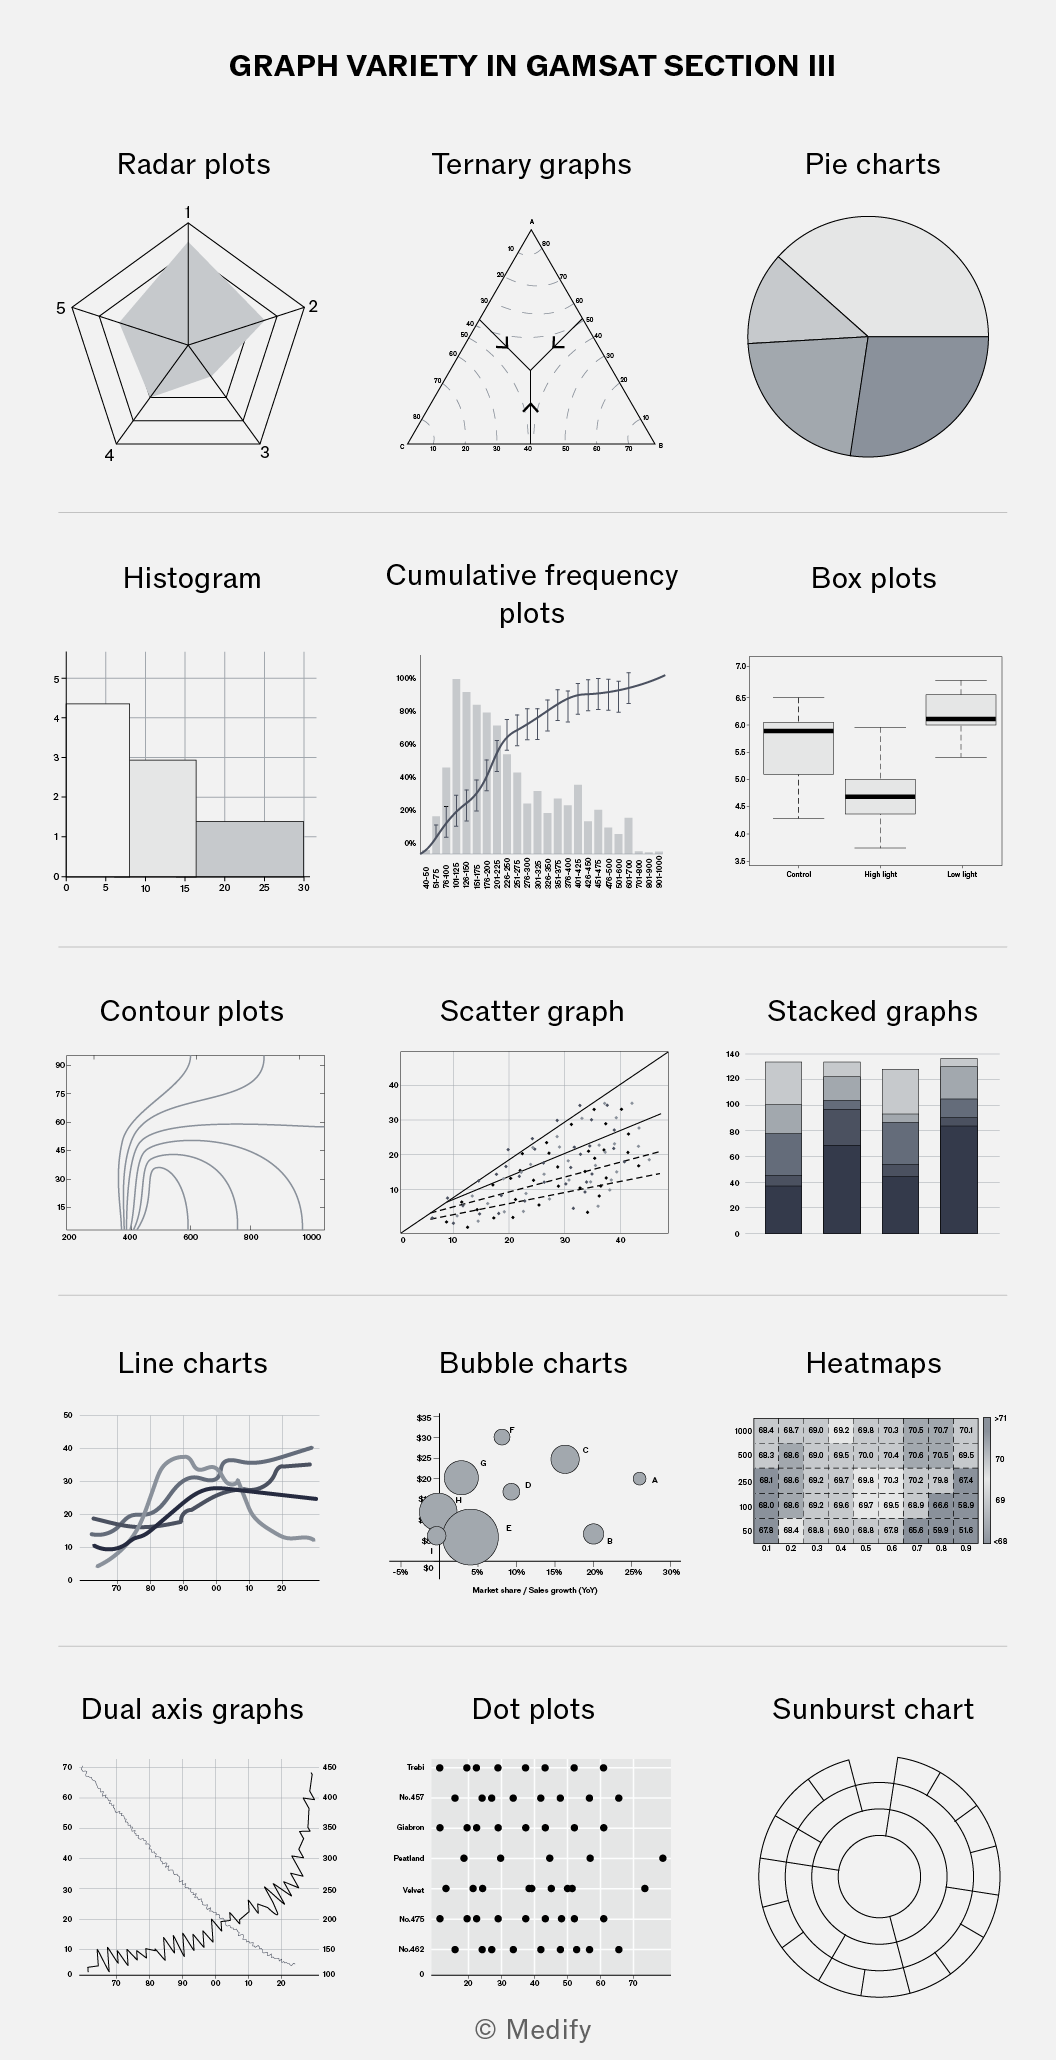
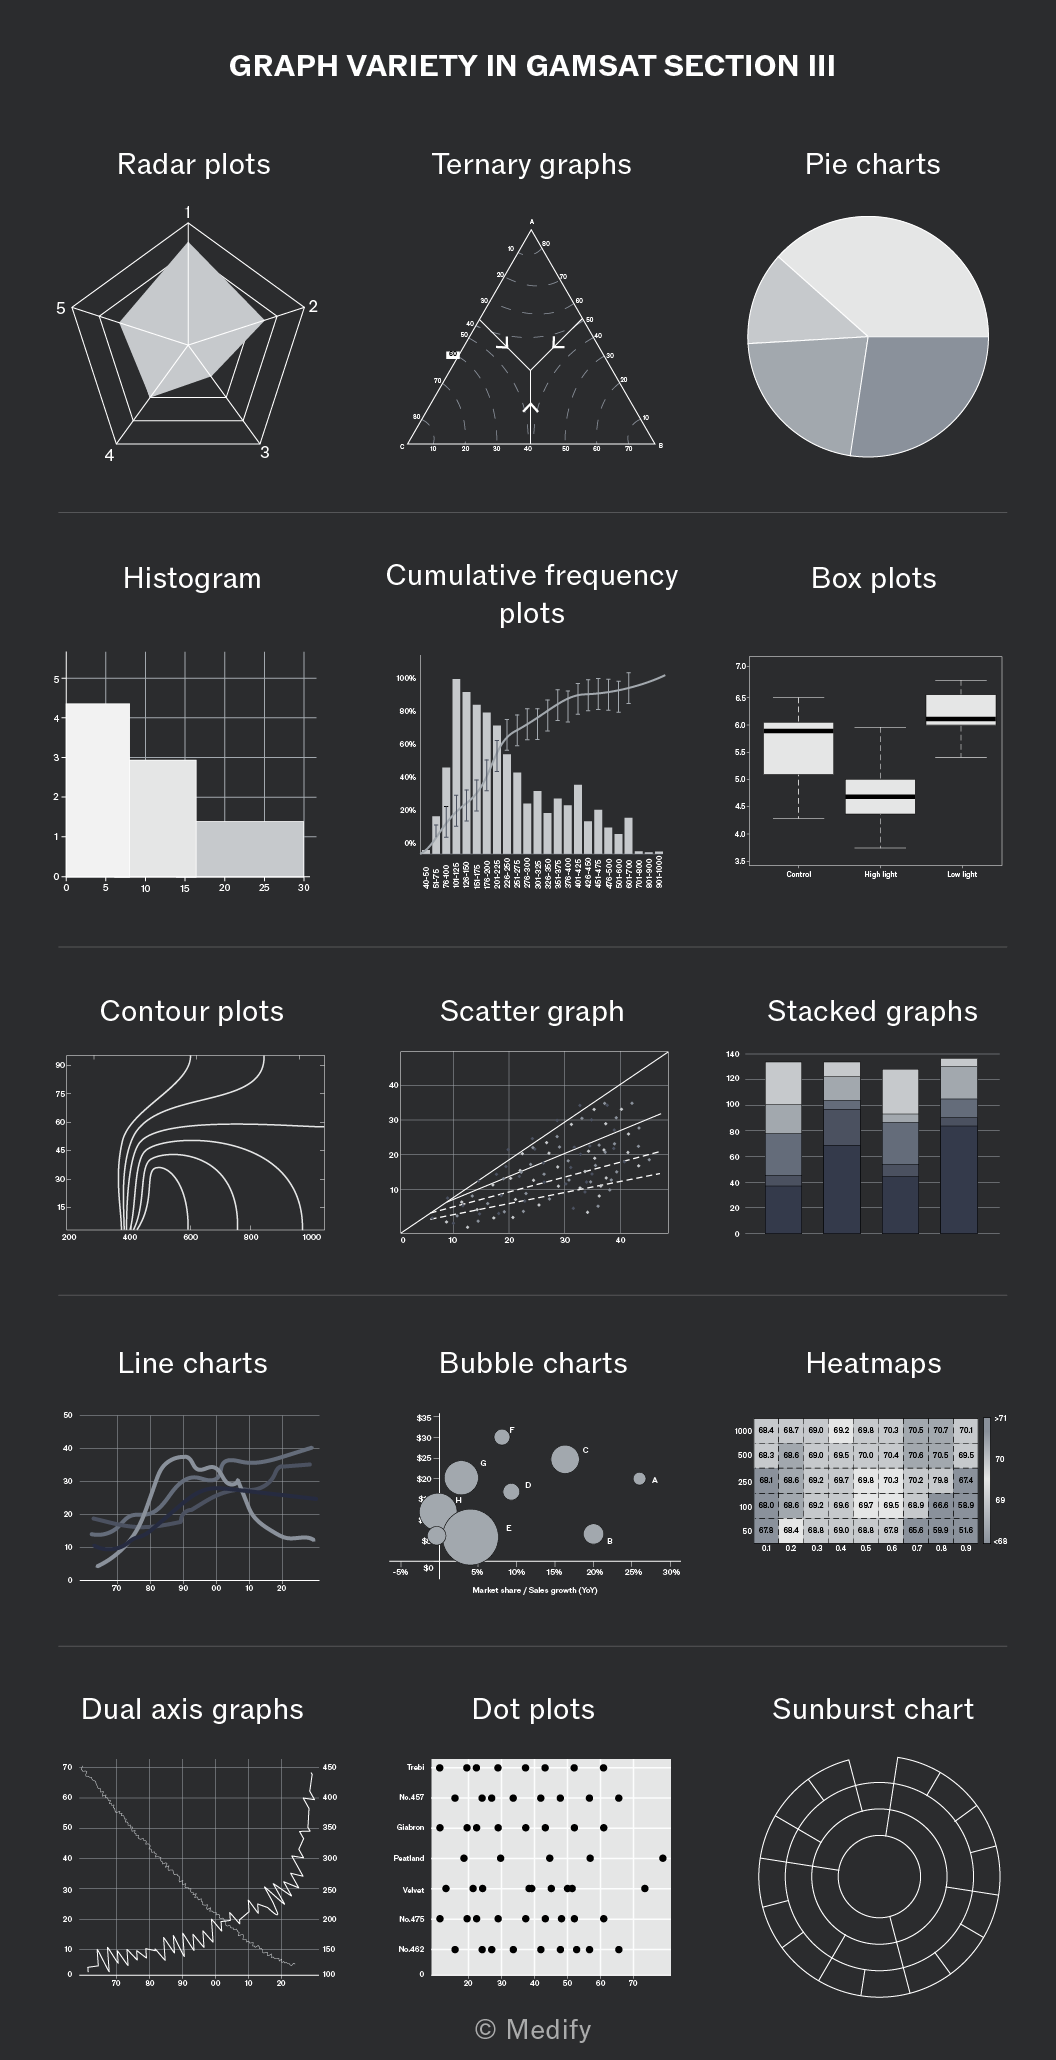
GRAPH VARIETY IN GAMSAT SECTION III. Radar plots, Ternary graphs, Pie charts, Histogram, Cumulative frequency plots, Box plots, Contour plots, Scatter graph, Stacked graphs, Line charts, Bubble charts, Heatmaps, Dual axis graphs, Dot plots, Sunburst chart.
Add to favourites

Visual data presentation can take non-graphical forms. Regardless of the form used, the rules governing the visual data must be understood to interpret the information being presented.
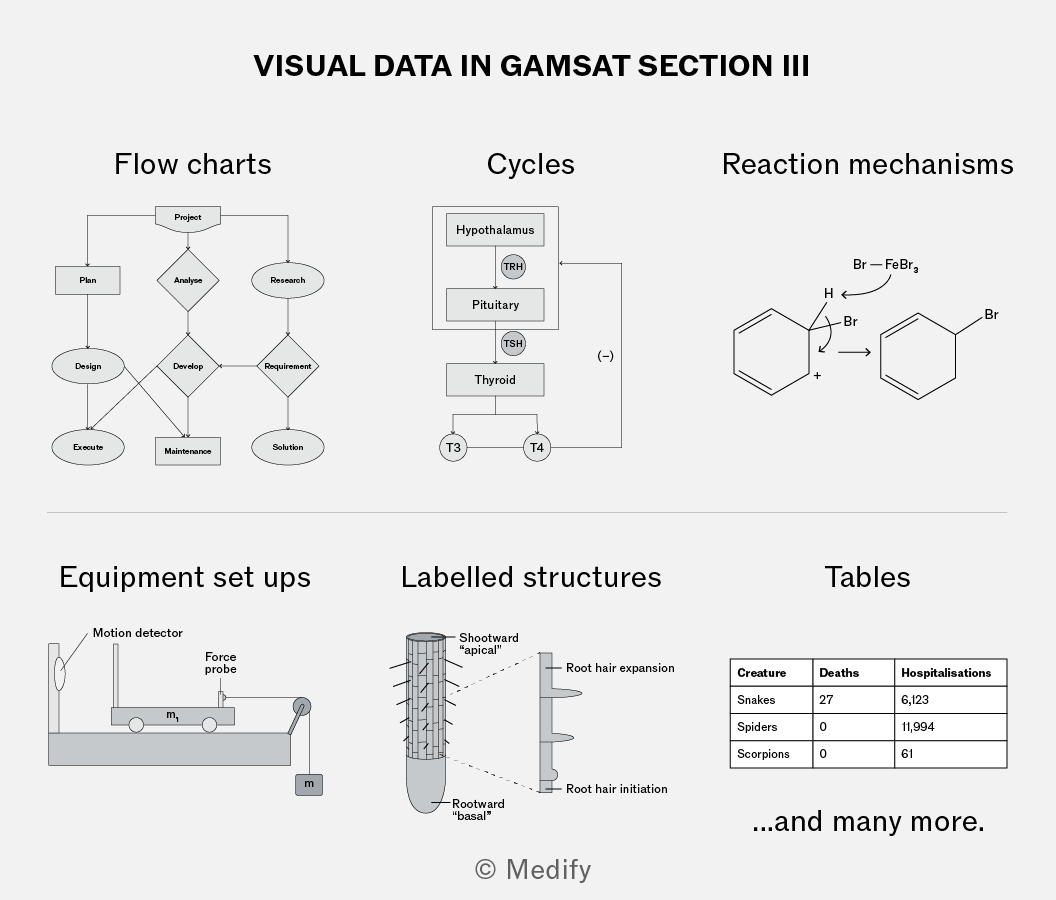
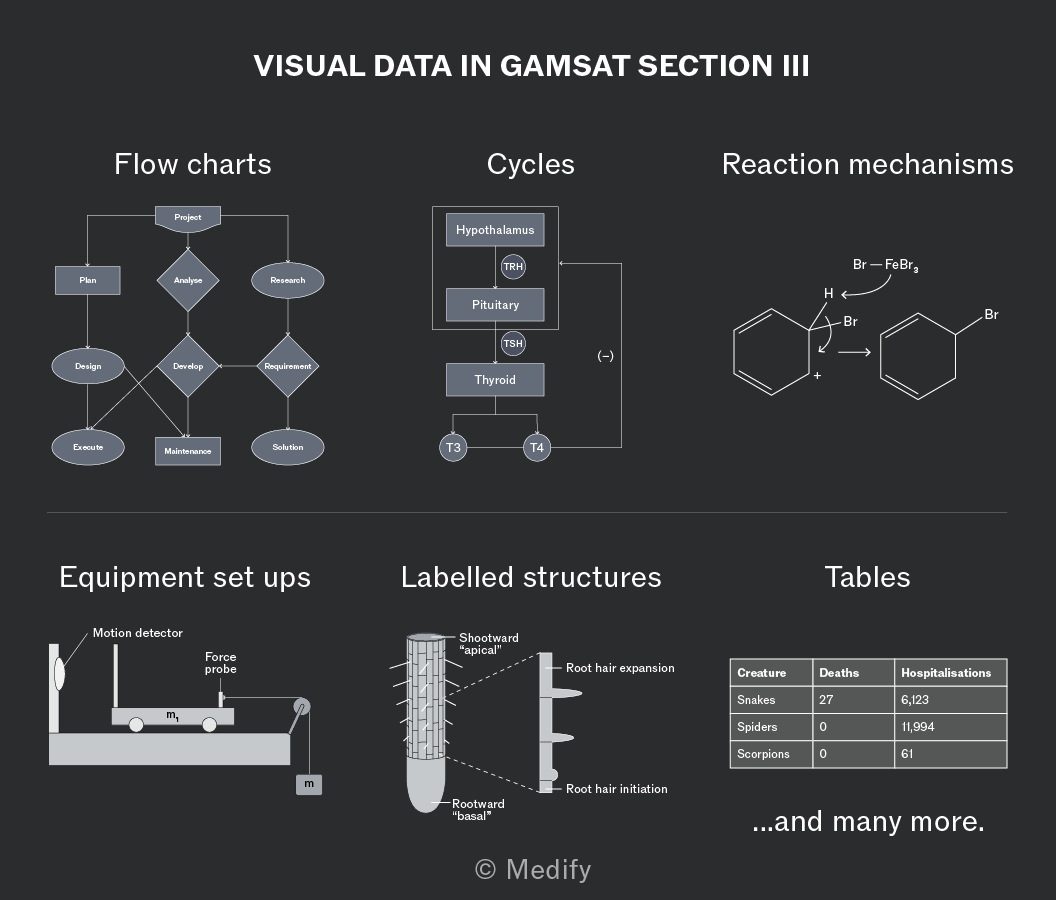
VISUAL DATA IN GAMSAT SECTION III. Flow charts: Project, Plan, Analyse, Research, Design, Develop, Requirement, Execute, Maintenance, Solution. Cycles: Hypothalamus, TRH, Pituitary, TSH, Thyroid, T3, T4. Reaction mechanisms: Br — FeBr3, H, Br, Br. Equipment set ups: Motion detector, Force probe, m. Labelled structures: Shootward 'apical', Root hair expansion, Root hair initiation, Rootward 'basal'. Tables: Creature, Deaths, Hospitalisations, Snakes 27, 6,123, Spiders 0, 11,994, Scorpions 0, 61, ...and many more.
Add to favourites

Your GAMSAT sitting will involve some novel visual data requiring you to work out how to use it ‘on the spot’, but there are some key scientific graphs and diagrams you could familiarise yourself with in advance.
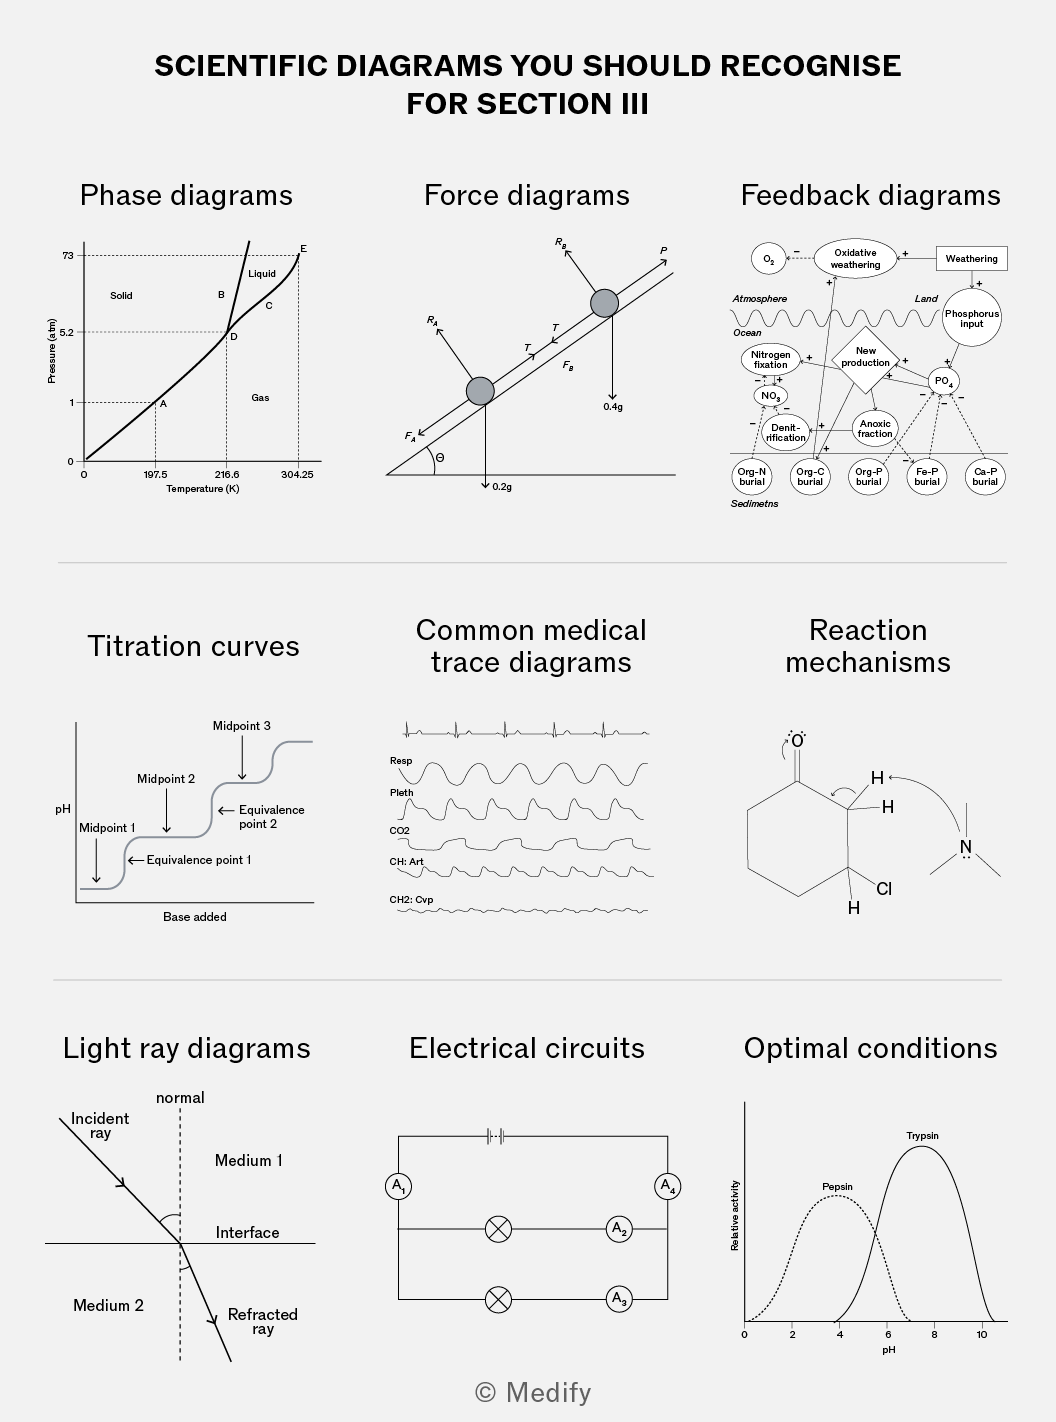
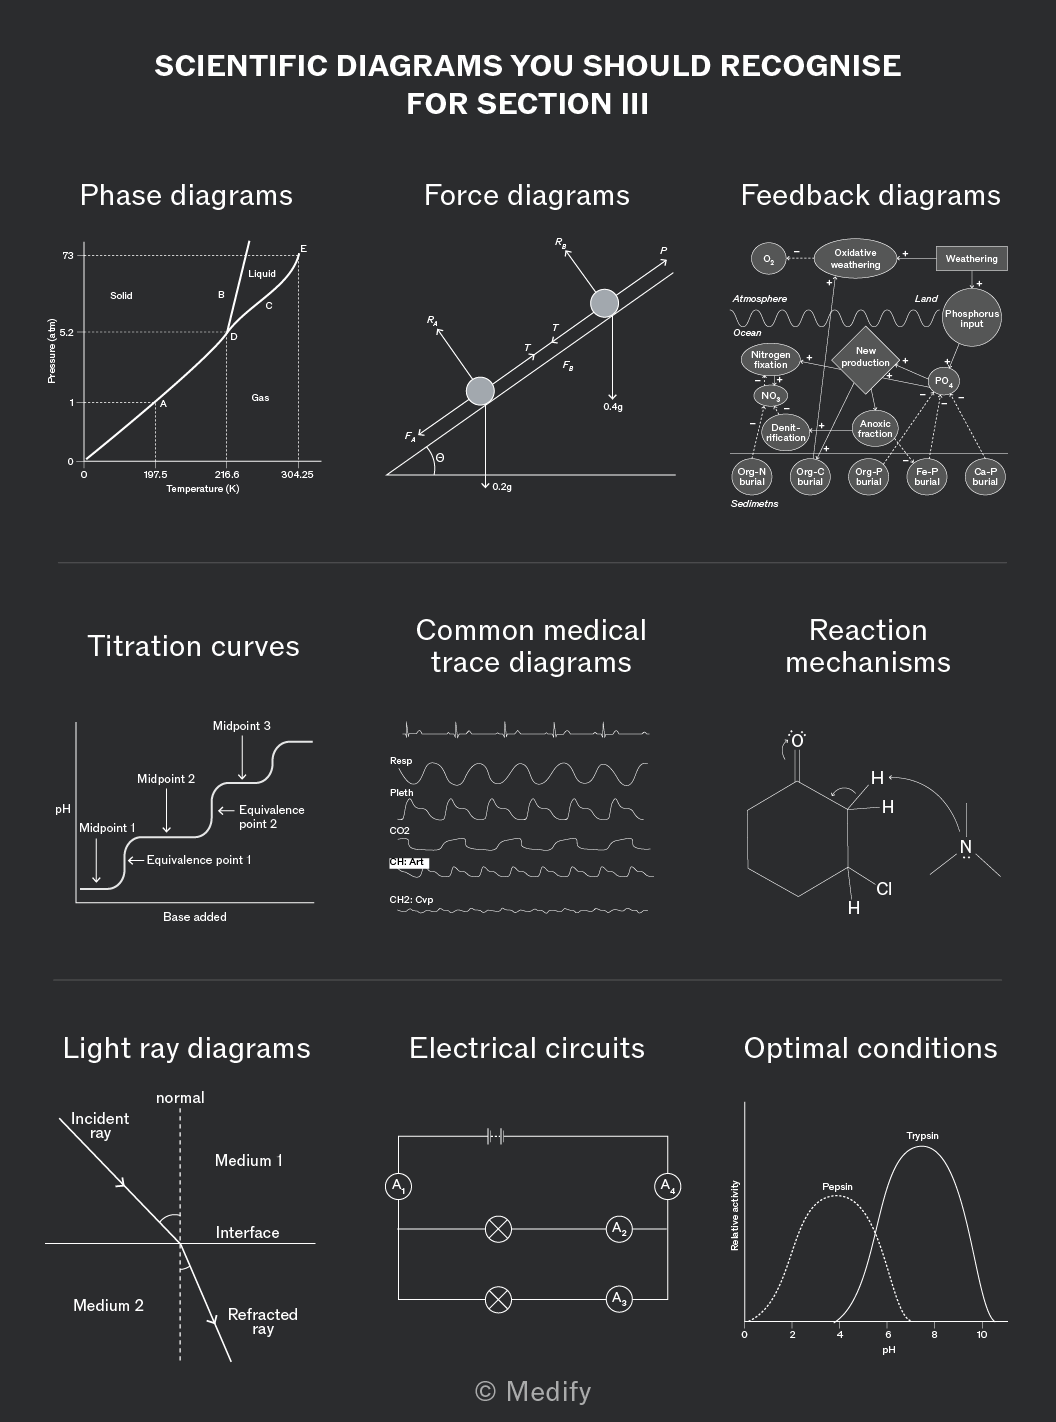
An educational infographic titled 'SCIENTIFIC DIAGRAMS YOU SHOULD RECOGNISE FOR SECTION II'. It includes various scientific diagrams: Phase diagrams showing pressure versus temperature with labeled points A, B, C, D, E, and states of matter; Force diagrams illustrating forces Fk, Fr, and T; Feedback diagrams depicting processes like nitrogen fixation and burial; Titration curves with midpoints and equivalence points; Common medical trace diagrams labeled Resp, Pleth, CO2, CH Art, and CH2: Ovp; Reaction mechanisms showing molecular interactions; Light ray diagrams illustrating incident and refracted rays; Electrical circuits with labeled components A1, A2, and A3; and Optimal conditions graph showing relative activity of Pepsin and Trypsin against pH.
Add to favourites