
Mass transport in animals (3.3.4.1)
On this page
Both surface area and volume are crucial factors in determining how substances move into, out of, and within organisms.
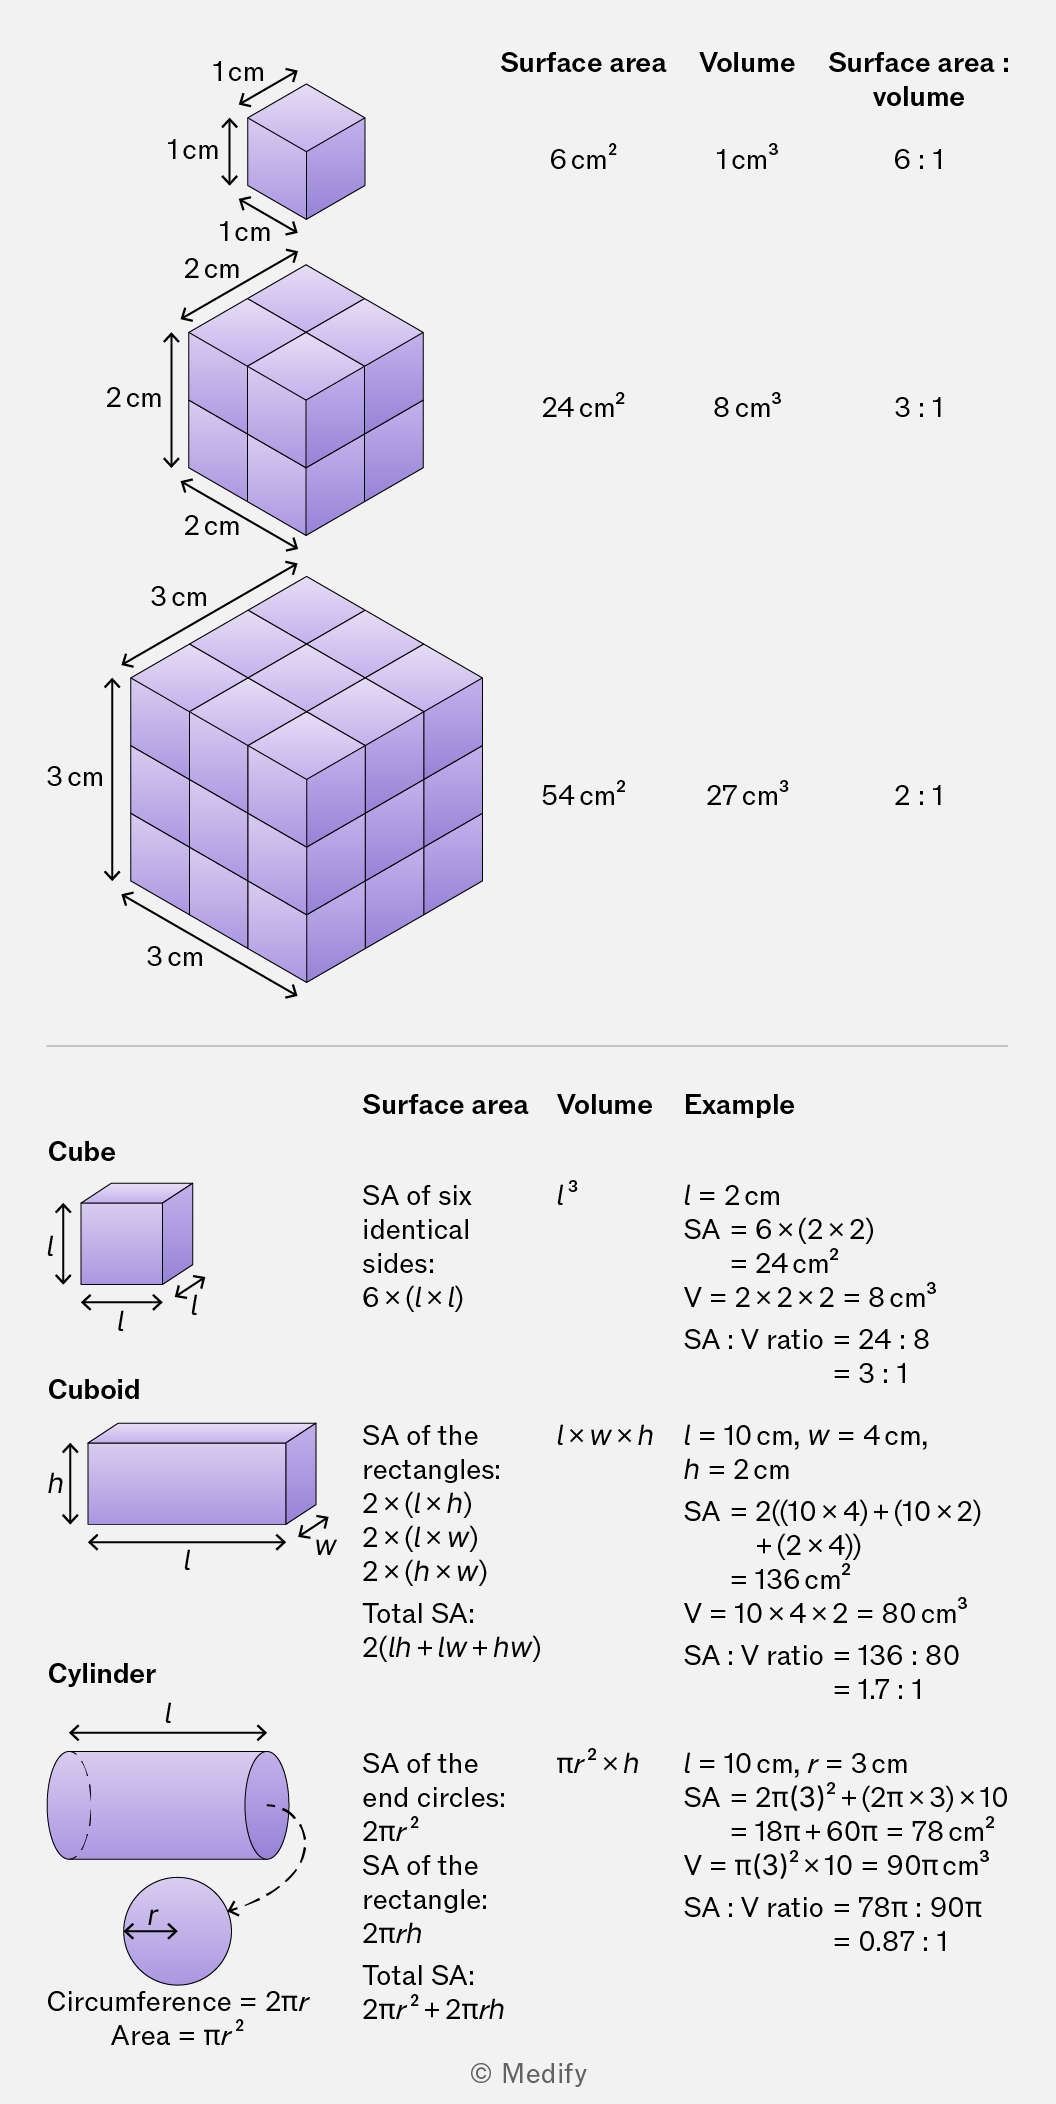
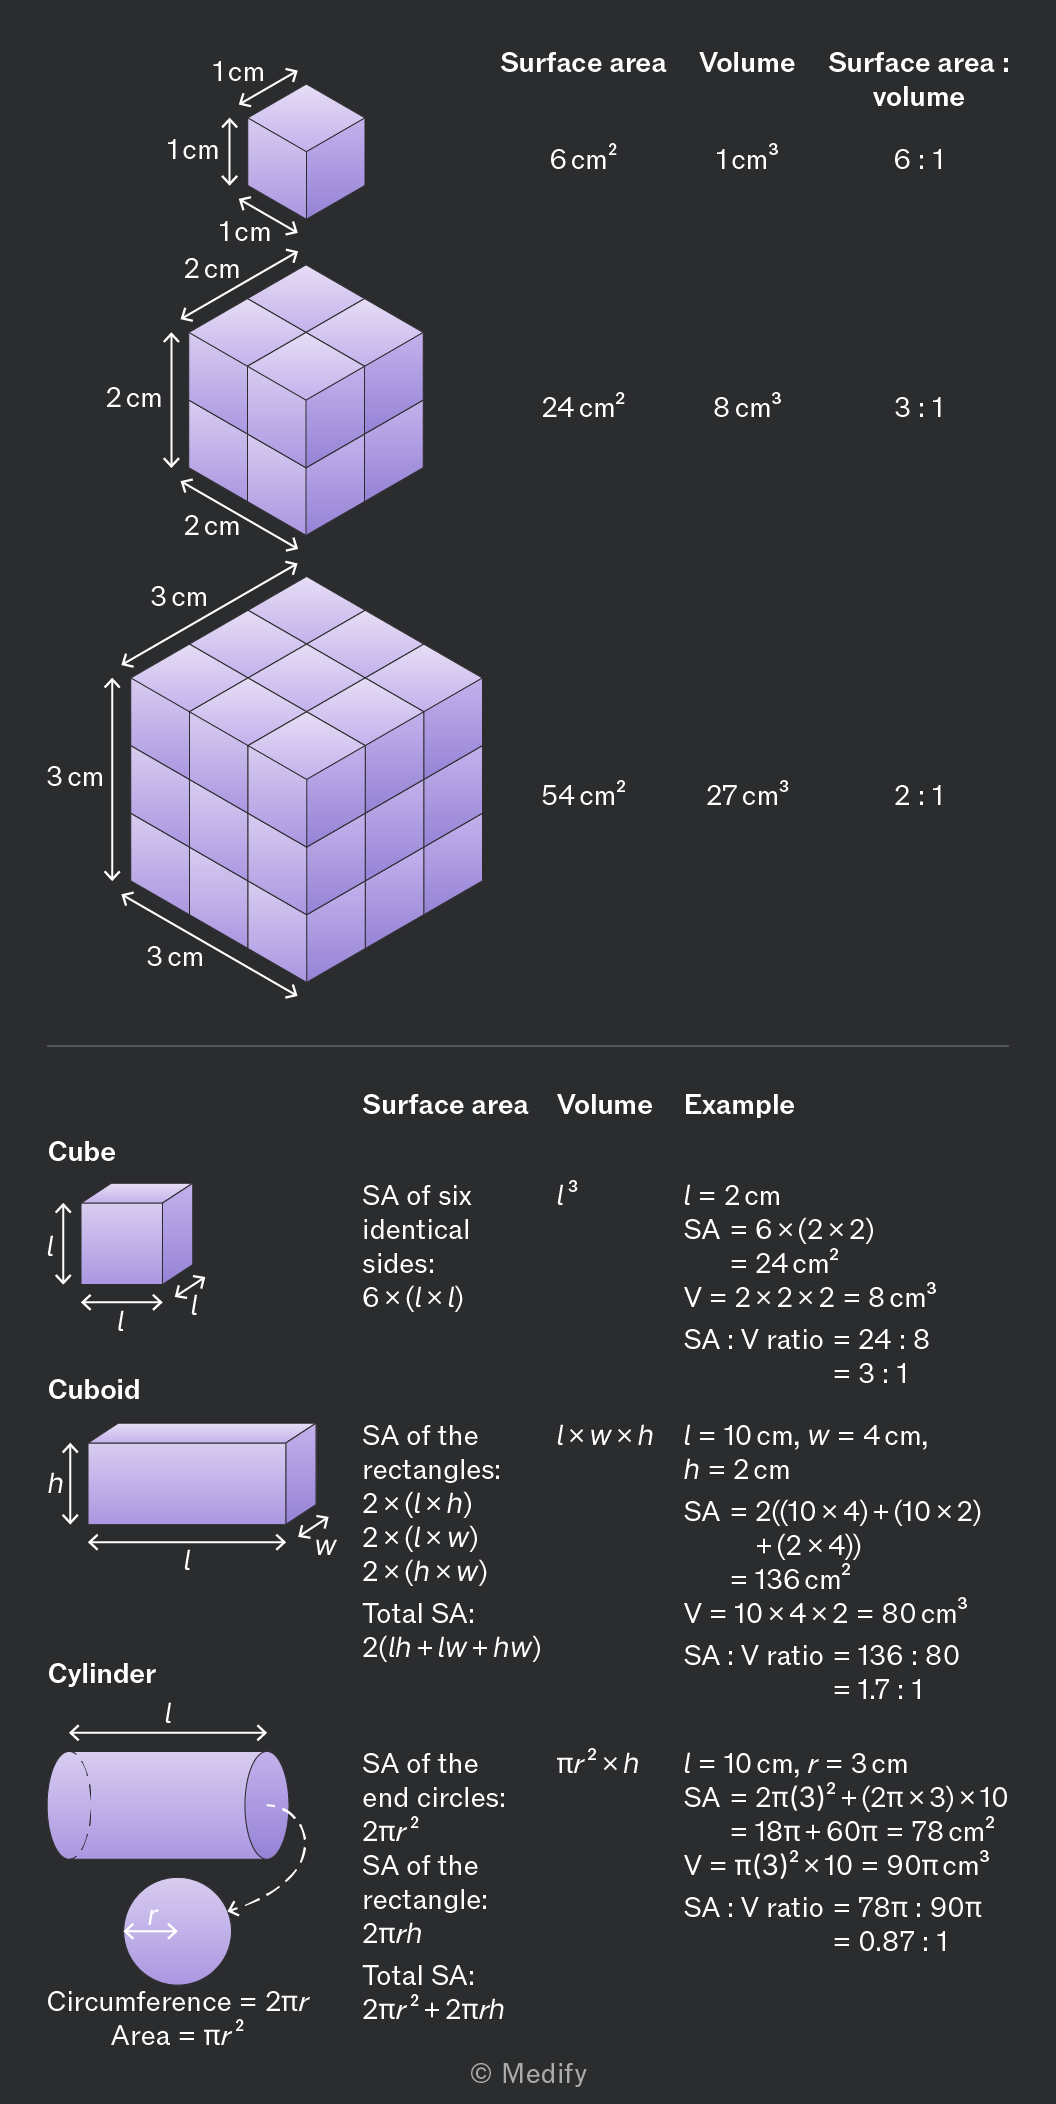
Surface area is the total external area of the organism that is in contact with the environment.
Volume is the total internal space within an organism.
As organism size increases, its surface area-to-volume ratio decreases.
Single–celled organisms have a high surface area-to-volume ratio, enabling efficient diffusion of nutrients, gases, and waste owing to short diffusion distances.
Multicellular organisms can be large and complex, with specialised tissues and organ systems. Metabolic demands include taking in nutrients, exchanging gases, and excreting waste products.
Mass transport systems are needed to overcome the limitations of diffusion in moving substances (e.g., hormones, gases, nutrients, wastes) long distances between exchange sites and cells.
Mass flow is the bulk movement of substances driven by a pressure difference. It allows rapid, directed transport over long distances in large organisms.
Diffusion occurs over short distances at exchange surfaces, where substances move down concentration gradients.
Mass transport systems link these exchange surfaces, enabling efficient distribution of gases, nutrients and wastes. They help maintain concentration gradients, ensuring effective diffusion and supporting normal cellular function.
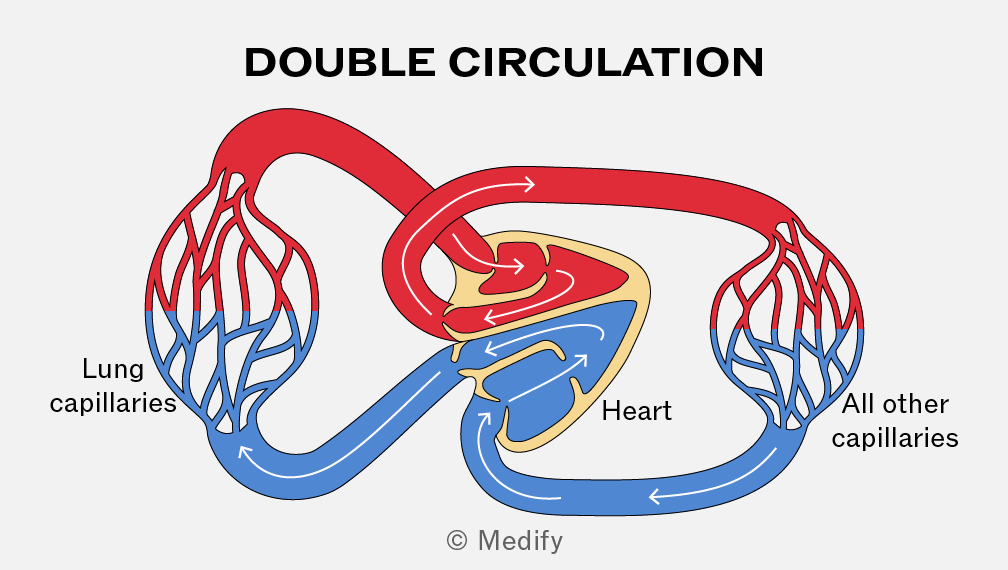
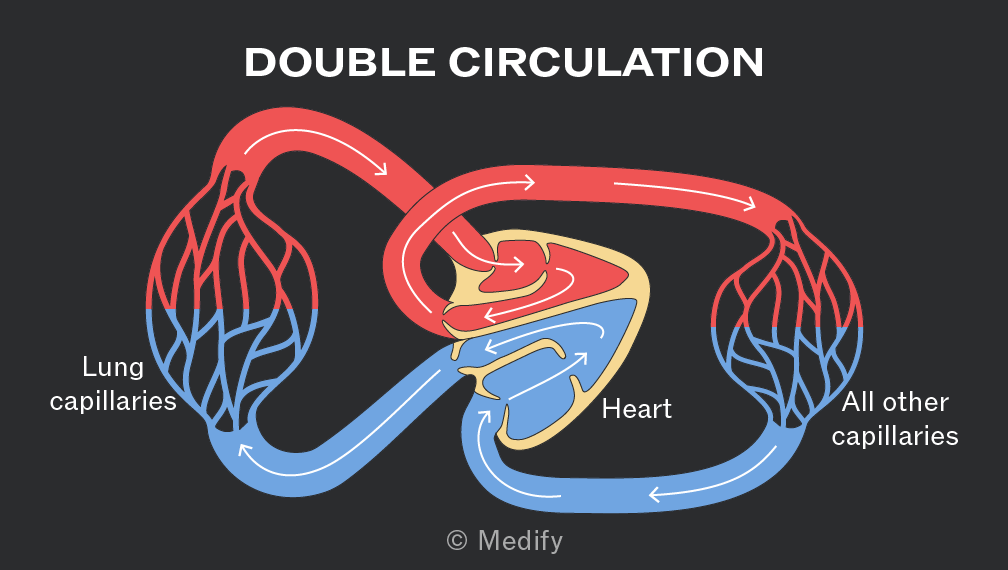
In a double circulatory system such as in mammals and birds, blood passes twice through the heart per circuit.
The right side of the heart pumps deoxygenated blood to the lungs (pulmonary circulation) while oxygenated blood returns to the left side of the heart and is pumped throughout the body (systemic circulation).
The heart pumps oxygenated blood at high pressure through a network of vessels to body tissues, ensuring large surface area for diffusion, short diffusion distances, steep diffusion gradients for fast oxygen and nutrient delivery.
The composition of blood vessels varies by function. The presence and relative thickness of each layer differs between vessels.
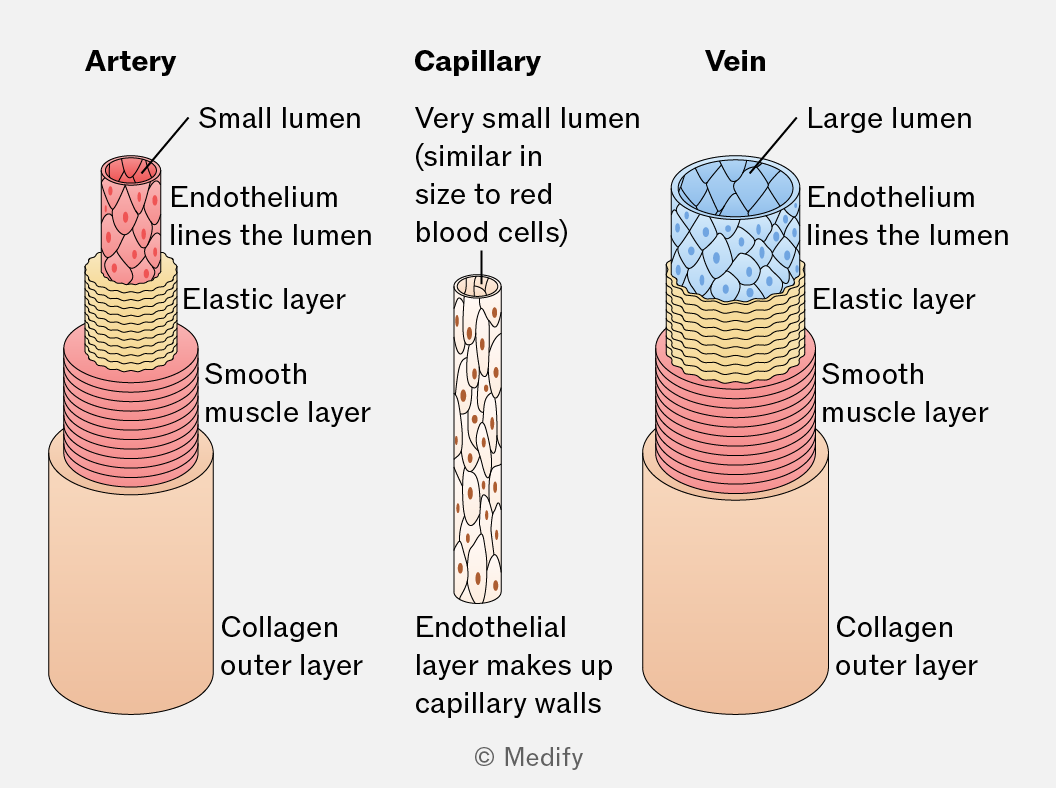
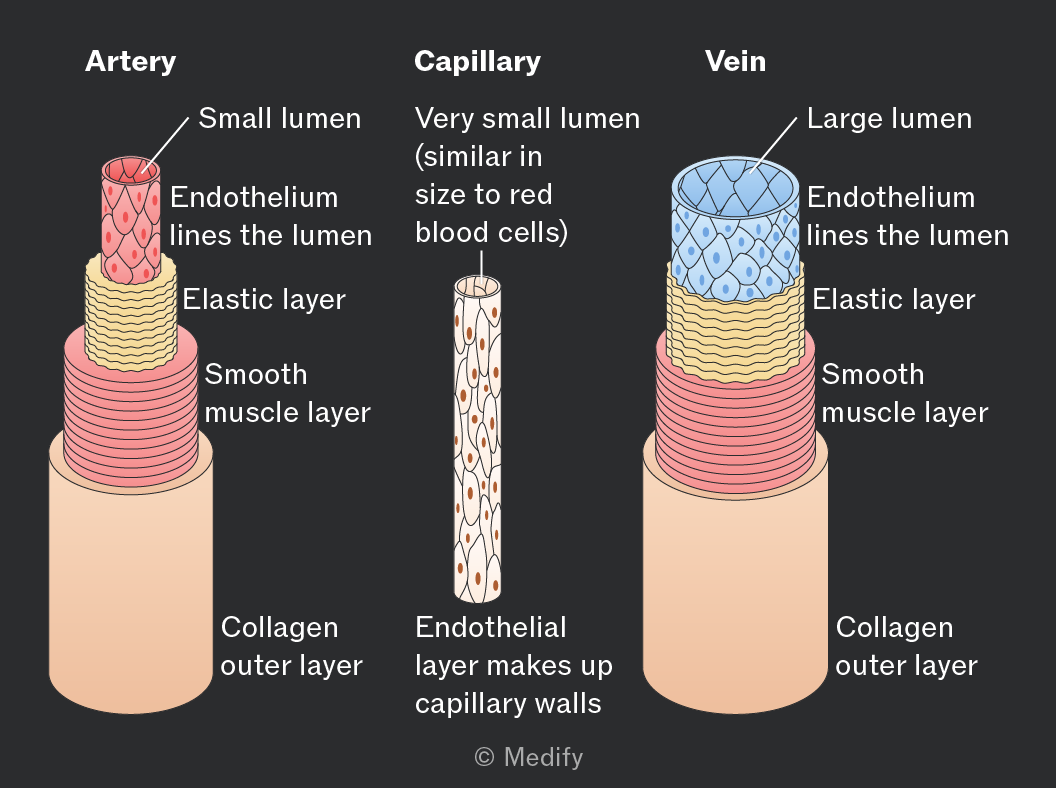
Arteries transport blood away from the heart rapidly and at high pressure.
Arteries have thick walls, muscle layers and elastic layers compared with veins:
- Collagen walls restrict the maximum stretch of the vessel as blood is pumped under high pressure.
- Smooth muscle controls blood flow through constricting and relaxing the vessel.
- Elastic fibres maintain high blood pressure throughout the arteries ensuring blood can travel long distances, smoothly and quickly.
- No valves (other than in the arteries at the point where they leave the heart).
Arteries branch into narrower vessels called arterioles that link the arteries to capillaries.
- Thicker muscle layer than in arteries to facilitate vasoconstriction and vasodilation.
- The elastic layer is thinner than in arteries as the blood pressure is lower.
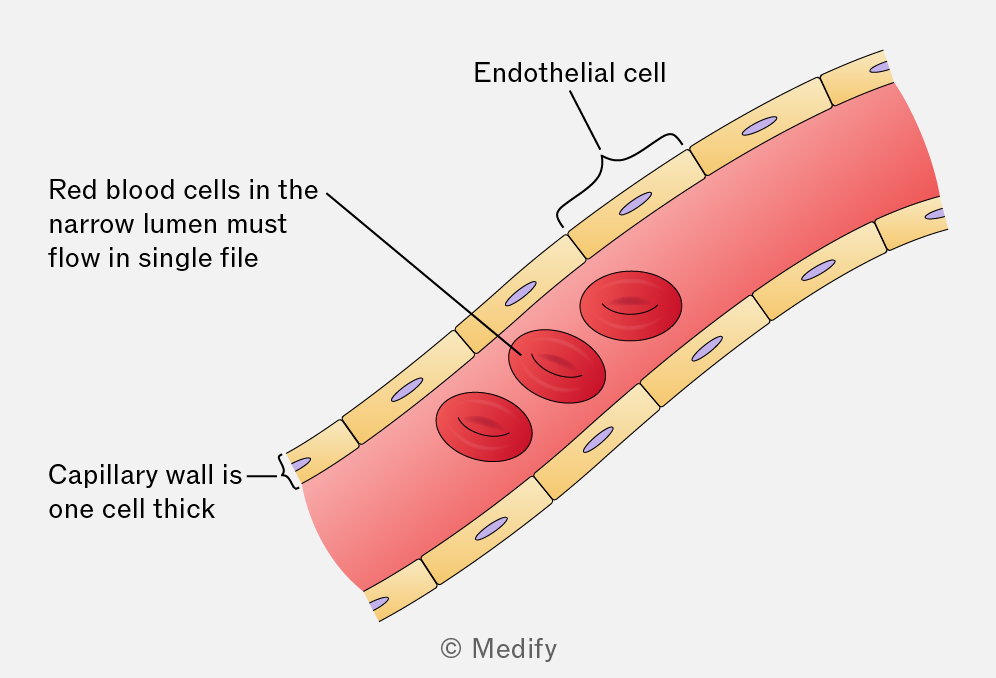
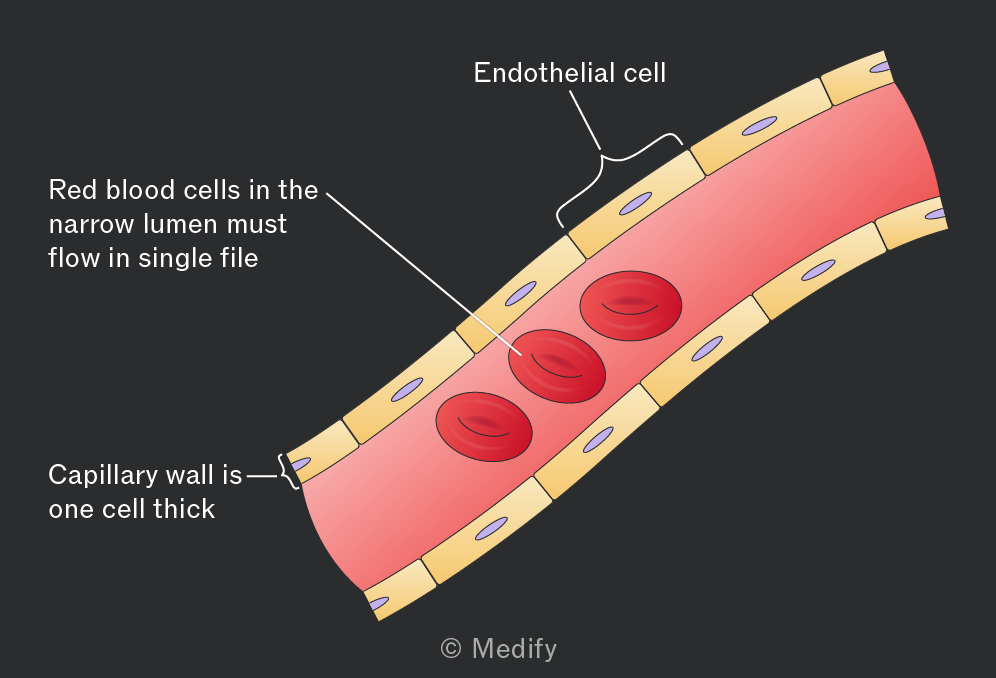
Capillaries are a network of small vessels connecting arterioles to venules and surrounding tissues.
- Their walls are a single layer of endothelial cells reducing diffusion distance between blood and tissue cells and increasing diffusion speed.
- Small diameter slows blood flow, increasing the time available for diffusion and maintaining high pressure and a steep concentration gradient.
- Gaps between endothelial cells allow cells and substances to pass out of the vessels and into the fluid surrounding tissues (e.g., white blood cells).
- Highly branched network create larger surface area for metabolite exchange.
Veins transport blood back to the heart, usually at low pressure.
- Low blood pressure means there is only a need for a thin collagen layer. This also enables compression of vessels by surrounding muscles to generate pressure for circulation.
- Thin muscle layer compared with arteries.
- Thin elastic layer owing to low pressure within the vessel meaning stretch and recoil are not needed.
- Valves are present throughout veins to ensure that blood flowing at low pressure moves only in one direction.
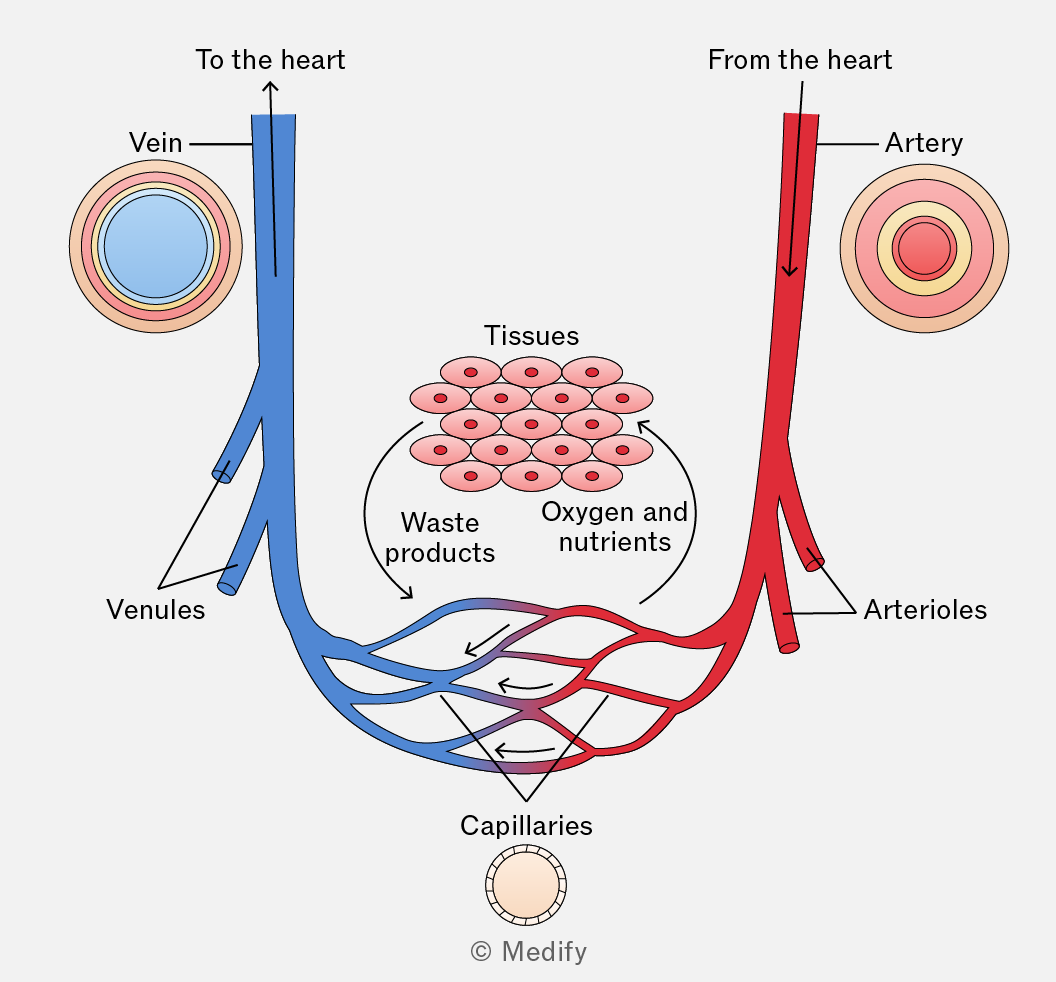
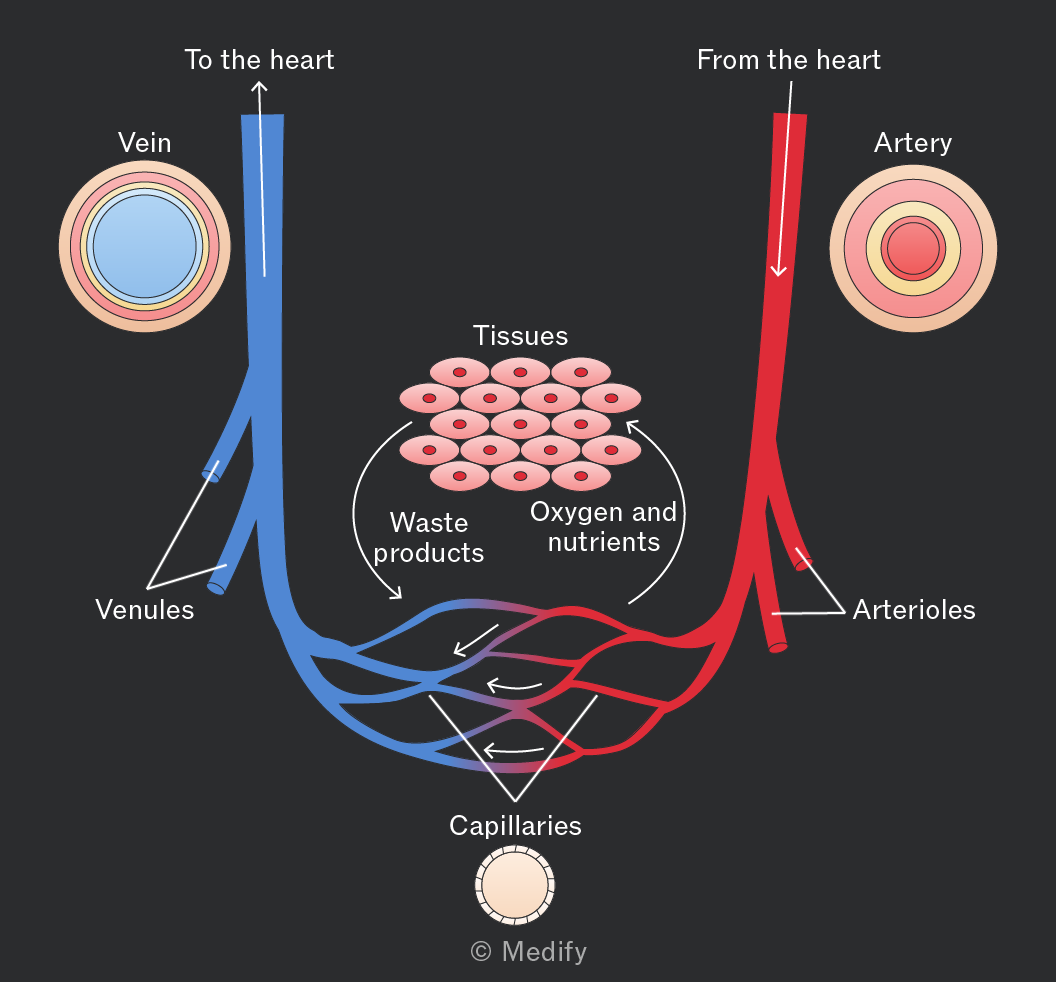
As blood flows through capillaries, some plasma leaks out through gaps in the capillary walls to surround body cells, forming tissue fluid.
Tissue fluid facilitates the exchange of substances including amino acids, ions, glucose, oxygen, carbon dioxide and other waste products between cells and the blood. Large plasma proteins are too big to pass through capillary walls and remain in the blood.
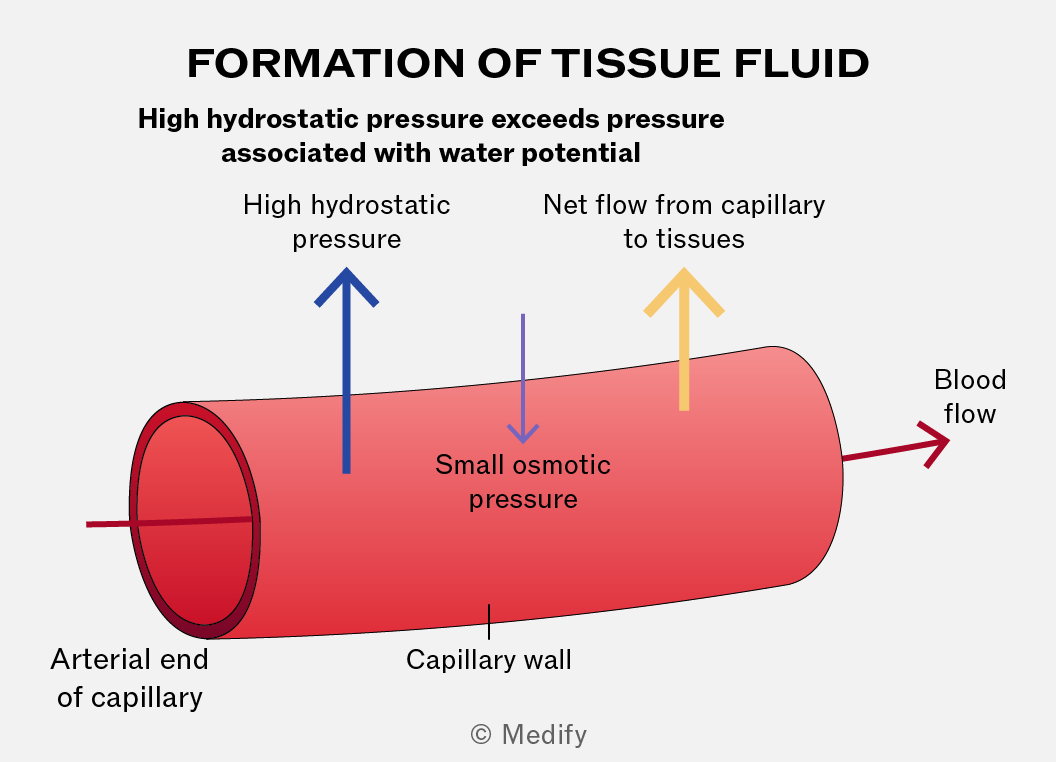
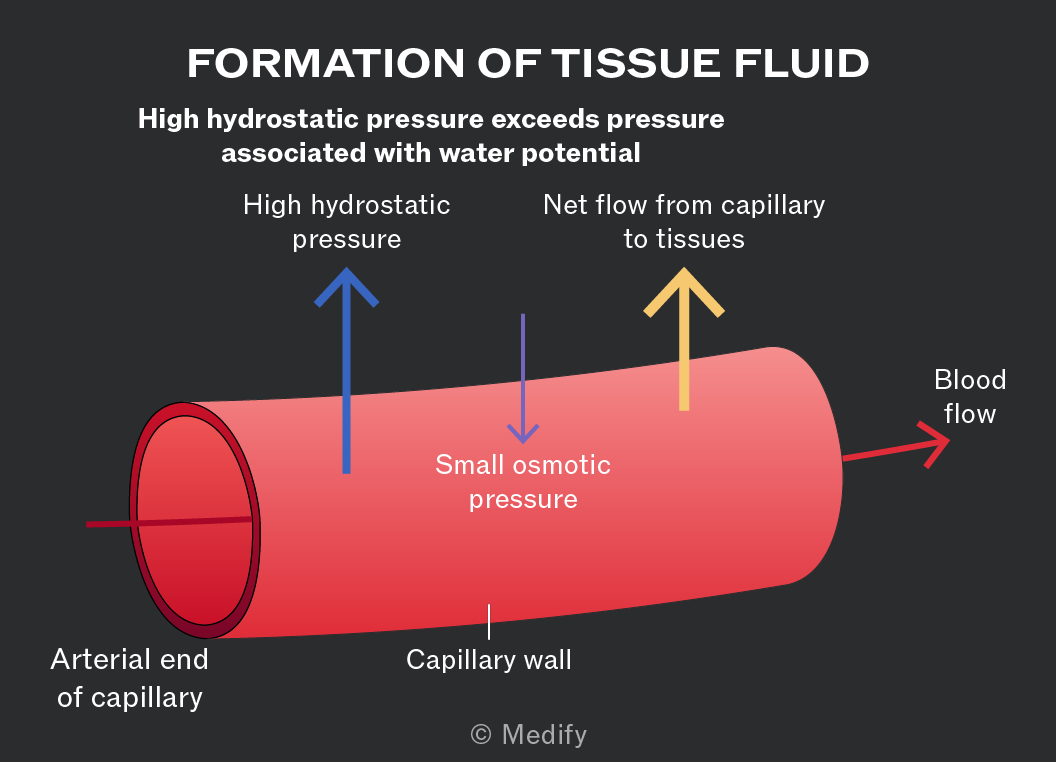
Hydrostatic pressure is exerted by blood on the walls of the capillaries as a result of heart contractions.
At the arterial end of a capillary, hydrostatic pressure is high enough to push fluid out of the capillaries to become tissue fluid. Large proteins and cells remain in the blood. This is called ultrafiltration (filtration under pressure).
After metabolites and gases have been exchanged, approximately 90 of the plasma lost as tissue fluid at the arterial end of a capillary is reabsorbed at the venous end.
The reduction in hydrostatic pressure and the low water potential of the blood (caused by plasma proteins) result in fluid moving back into the capillary.
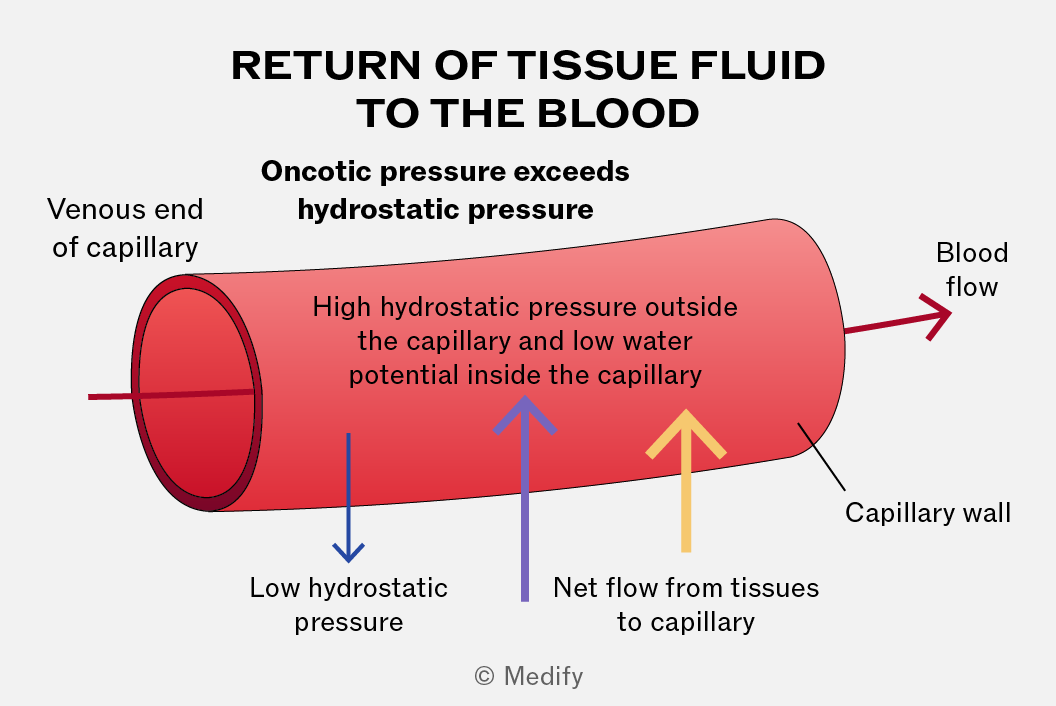
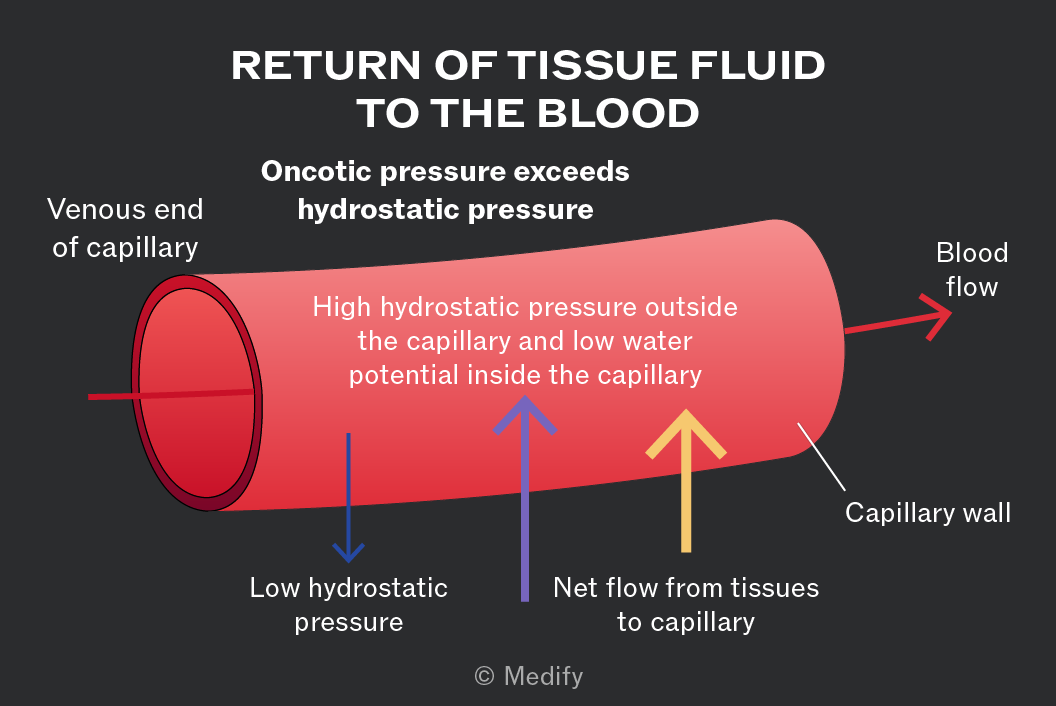
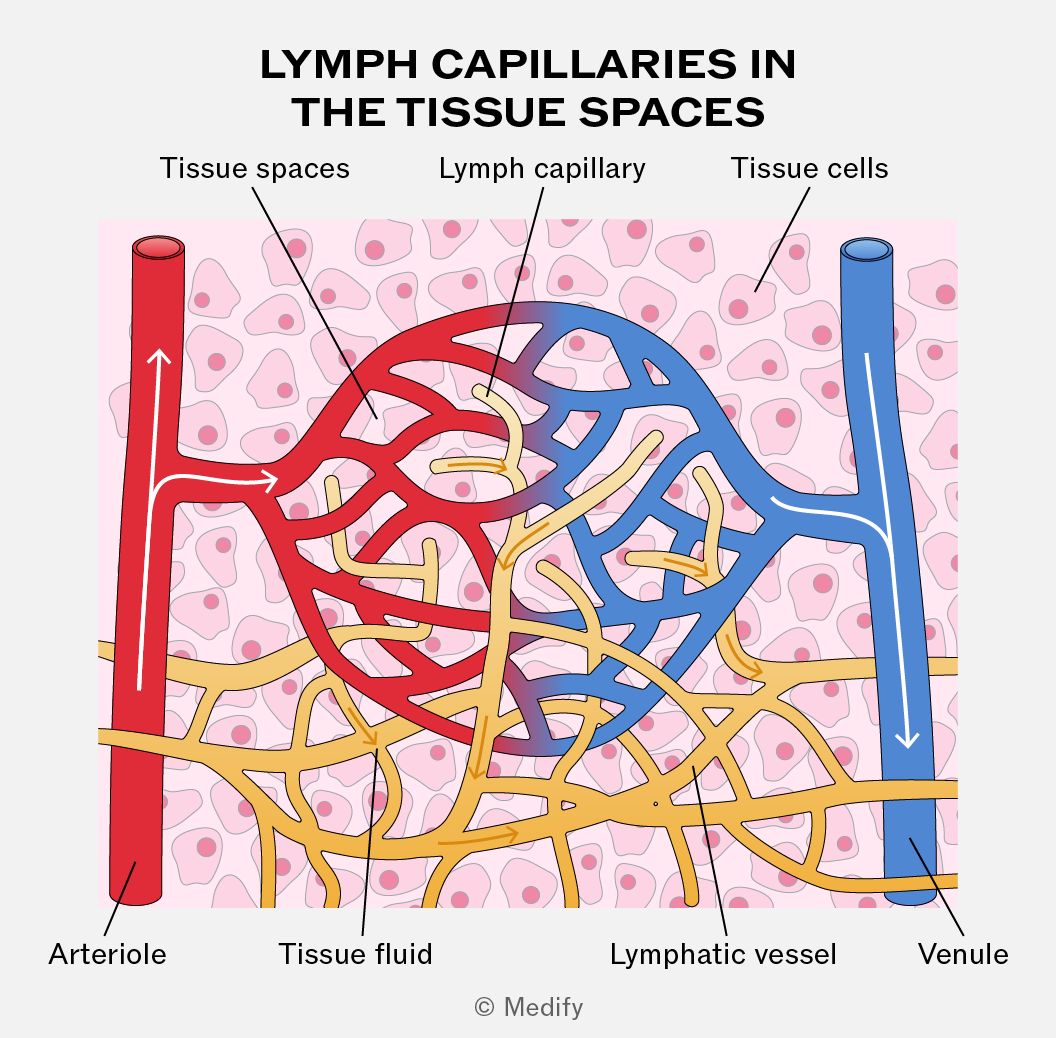
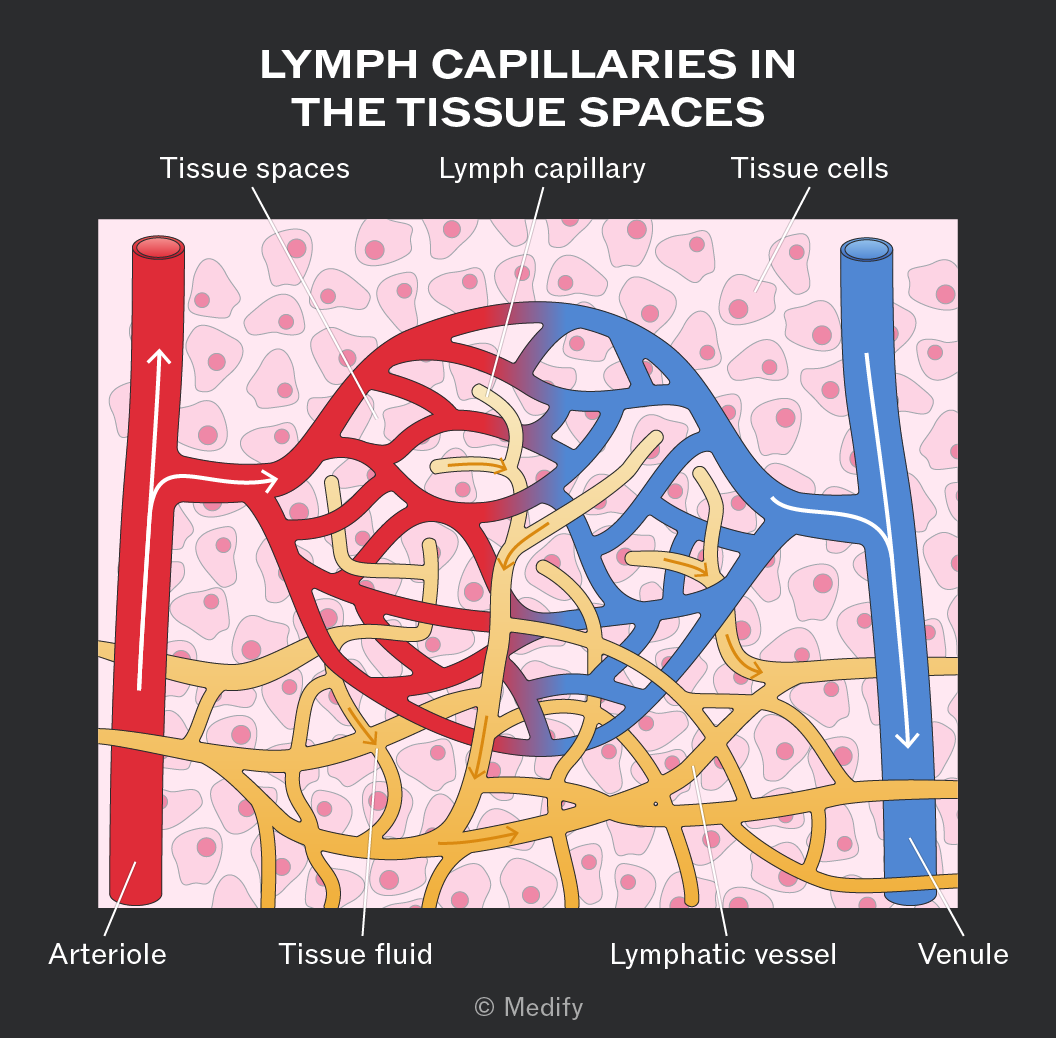
The tissue fluid that does not return to capillaries (10) drains into lymph vessels and forms lymph. The lymph vessels are like blind-ended capillaries with one-way valves and form a network over the whole body, merging with larger vessels.
Lymph is similar to plasma and tissue fluid but contains less oxygen and nutrients (which have been exchanged with tissues) and more fatty acids absorbed from the small intestine.
The lymphatic system joins the bloodstream again via ducts near the heart. Fluid is moved around the vessels by hydrostatic pressure and contraction of skeletal muscles.
The mammalian heart is a muscular organ made of two pumps and is situated in the thoracic cavity.
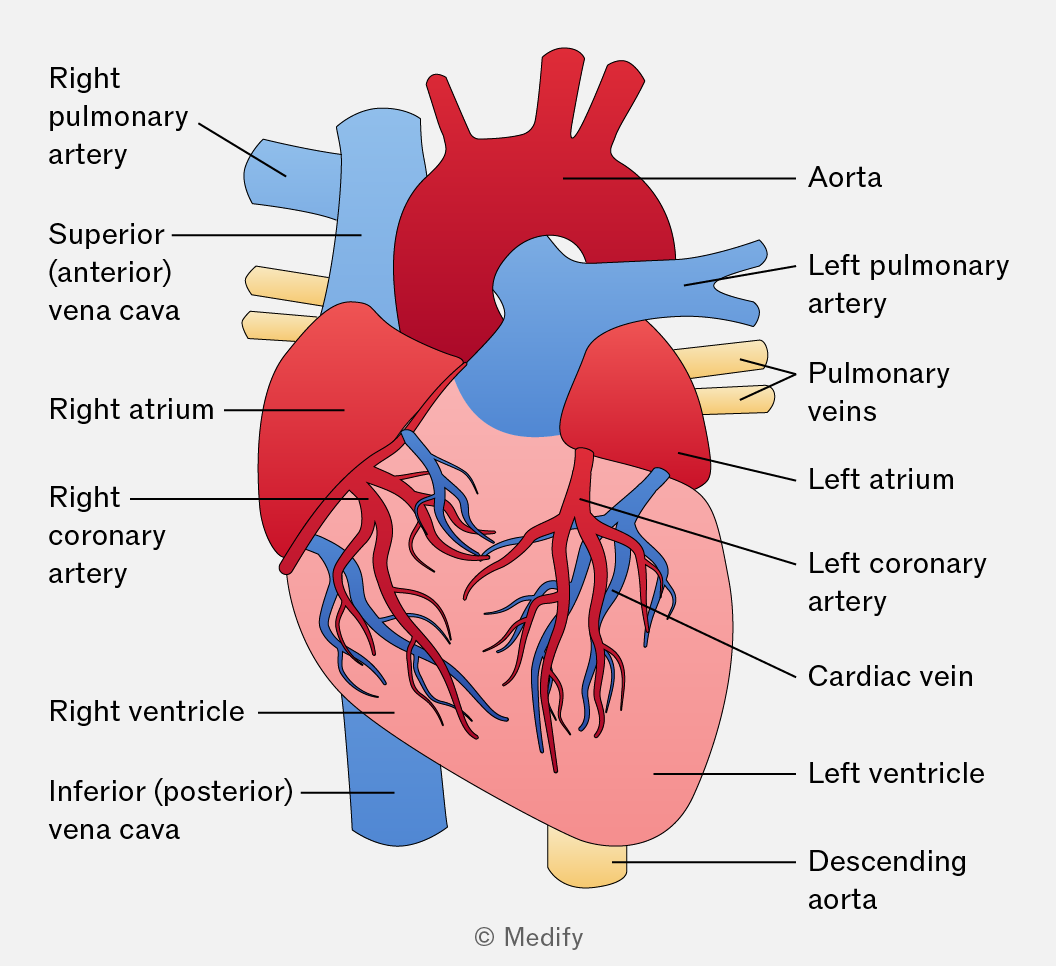
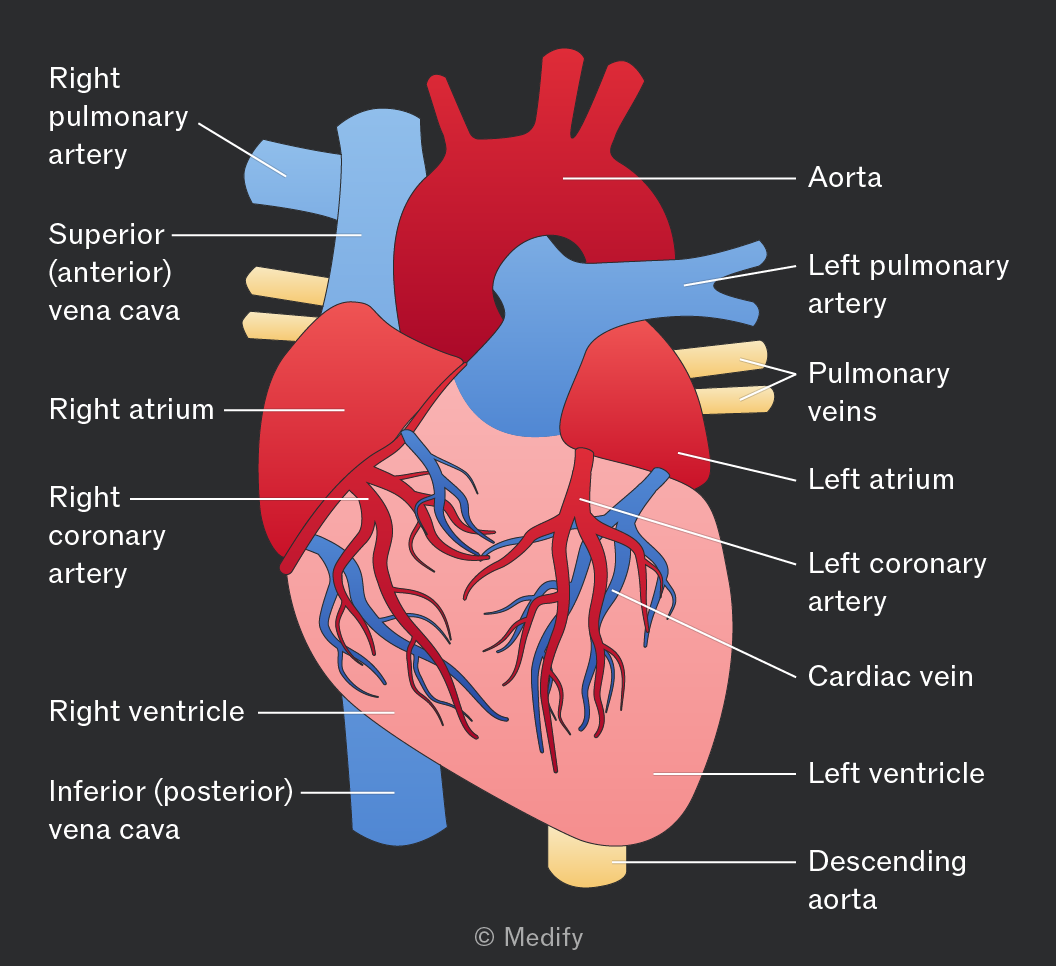
The aorta distributes oxygenated blood from the left ventricle to the rest of the body.
The vena cava are veins that carry deoxygenated blood from the head and the rest of the body back to the heart via the right atrium.
In almost all cases, veins bring deoxygenated blood back to the heart and arteries take oxygenated blood away from the heart.
One exception is the vessels taking blood between the heart and lungs:
- The pulmonary vein brings oxygenated blood from the lungs to the left atrium.
- The pulmonary artery delivers deoxygenated blood from the right ventricle to the lungs.
The renal artery supplies the kidneys with oxygenated blood from the aorta.
The renal vein delivers deoxygenated blood from the kidneys to the right side of the heart via the inferior vena cava.
The coronary arteries are located on the surface of the heart and supply blood to the heart muscle.
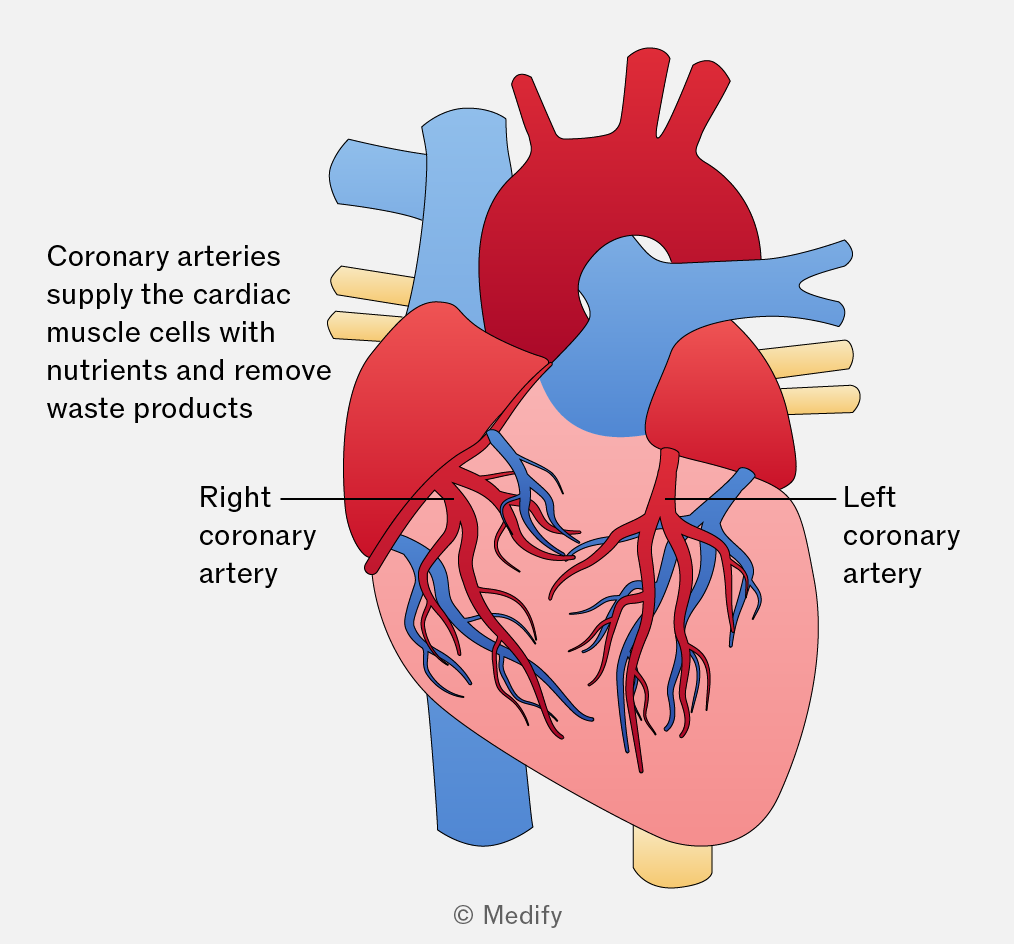
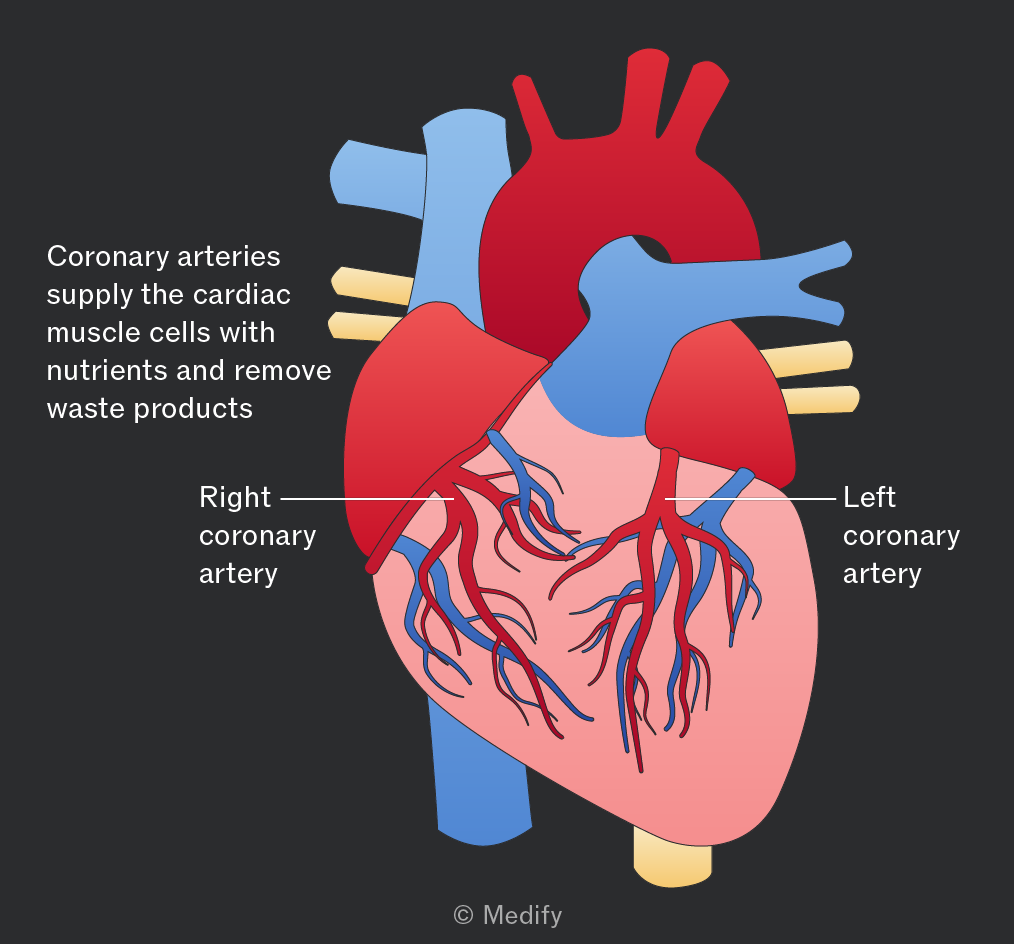
The mammalian heart consists of four chambers:
- Blood enters the heart via the atria (upper two chambers) as it returns from the body (right atrium) and the lungs (left atrium).
- The lower two chambers are the ventricles, which pump blood to the lungs (right ventricle) and to the rest of the body (left ventricle).
- The septum is a muscular wall that divides the heart into the left and right sides. This separation prevents the mixing of oxygenated (left side) and deoxygenated blood (right side).
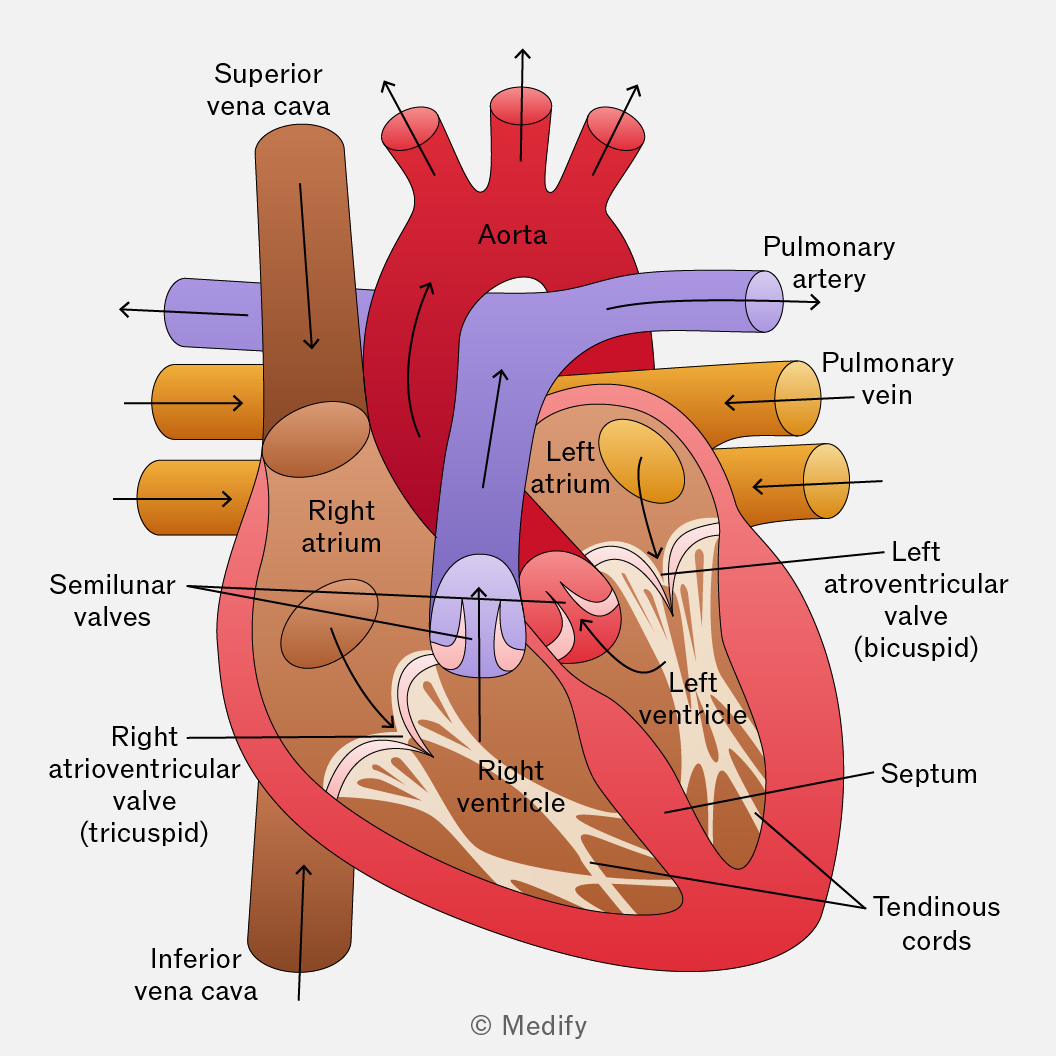
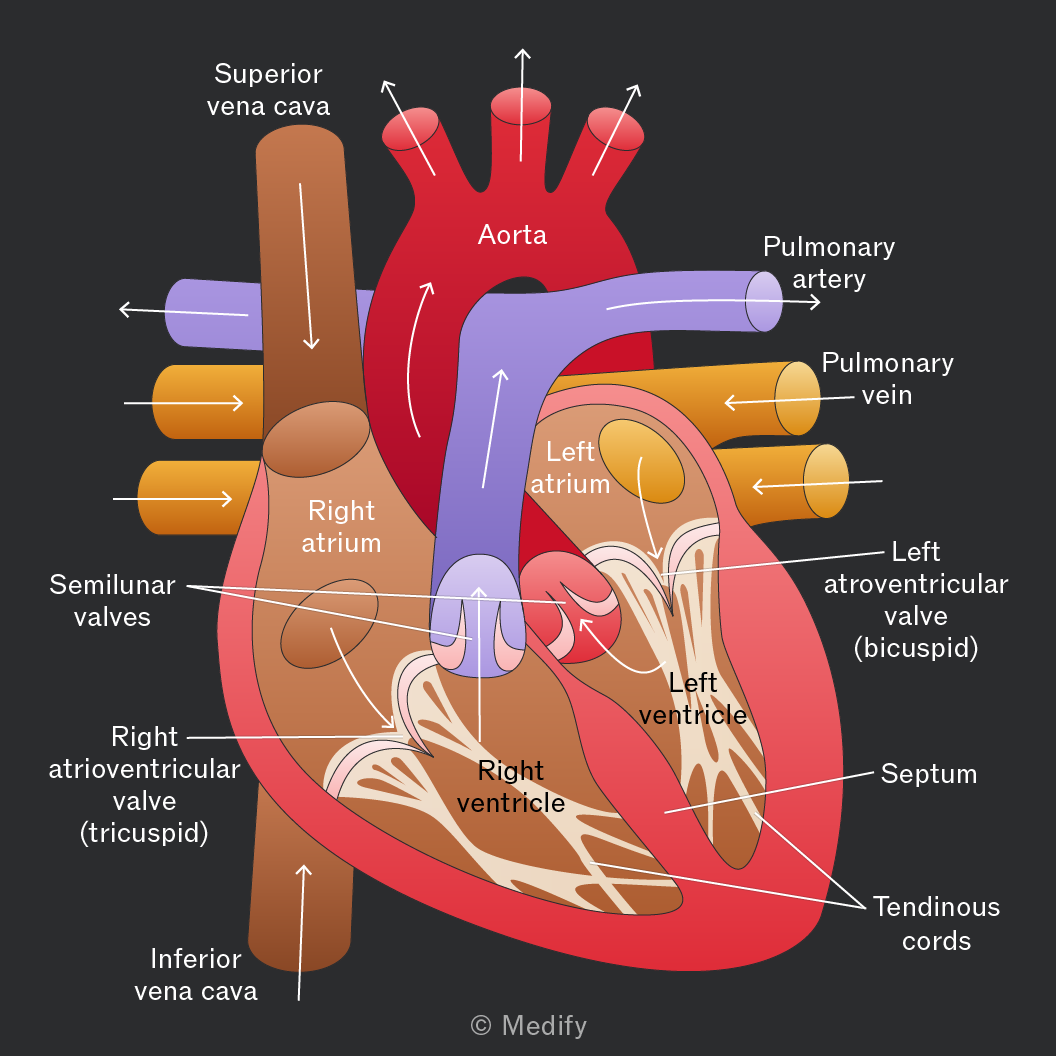
Heart valves regulate blood flow and maintain pressure within the chambers. They ensure blood travels in the correct direction, avoiding backflow.
The pressure from blood flowing into the atria opens the atrioventricular valves. When the atria and ventricles are full, the atria contract, forcing blood down into the ventricles.
The contraction of the ventricles causes the atrioventricular valves to close, preventing backflow of blood into the atria. Blood is forced out of the ventricles through the semilunar valves in the aorta and pulmonary artery. These valves prevent blood from flowing back into the heart.
Cardiovascular disease refers to disorders which affect the heart and blood vessels. This includes:
- Coronary heart disease and heart attacks – reduced blood flow to the heart muscle.
- Stroke – disruption of blood supply to the brain.
There are many independent risk factors that contribute to an individual’s risk of suffering from cardiovascular disease. When combined, these risk factors are more than additive. They include:
- Smoking.
- High blood pressure – this could be genetic or determined by lifestyle factors.
- High blood cholesterol – specifically low-density lipoproteins.
- Diet – high in salt and saturated fats.
The cardiac cycle is the sequence of events that occurs within one complete heartbeat:
- Atrial systole – the atria contract
- Ventricular systole – the ventricles contract
- Cardiac diastole – the heart relaxes
In diastole, the heart is relaxed as it fills with blood.
As the atria fill with blood, the pressure exceeds that in the ventricles and the atrioventricular valves open so that blood fills the ventricles.
The pressure in the relaxed ventricles is lower than in the aorta and pulmonary artery, causing the semilunar valves to close.
During atrial systole, the atria contract to force all the blood into the relaxed ventricles.
During ventricular systole, the thick ventricle walls contract and the pressure in the ventricles increases above that in the aorta and pulmonary artery. This closes the atrioventricular valves and blood is pumped to the lungs (right side) and the rest of the body (left side).
The pressure in the heart is low after ventricular systole but at a maximum in the arteries.
Cardiac output is the volume of blood pumped per minute.
Where:
Stroke volume = the volume of blood pumped from the left ventricle in a single beat
Heart rate = the number of beats per minute
Units of cardiac output are volume per unit time (e.g. ).
Oxygen is primarily transported in the body by binding to haemoglobin, a protein found in red blood cells (erythrocytes).
Haemoglobin is a protein with quaternary structure composed of four polypeptide chains each containing a haem prosthetic group.
Each haem group contains an iron () ion that can bind one molecule of oxygen, allowing a single haemoglobin molecule to carry up to four oxygen molecules (eight oxygen atoms).
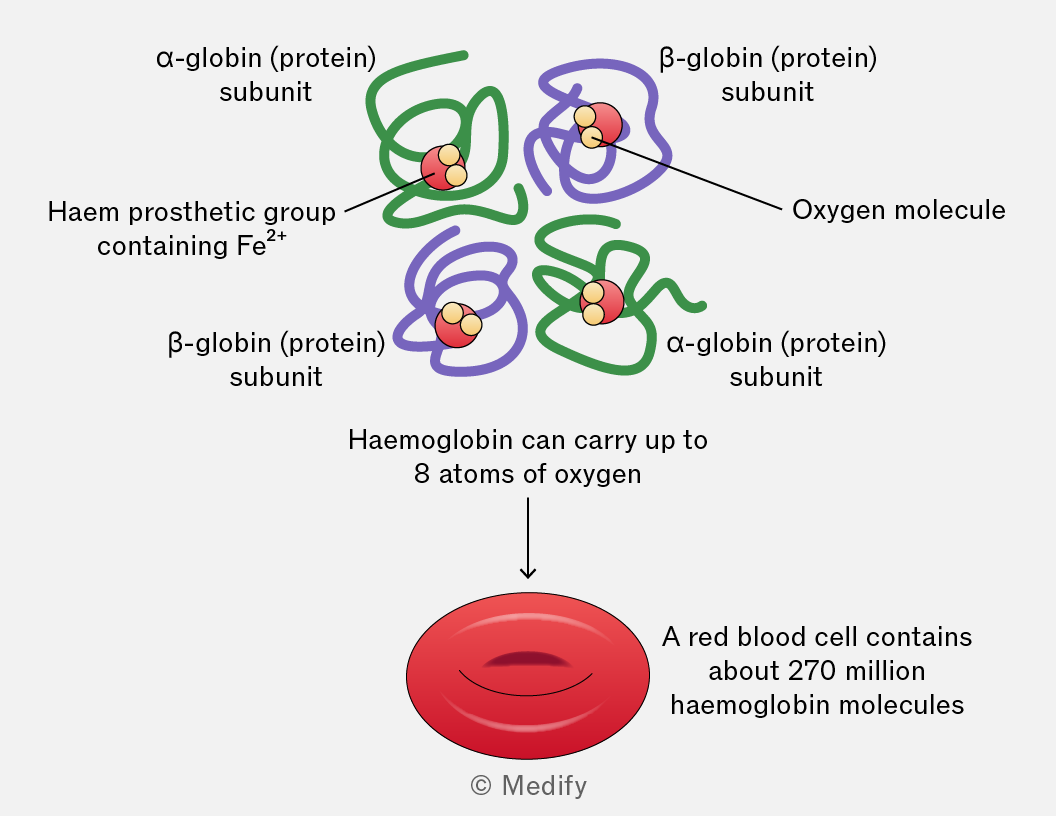
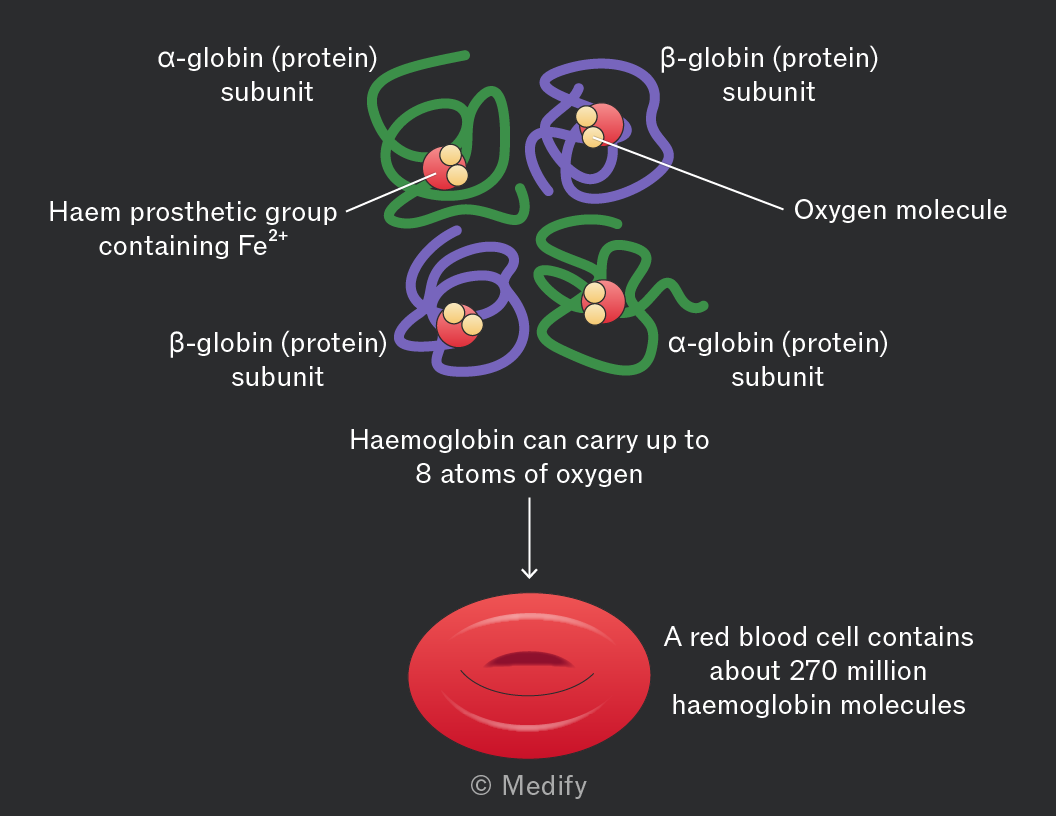
The haem group is structurally the same across all haemoglobin types but globin chains can vary significantly between species and between developmental stages (e.g., fetal vs adult).
Variations in globin polypeptides are crucial for defining the specific properties of haemoglobin, including its affinity for oxygen and its rate of oxygen uptake and release under different physiological conditions.
When oxygen binds to haemoglobin, it forms oxyhaemoglobin. The reaction can be represented as:
The binding of the first oxygen molecule induces a conformational change in the haemoglobin structure, increasing its affinity for oxygen and making it easier for subsequent oxygen molecules to bind.
The transition from a low-affinity to a high-affinity state is known as cooperative binding or positive cooperativity.
The reverse occurs when oxygen dissociates in tissues, shifting haemoglobin back to the low-affinity state, which promotes further oxygen release where it’s needed, e.g., where the partial pressure of oxygen is low.
The oxygen dissociation curve shows the relationship between:
- Partial pressure of oxygen (), which refers to the pressure exerted by oxygen in a mixture of gases.
- Haemoglobin saturation, which refers to the percentage of haemoglobin’s four oxygen-binding sites that are occupied. When all four sites are bound to oxygen, haemoglobin is fully saturated.
The shape of the curve reflects haemoglobin’s changing affinity for oxygen: as each oxygen molecule binds, it becomes easier for the next to bind, producing the characteristic S-shaped sigmoid curve.
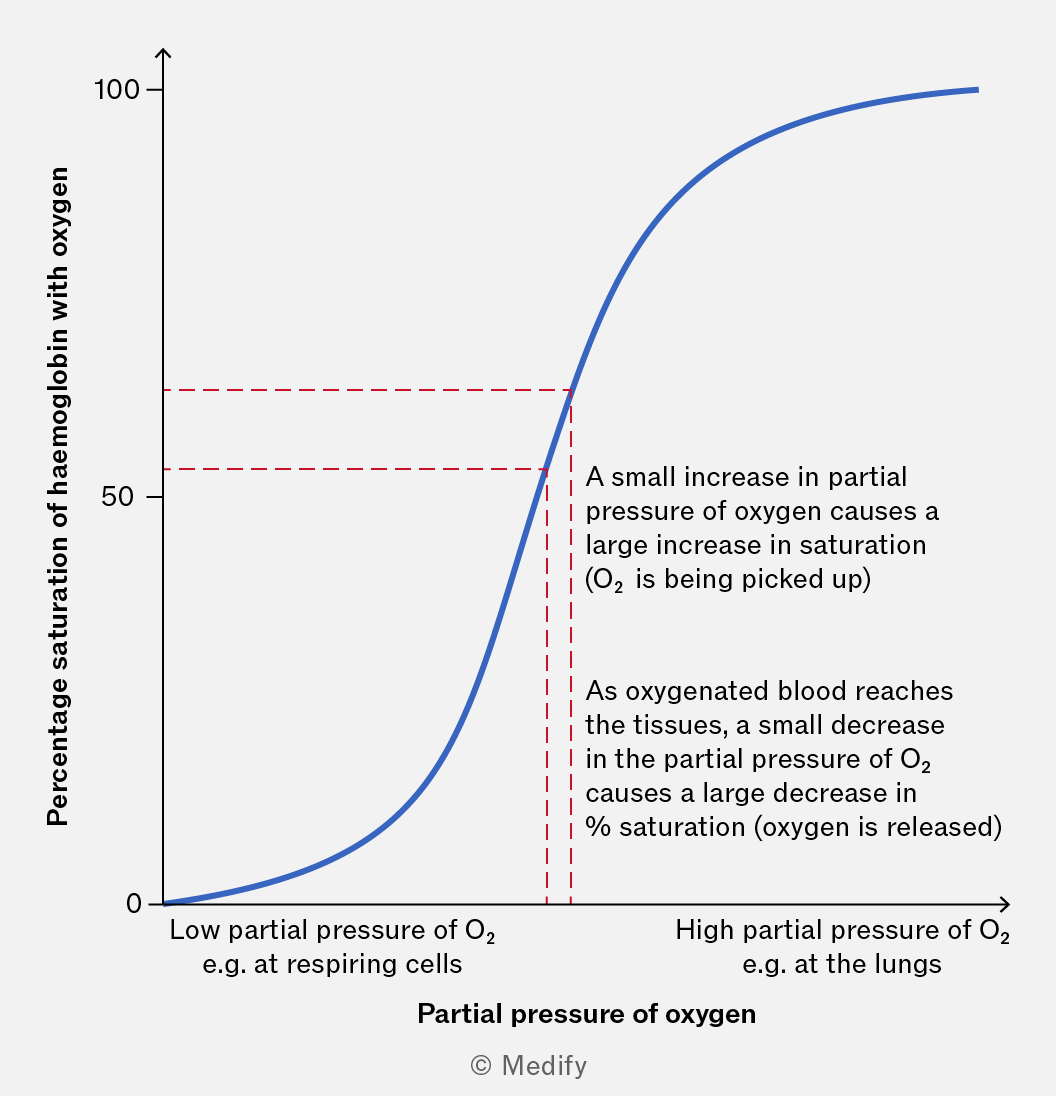
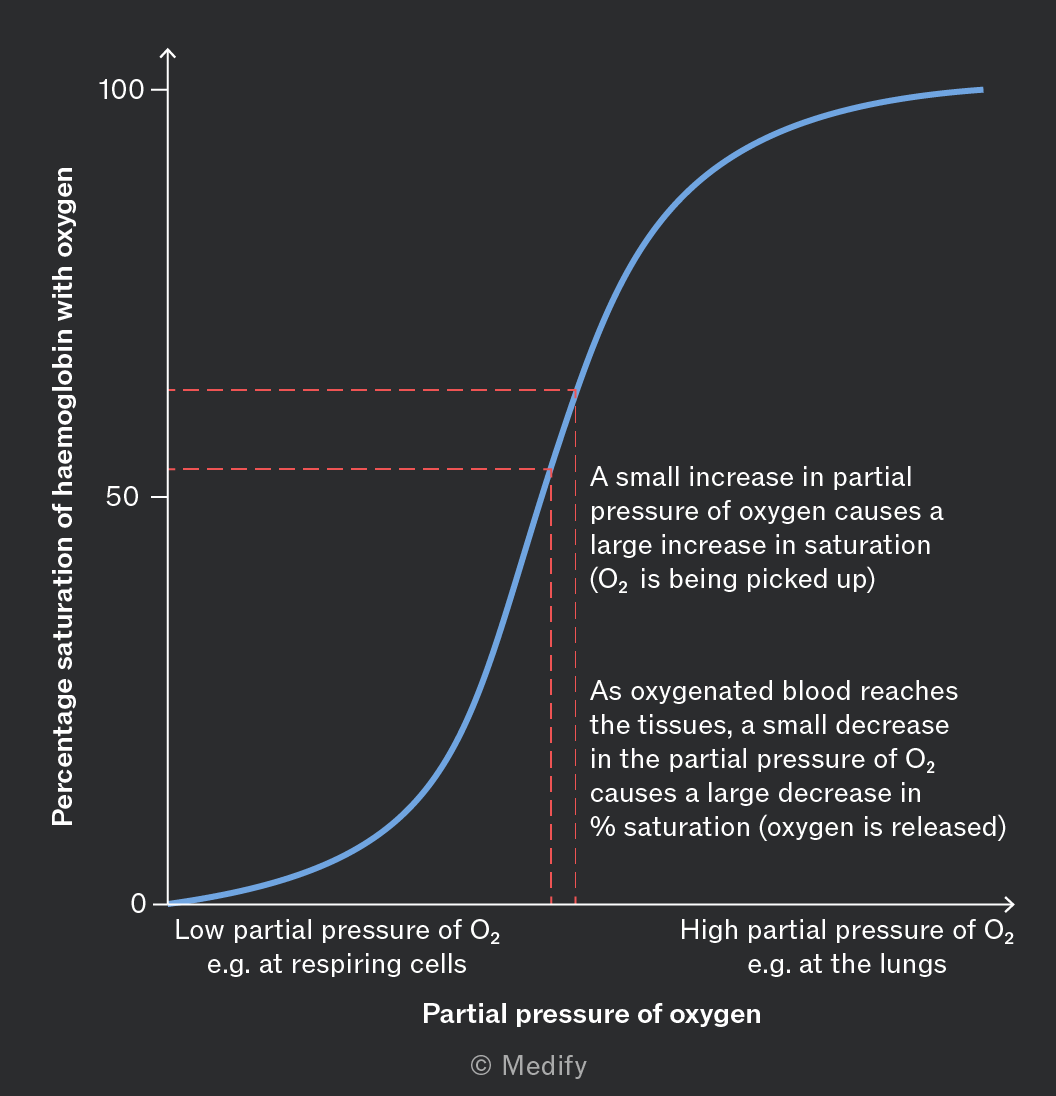
Initial slow binding: At low the first oxygen molecule binds slowly because haemoglobin is predominantly in a low–affinity state, resulting in a shallow gradient at the bottom left of the curve.
Cooperative binding: Once the first oxygen binds, haemoglobin undergoes a conformational change, increasing its affinity for subsequent oxygen molecules. Saturation increases rapidly relative to causing a steep gradient in the curve.
Approaching saturation: As haemoglobin becomes nearly fully saturated, fewer binding sites remain available, so additional oxygen molecules bind more slowly, resulting in the curve levelling off at the top right.
The Bohr effect describes how haemoglobin’s oxygen affinity decreases in response to high levels and low
In respiring tissues, diffuses into red blood cells, where the enzyme carbonic anhydrase catalyses its reaction with water to form carbonic acid (). This rapidly dissociates into and hydrogencarbonate ions (). The increased concentration lowers the causing haemoglobin to change shape and reduce its affinity for oxygen.
The Bohr effect shifts the oxygen dissociation curve to the right, meaning haemoglobin releases more oxygen at a given
Different species possess different types of haemoglobin, adapted to their environments.
Animals living in low–oxygen environments, such as at high altitude, tend to have haemoglobin with a higher affinity for oxygen (dissociation curve shifted to the left), allowing them to load oxygen more effectively when less is available.
Animals with high metabolic demands tend to have haemoglobin with a lower affinity for oxygen (curve shifted to the right), allowing oxygen to be released more readily to respiring tissues.