
Mass transport in plants (3.3.4.2)
On this page
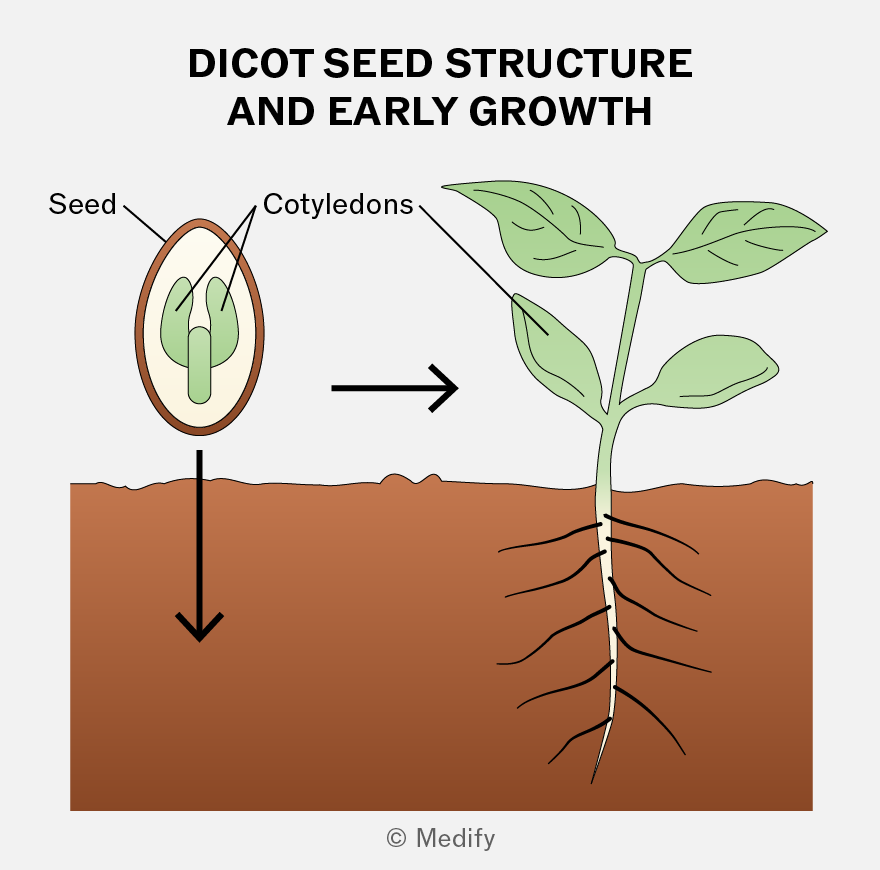
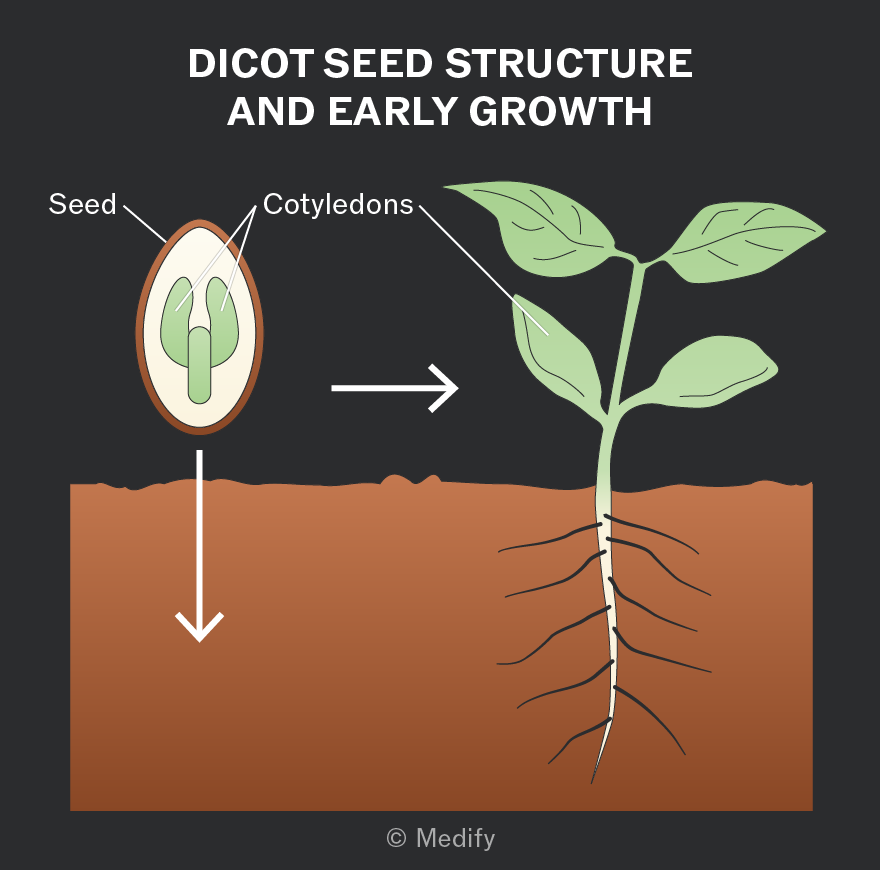
Dicotyledonous plants (dicots) produce seeds with two cotyledons (‘seed leaves’), which store food for the developing embryo and form the first leaves.
Dicots have a vascular system of xylem and phloem running through their stems, roots, and leaves. These transport tissues are arranged in vascular bundles.
Xylem vessels:
- transport water and mineral ions from roots to leaves through the stem (one-way flow) via the transpiration stream
- provide mechanical support to the plant.
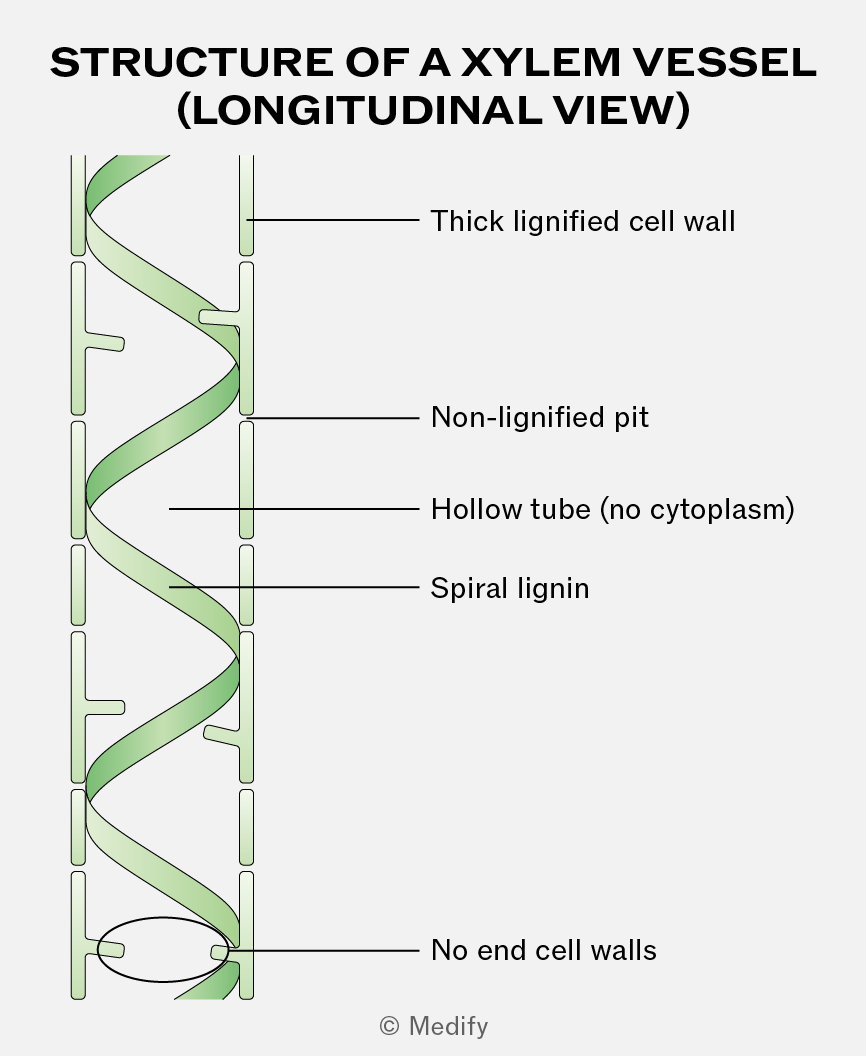
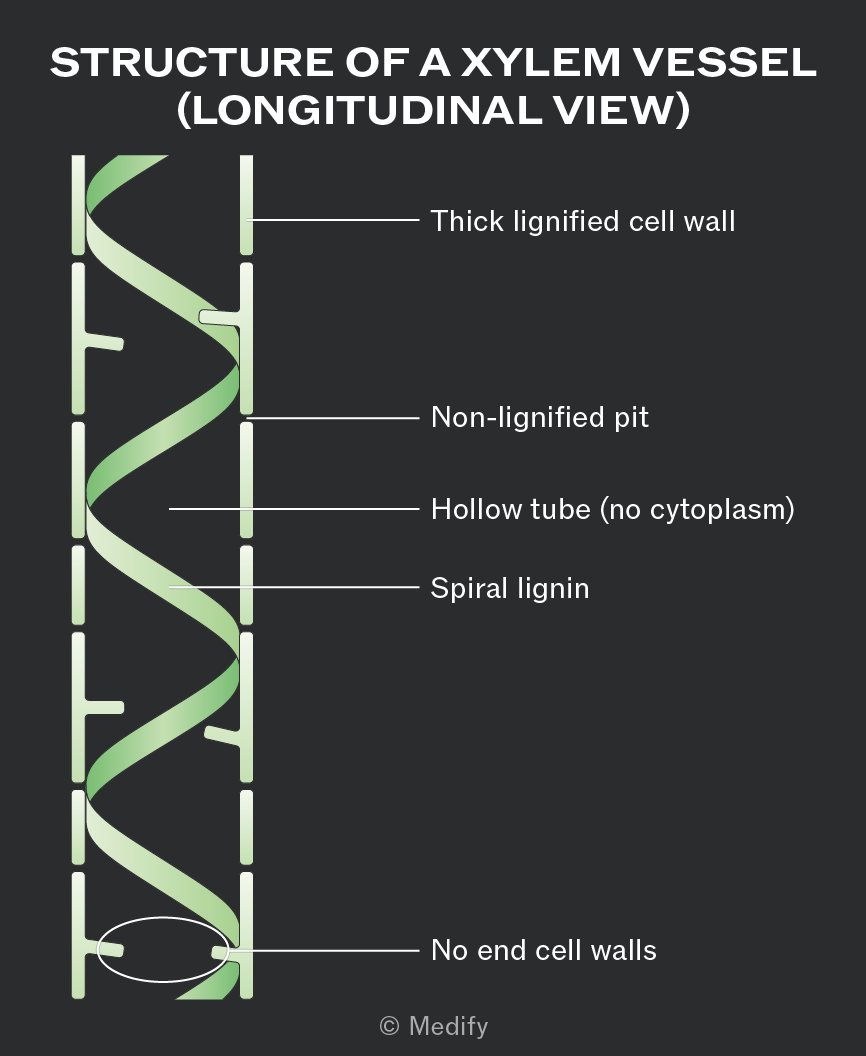
Xylem is a tissue made of cells joined end to end with no end walls between them. This creates a long, hollow tube structure, which allows continuous and uninterrupted transport of water.
Xylem vessel walls are impregnated with spirals of lignin around the lumen of the vessel. The spiral pattern provides flexibility, while the lignin provides support and extra mechanical strength, preventing the vessels from collapsing inwards under the tension created during water transport.
Stomata are pores mainly on the underside of leaves that allow carbon dioxide to enter and oxygen to leave the plant.
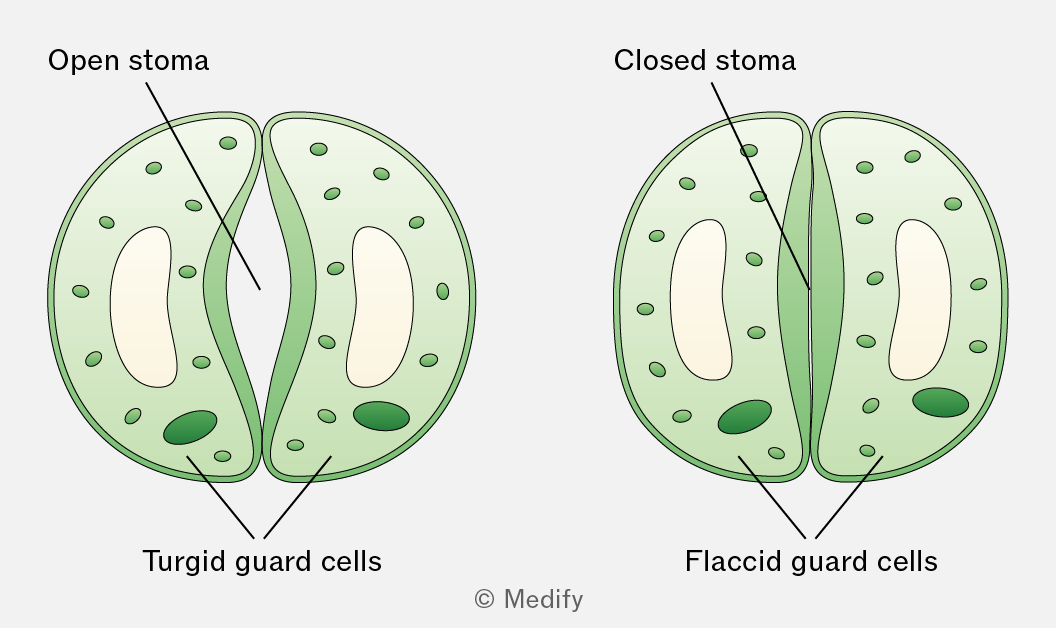
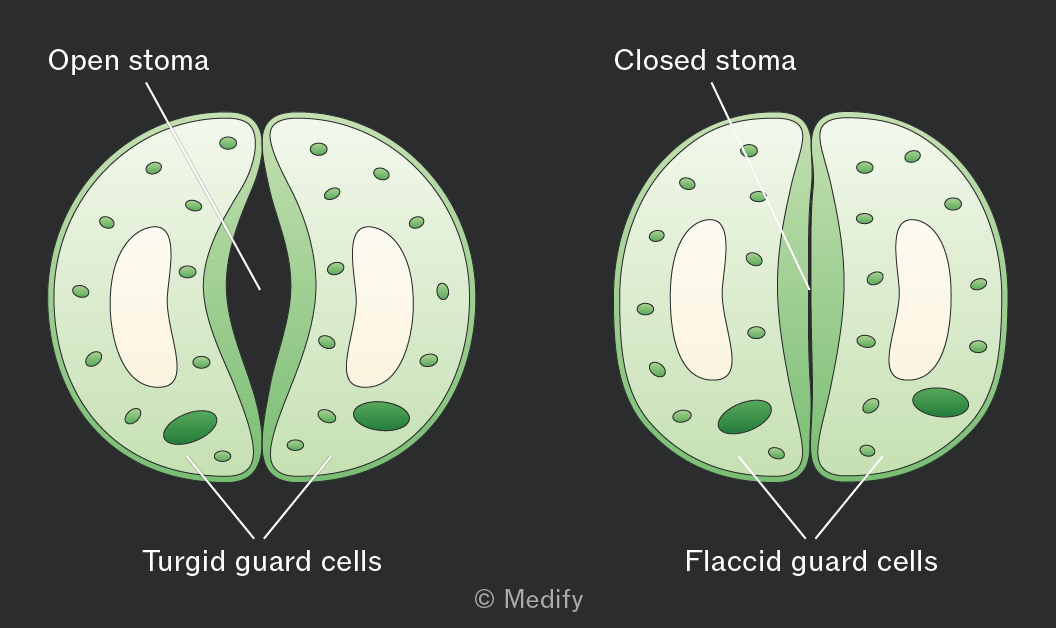
Each stomatal pore is surrounded by kidney-shaped guard cells with a thicker inner wall and thinner outer wall.
When guard cells take in water and become turgid, they swell and bend, opening the stomata. This happens during the day when photosynthesis occurs in the presence of sunlight.
When guard cells lose water and become flaccid, the stomata close. This happens at night when photosynthesis cannot occur.
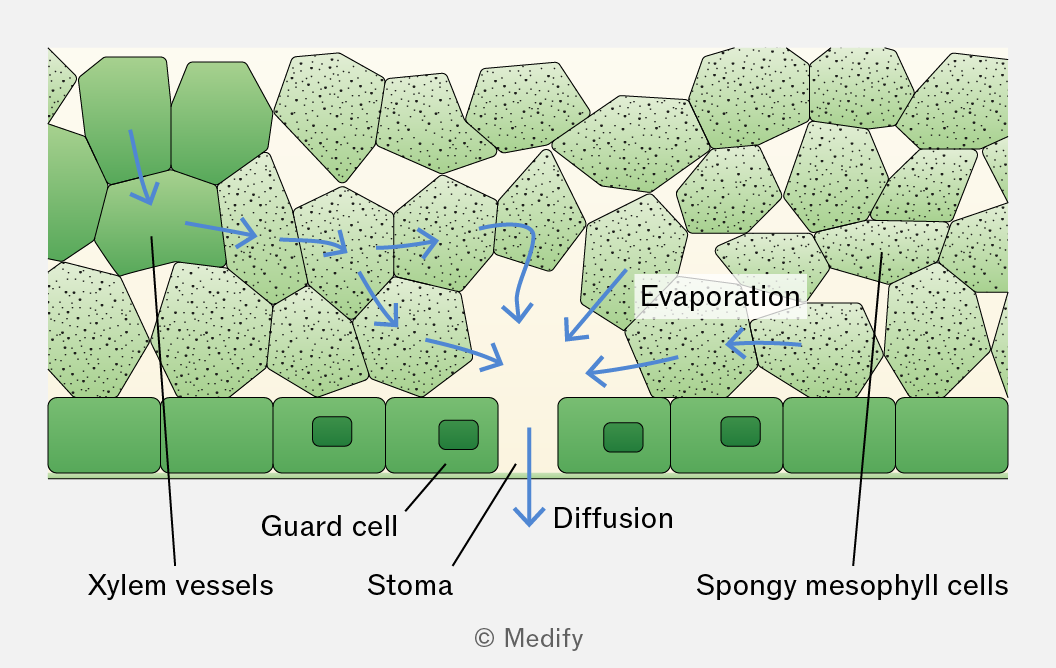
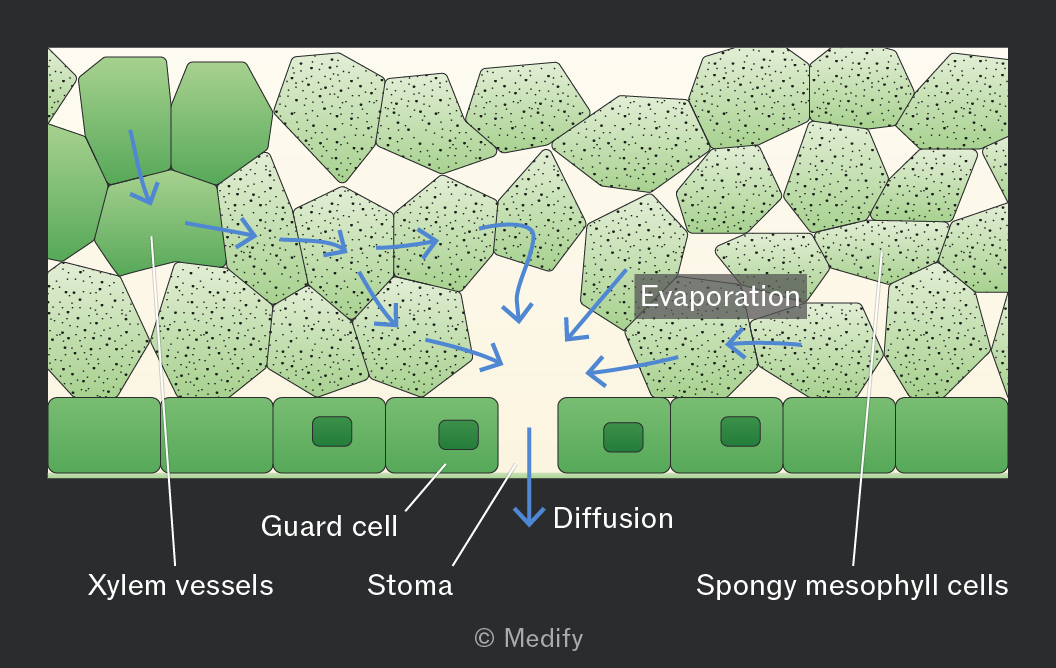
Transpiration is the loss of water vapour from a plant by evaporation from the leaf and diffusion into the atmosphere through the stomata.
It occurs as a consequence of gas exchange through the stomata.
Water evaporates from the surfaces of the spongy mesophyll cells into the air spaces within the leaf and then diffuses out of the leaf through the open stomata down a water vapour potential gradient.
The transpiration stream is the movement of water from the roots to the leaves through the xylem in the stem. This process is explained by the cohesion–tension theory.
In the cohesion–tension theory, transpiration reduces the water potential in the mesophyll cells, causing water to move by osmosis from the xylem into these cells. This creates tension (negative pressure) in the xylem, causing water to move down a pressure gradient by mass flow from roots to leaves.
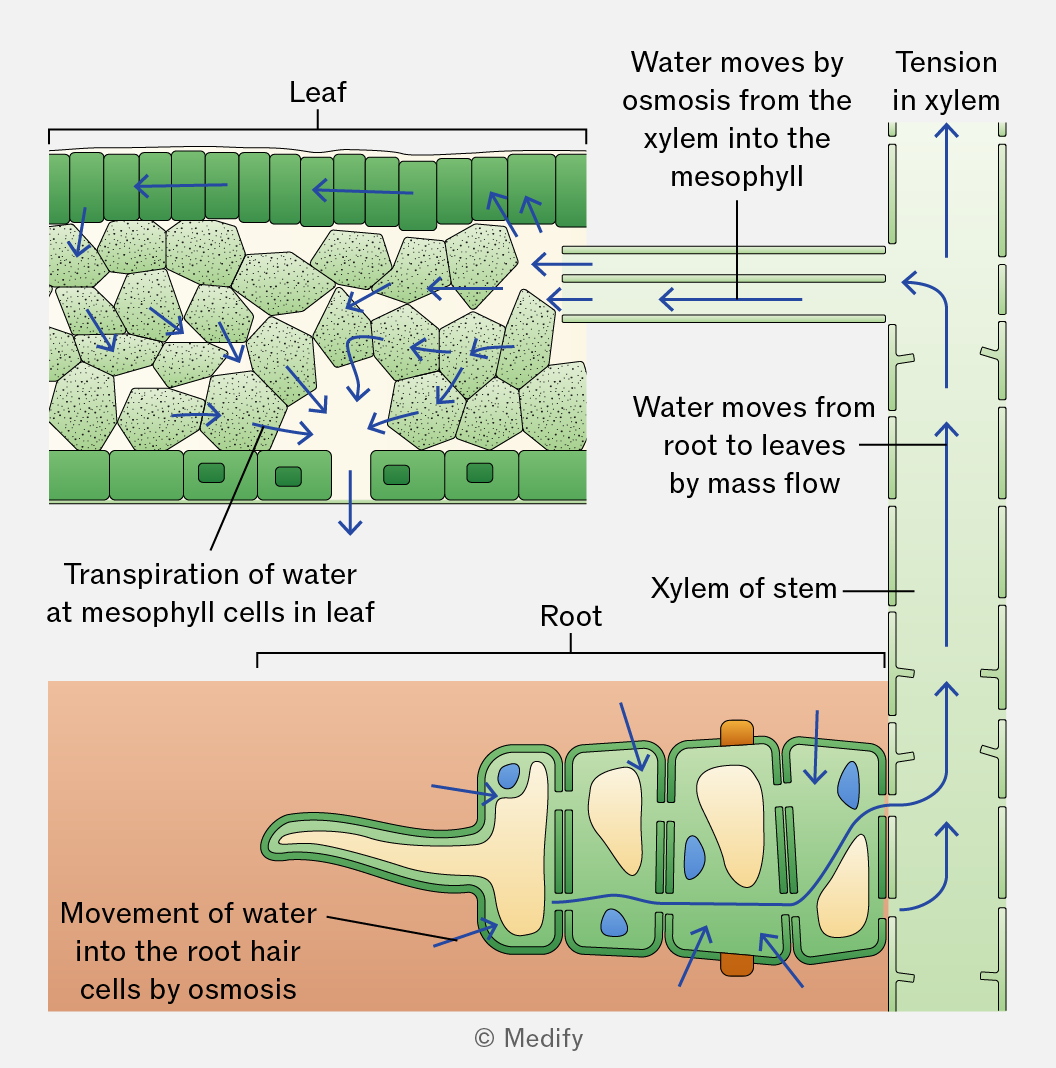
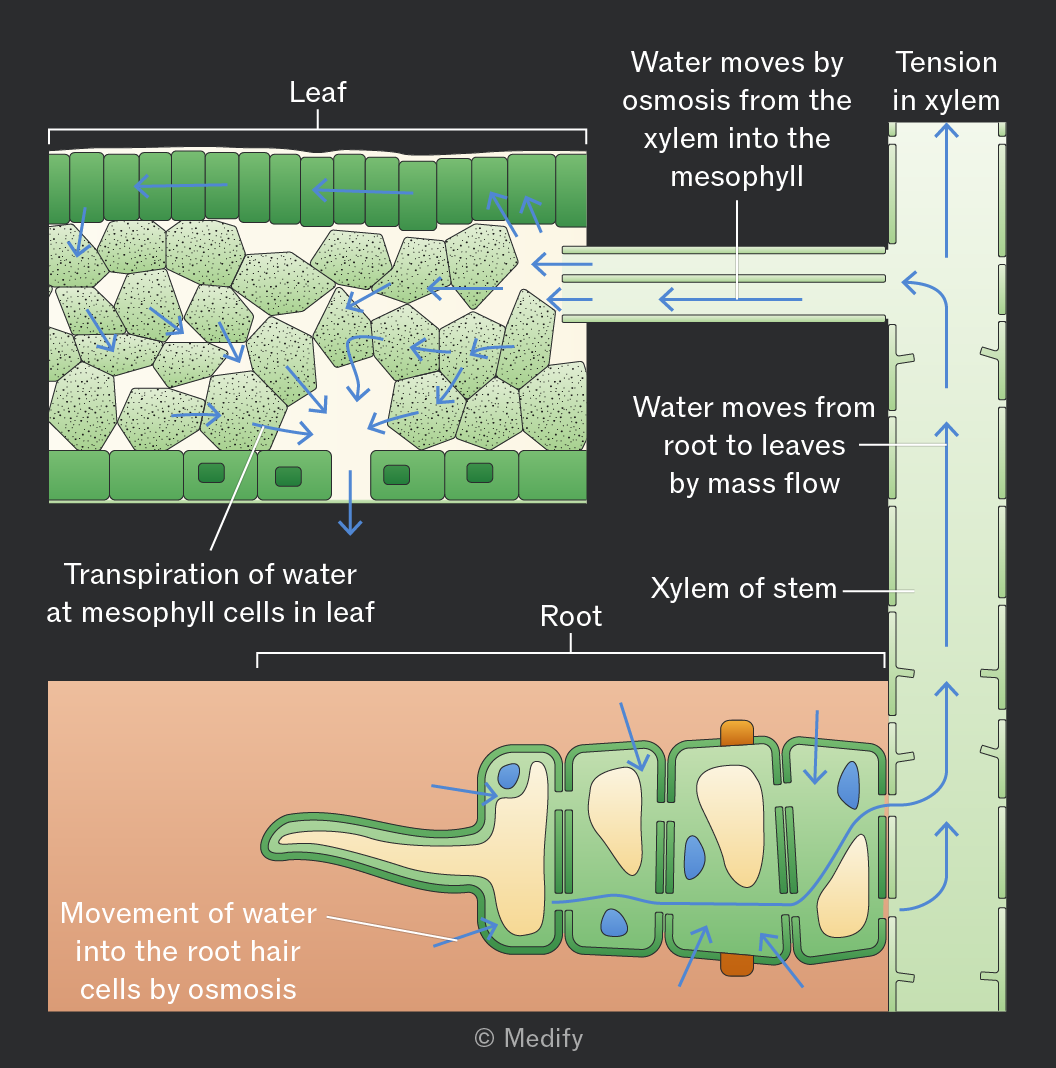
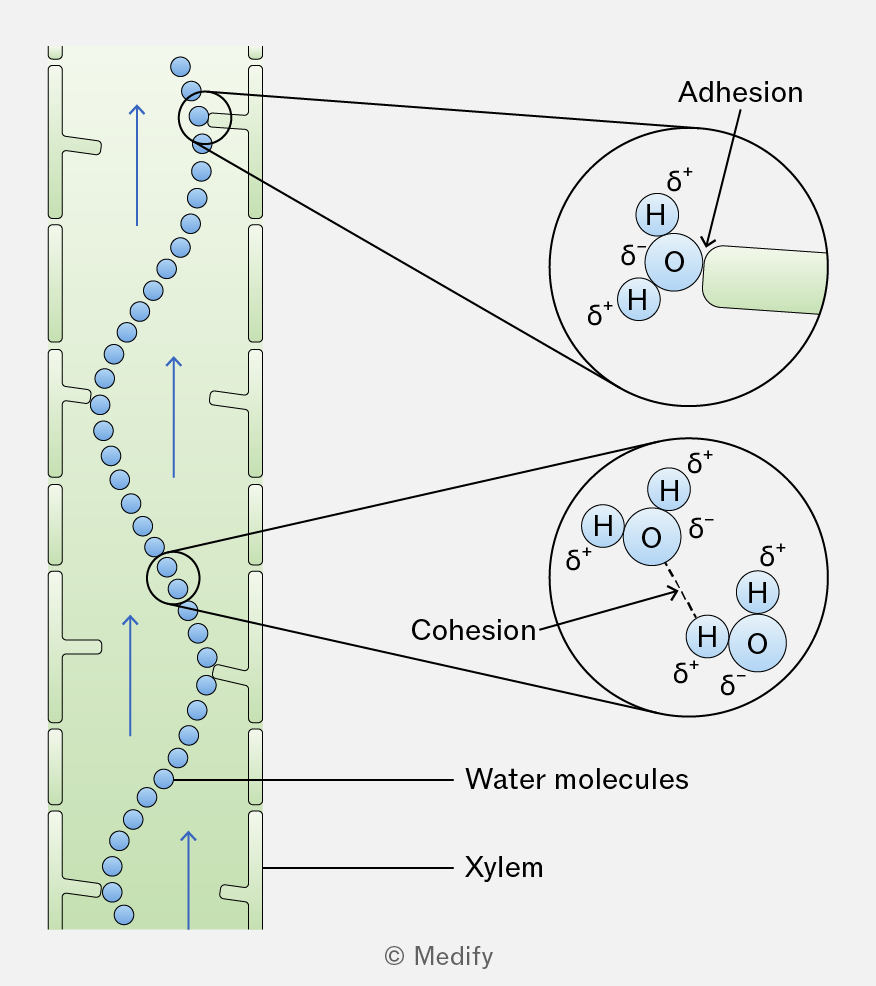
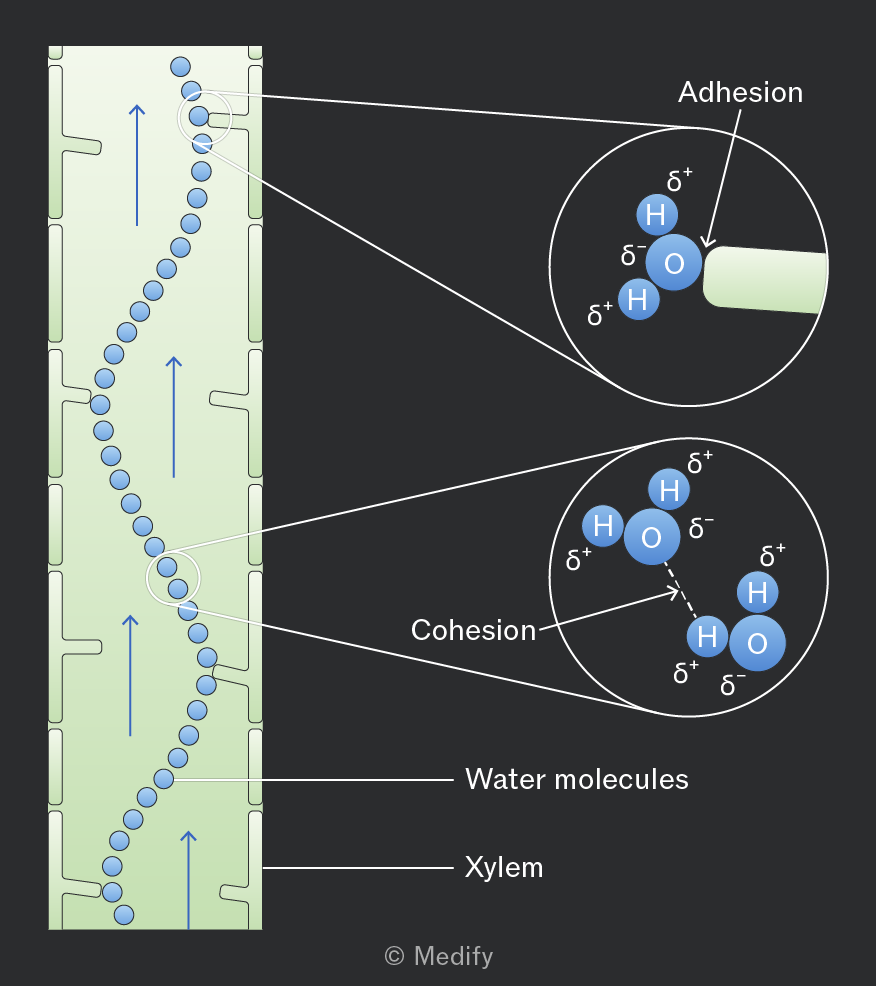
In the cohesion–tension theory, the cohesion between water molecules, forms a continuous column of water in the xylem, which is pulled upwards as a result of the tension created by transpiration.
Adhesion occurs between water molecules and the walls of the xylem vessels, helping the water column move up the vessel by capillary action and resist the effects of gravity.
Increased light intensity increases the rate of transpiration.
This is because light increases the rate of photosynthesis, causing stomata to open to allow carbon dioxide to enter the leaf for gas exchange.
When the stomata open, more water vapour can diffuse out of the leaf, increasing evaporation from the mesophyll cells and loss of water through the stomata.
Humidity is a measure of the amount of water vapour in the air.
Increased humidity decreases the rate of transpiration because it reduces the water vapour potential gradient between the inside of the leaf and the surrounding air.
Increased temperature increases the rate of transpiration by raising the kinetic energy of water molecules, increasing the rate of evaporation from the spongy mesophyll cells and the rate of diffusion of water vapour out of the stomata.
Increased air movement increases the rate of transpiration.
This is because water vapour around the stomata is blown away. This lowers the water vapour potential around the stomata, increasing the water vapour potential gradient between the air spaces in the leaf and the outside air. As a result, water vapour diffuses out of the leaf at a faster rate.
A potometer is an apparatus that measures a plant’s water uptake. It is assumed that water uptake is directly related to water loss by the leaves, and therefore, it can be used to measure the rate of transpiration.
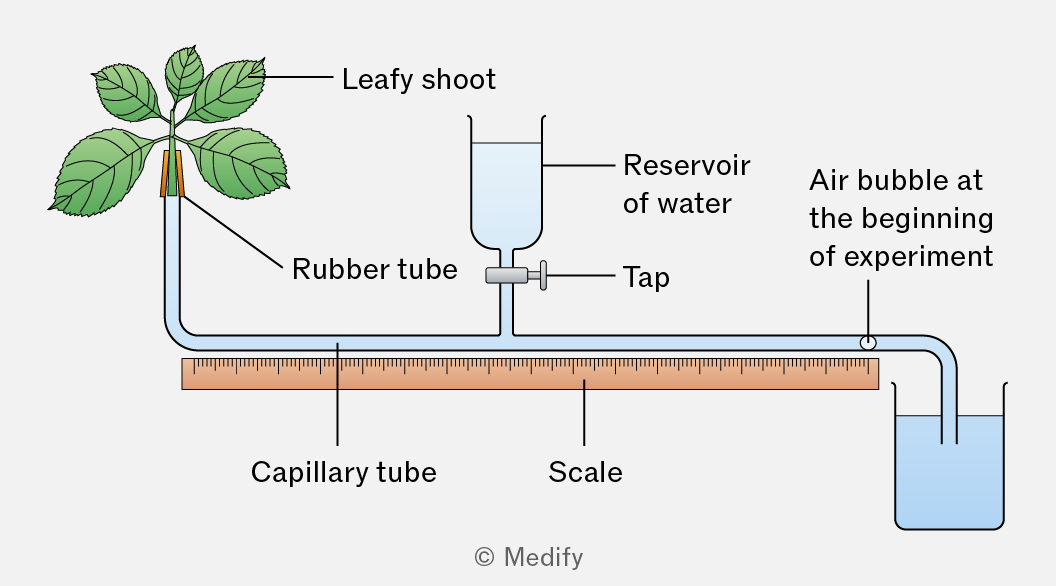
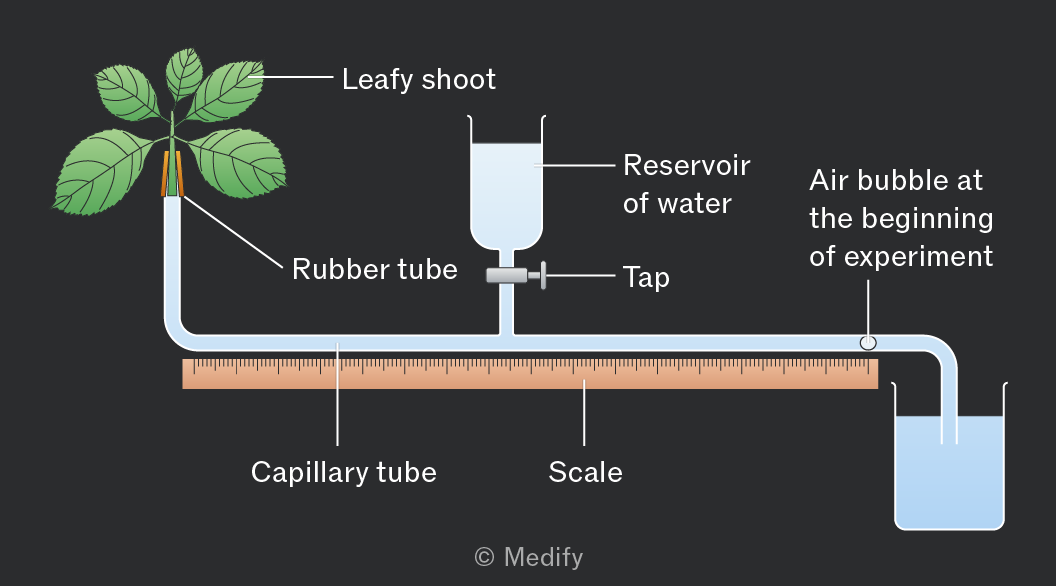
Potometers have limitations:
- Not all water uptake is lost in transpiration. Some water is used to maintain turgidity and support in cells and for photosynthesis.
- The rate of water movement through a shoot does not accurately reflect that in a whole plant, because plants have roots.
- The xylem vessels in a shoot are much narrower than the capillary tube in the apparatus.
To correctly set up a potometer:
- The stem should be cut, the apparatus assembled, and the stem inserted into the apparatus under water. All joints must be sealed so the potometer is airtight and watertight.
These precautions prevent air bubbles from entering the xylem, which could block the vessels and break the continuous column of water. The sealing of joints also reduces the loss of water vapour and prevents the entry of pathogens. - The stem should be cut at a slant / angle to increase the surface area for water uptake into the xylem.
- The leaves should be dried before readings are taken so that no excess water droplets are on the surface of the leaves.
- The water reservoir tap should remain closed during the investigation to prevent water from entering the capillary tube.
Precautions to take whilst using a potometer:
- Keep the open end of the apparatus in water so that no air bubbles are introduced.
- Keep the shoot still and supported to avoid breaking the seals of the potometer or the water column in the xylem.
- Do not allow the air bubble to move too far along the capillary tube. Use the tap or reservoir to move the bubble back to the starting position when repeating the investigation. This prevents the air bubble from entering the xylem and allows the same bubble to be reused for reliable measurements.
To use a potometer:
- Remove the end to form a single air bubble and note its starting position.
- Measure the distance the bubble travels over time.
- Repeat at least three times to identify anomalies, then calculate the mean distance moved by the air bubble.
Keep all other conditions constant: use the same plant species (ideally the same plant each time) and ensure the number and size of leaves remain the same, controlling for stomatal density and surface area.
To investigate factors affecting the rate of transpiration:
- Light intensity – change the distance from the light source or the power of the light.
- Humidity – cover leaves with a plastic bag and spray different volumes of water.
- Temperature – use a thermostat or air conditioning in a climate–controlled room.
- Air movement – place a fan at different distances or speeds from the plant.
Controlling variables: while testing one factor, ensure all other environmental conditions (light, temperature, humidity, air movement) remain constant.
To calculate the rate of transpiration using a potometer, you calculate the volume of water taken up by the plant per unit time.
The formula is below:
Where:
- = radius of the capillary tube
- = cross-sectional area of the capillary tube
- = distance travelled by the air bubble
- =time taken
Units are typically or depending on the measurements used.
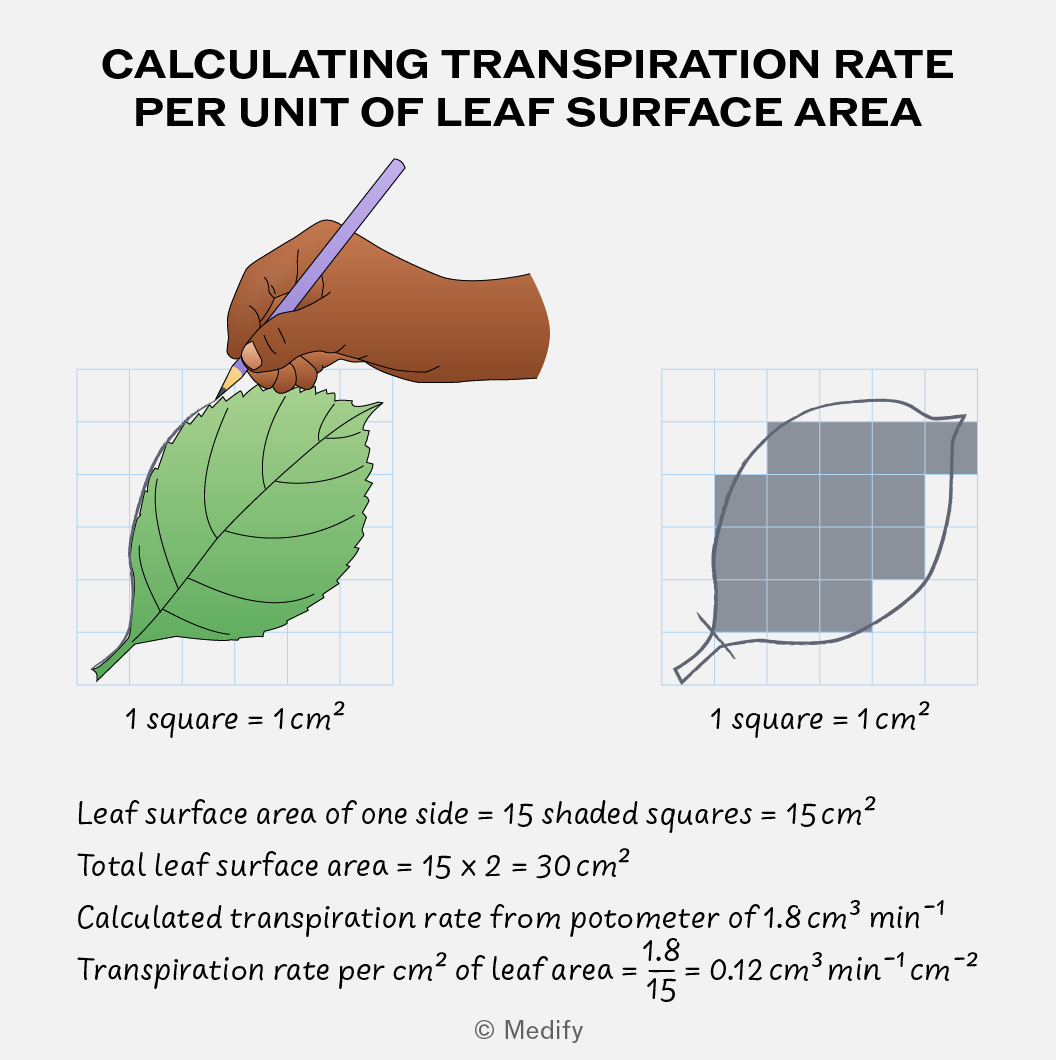
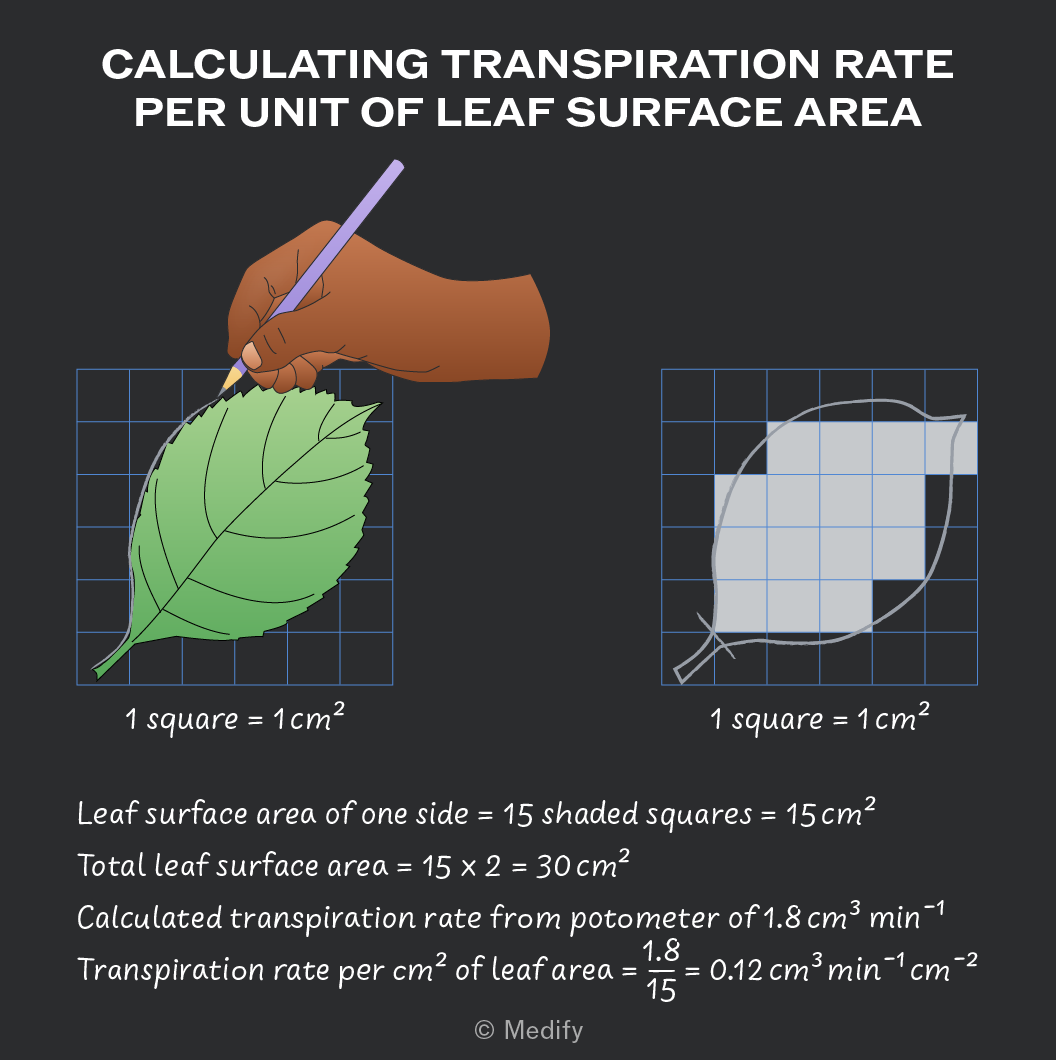
To estimate the rate of transpiration per of leaf surface area:
- Flatten the leaves onto graph paper and draw around the leaf.
- Count the number of squares covered by the leaf, including only squares that are more than 50 covered.
- Double the leaf area to account for both the upper and lower leaf surfaces.
- Divide your calculated transpiration rate by the leaf area to get the rate per .
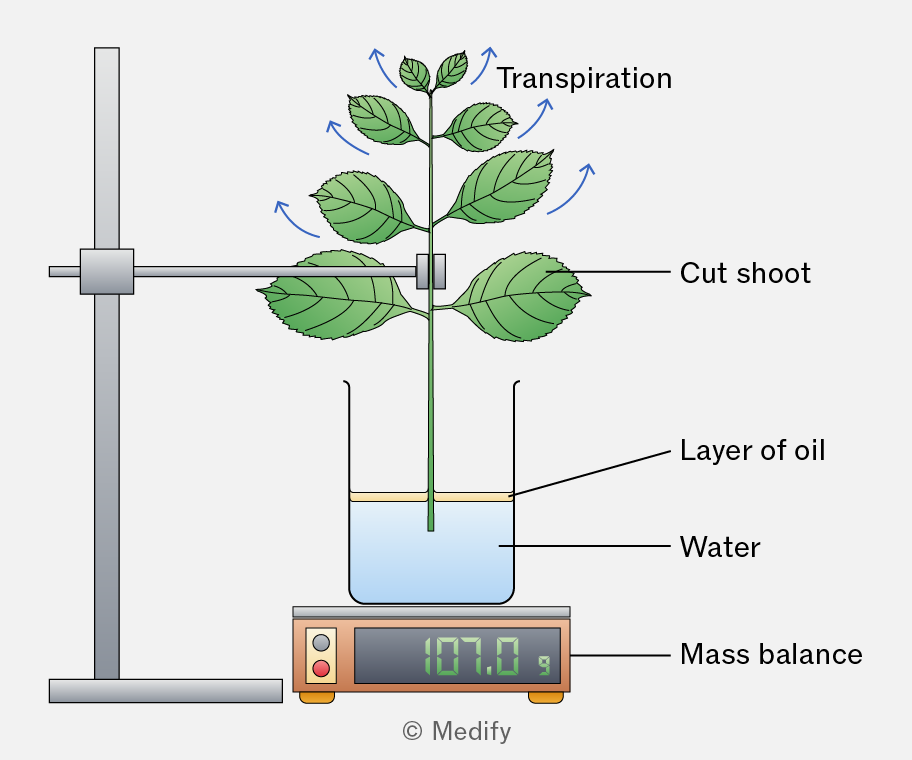
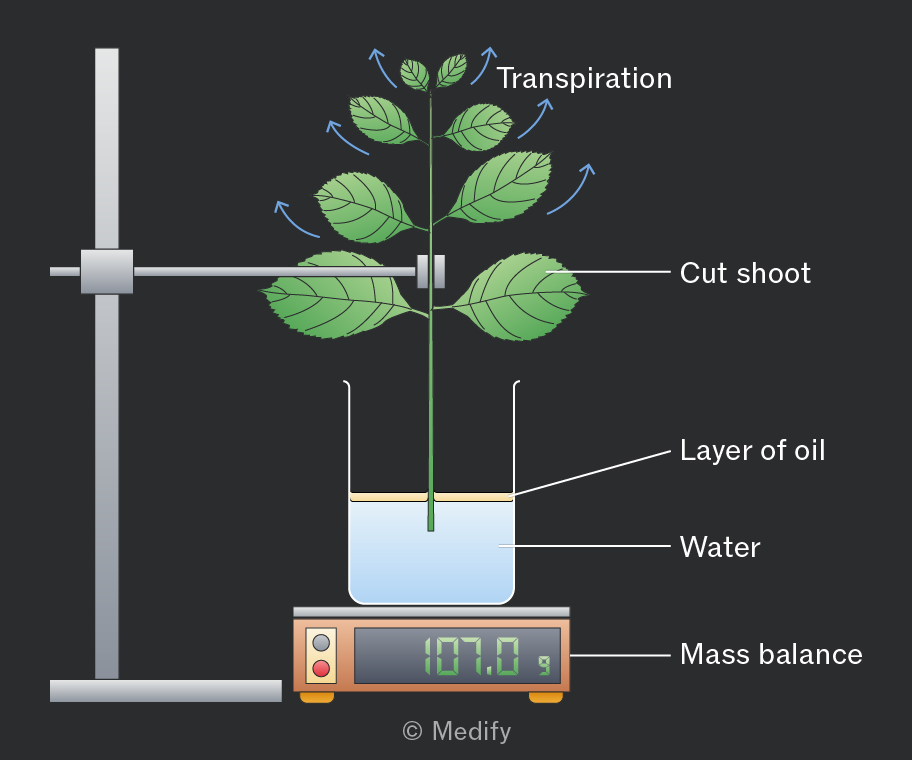
The rate of transpiration can be measured by recording the mass loss of a plant over time.
The plant is placed on a mass balance and weighed at regular intervals. As water evaporates from the leaves, the plant’s mass decreases, giving an estimate of the transpiration rate.
The function of the phloem is the movement of assimilates (such as sucrose, amino acids, hormones and salts), which are dissolved in water from source (site of production) to sink (site of usage). This process is called translocation and it requires energy.
Translocation is a two-way flow, moving assimilates both up and down the plant by the process of mass flow, down a pressure gradient.
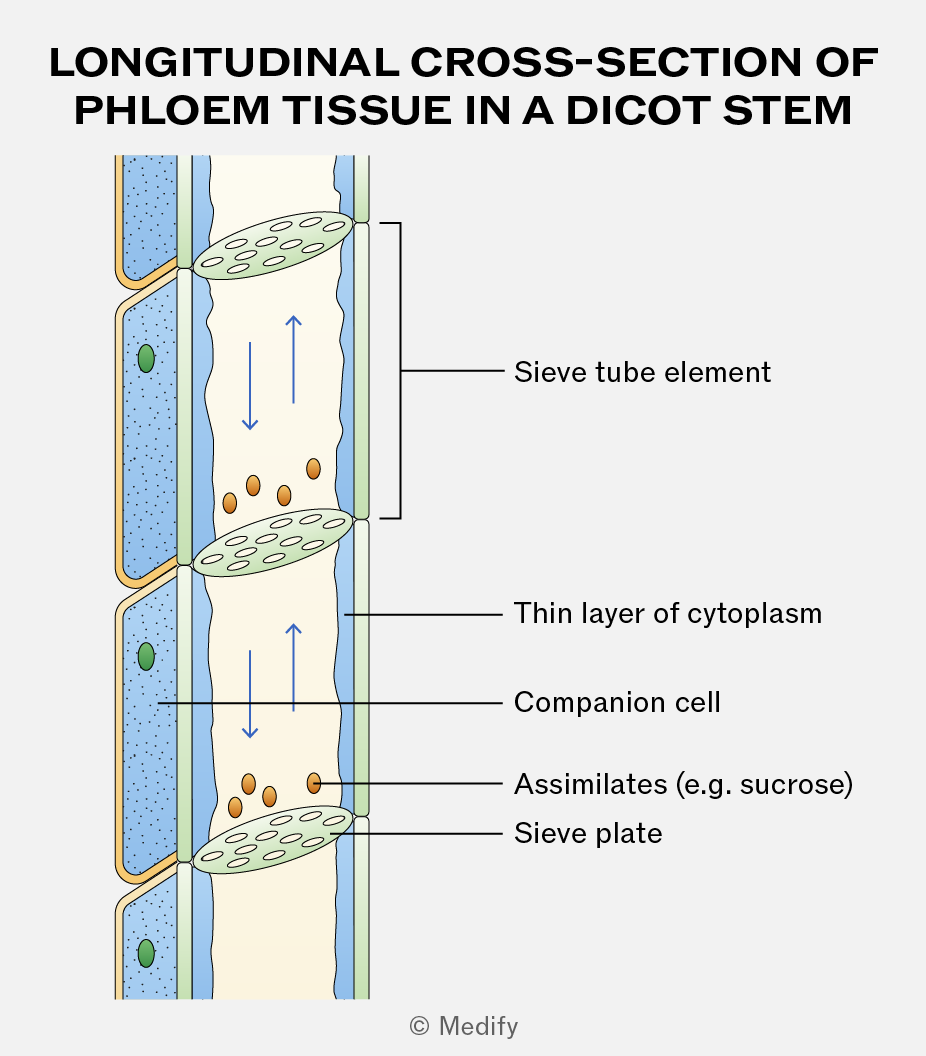
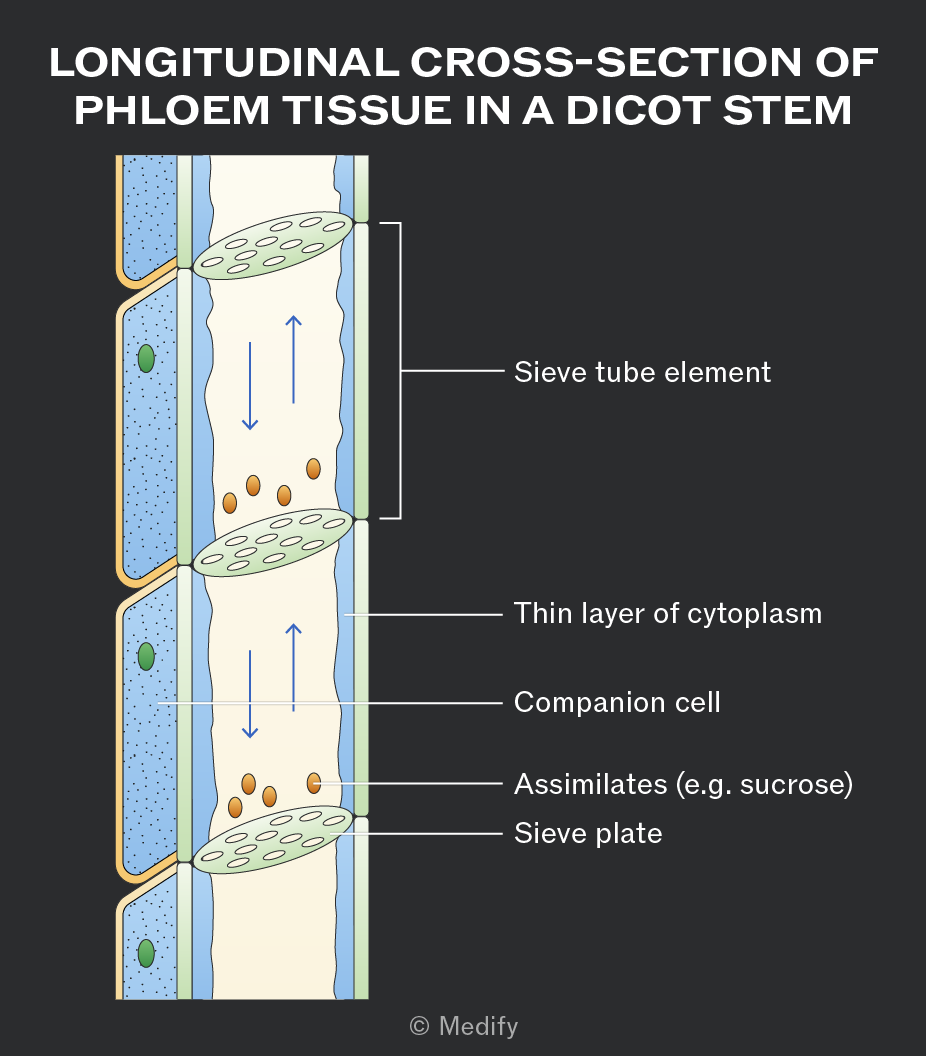
Phloem is a tissue made of two types of cells – sieve tube elements and companion cells.
Sieve tube elements are cells stacked end to end to form long, hollow, continuous tubes. The end walls of sieve tube elements, called sieve plates, contain pores that allow assimilates to pass through and connect the cytoplasm of adjacent cells.
Companion cells act as the “life support” for sieve tube elements, carrying out the living functions for the sieve tube elements.
A source is a part of the plant where assimilates are produced.
Examples include green leaves, storage organs such as tubers that are unloading their stores, and food reserves in germinating seeds.
Glucose produced in photosynthesising cells is converted into an assimilate, such as sucrose, for translocation in the phloem.
Sucrose is soluble, allowing it to move in sap, and relatively metabolically inactive, so it is not used in respiration. Transportation as sucrose also reduces diffusion out of the sieve tubes, as entry and exit are controlled by transport proteins.
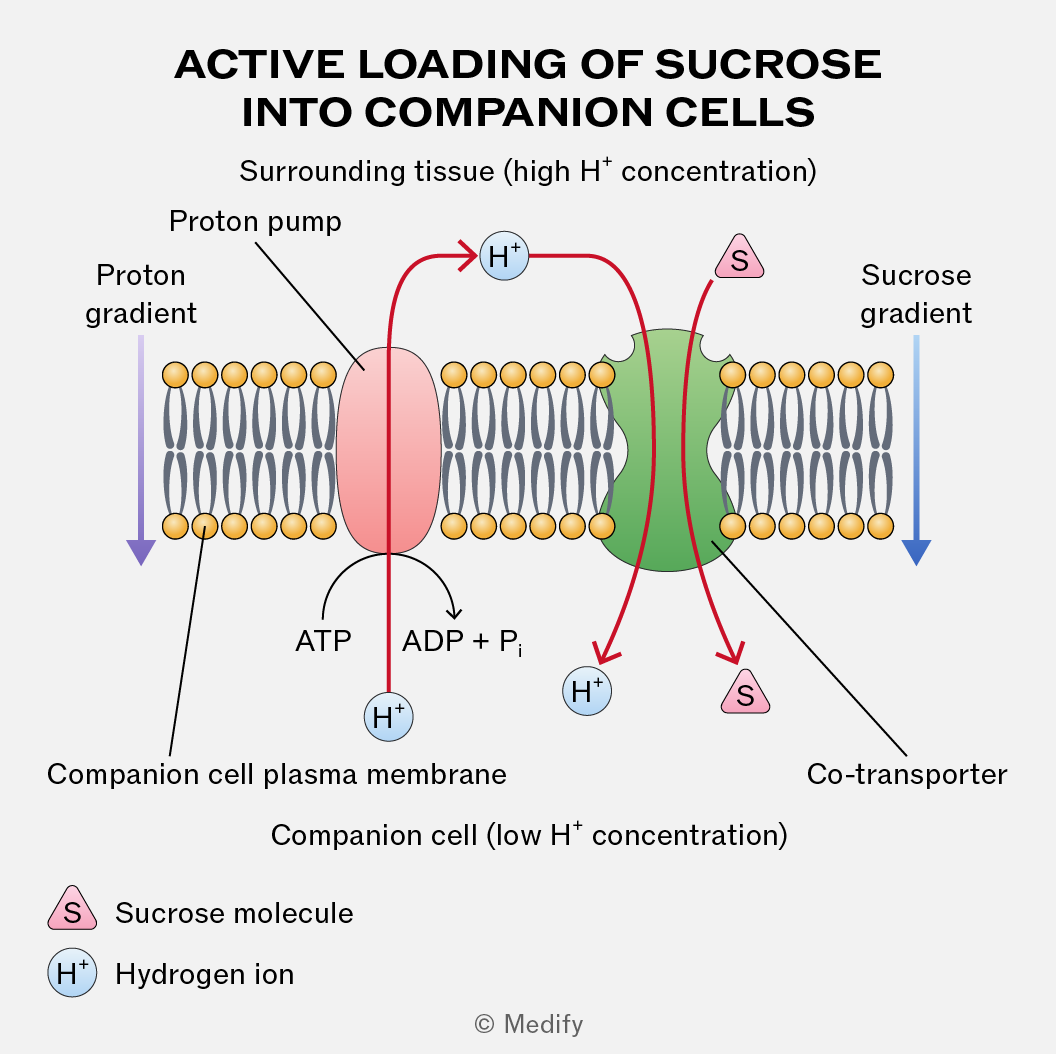
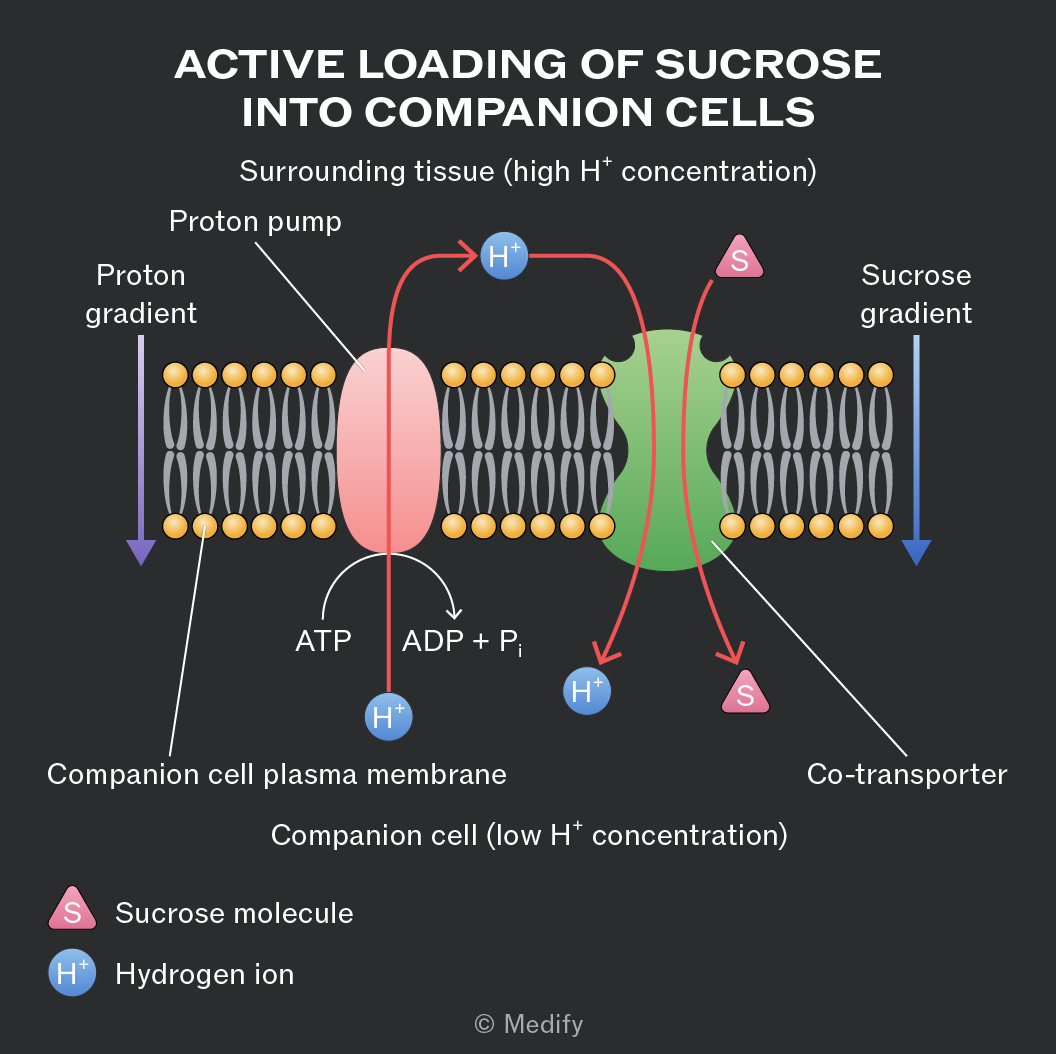
For the active loading of sucrose into the companion cells from the surrounding tissue, protons
() are actively pumped out using ATP and a proton pump. This creates a proton gradient.
Protons then re-enter the cell via co-transport proteins, carrying sucrose molecules with them. This process actively loads sucrose into companion cells, from where it diffuses into sieve tube elements for translocation.
The entry of sucrose into sieve tube elements at the source decreases the water potential in the sieve tube elements. This causes water to enter the phloem by osmosis from the surrounding cells and xylem vessels. This results in higher hydrostatic pressure within the sieve tube elements.
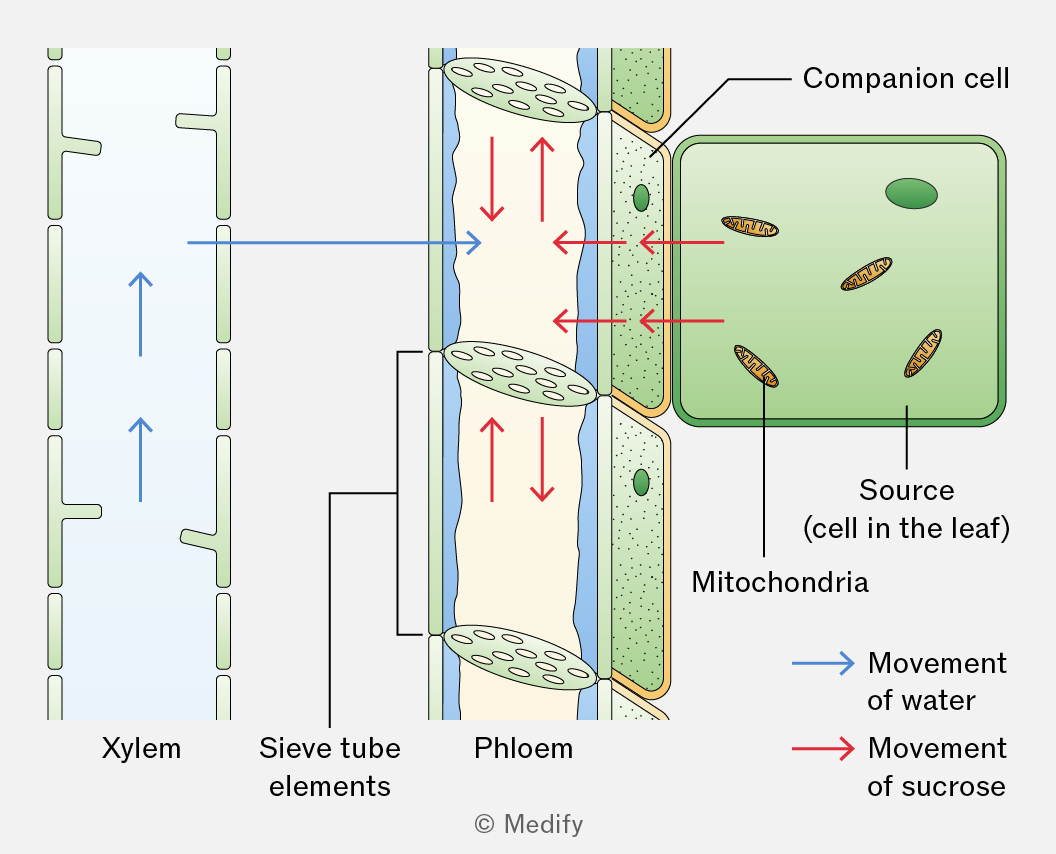
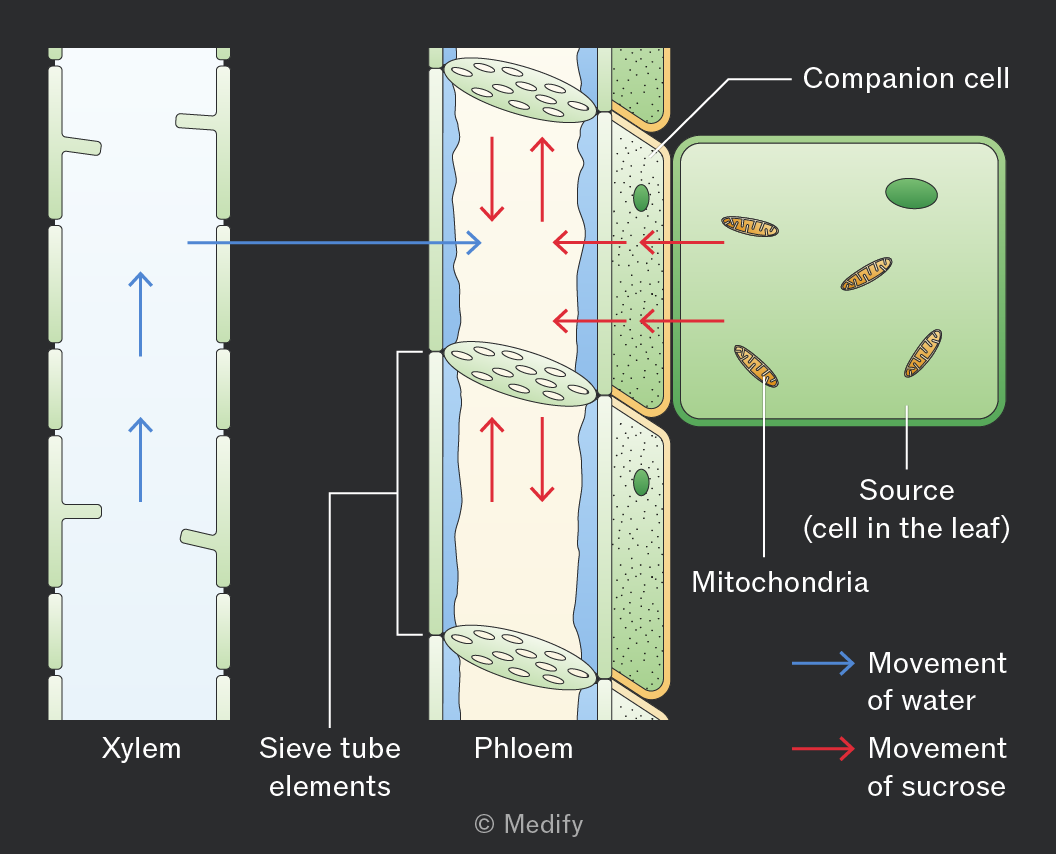
When the sucrose arrives at the sink, it diffuses out of the sieve tube elements into the surrounding cells. This causes the water potential inside the sieve tube elements to increase so water leaves by osmosis down a water potential gradient. This lowers the hydrostatic pressure.
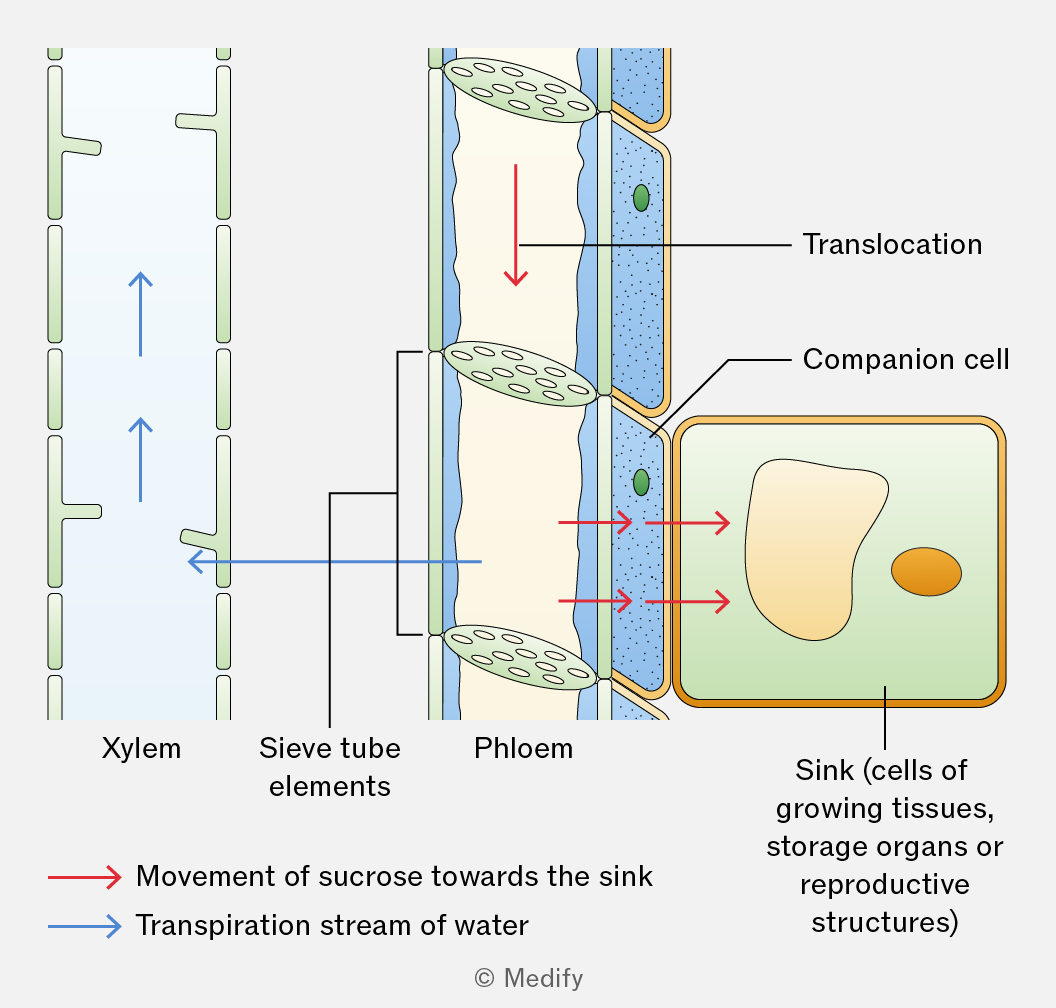
A hydrostatic pressure gradient drives the mass flow of sucrose dissolved in water from source to sink. The high hydrostatic pressure in the phloem at the source enables rapid transport over long distances.
A sink is a part of a plant where assimilates are used or stored. Assimilates are translocated from source to sink down a concentration gradient in the phloem. At the sink, assimilates are converted into glucose for respiration or starch for storage, maintaining a concentration gradient between the phloem and cells.
Examples include growing roots, dividing meristems, developing seeds, fruits, or storage organs.
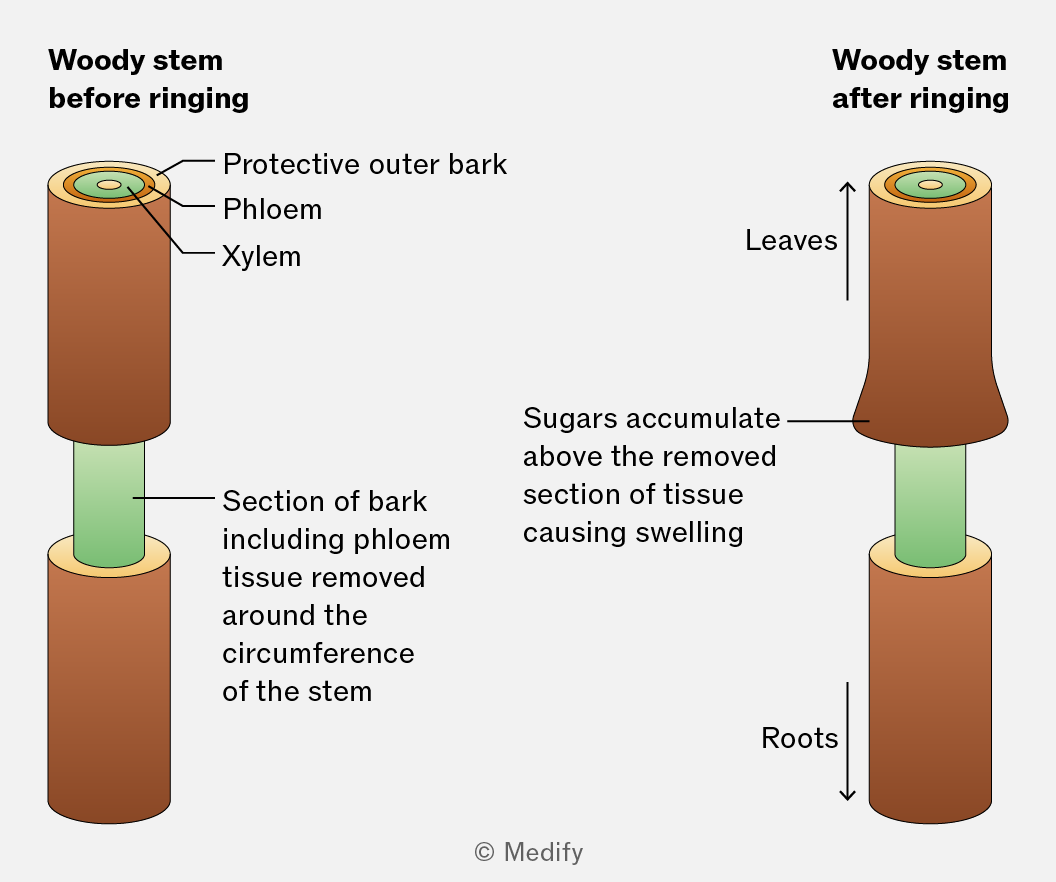
Ringing experiments provide evidence for mass flow in the phloem. A ring of outer tissue, containing the phloem is removed from the stem while leaving the xylem intact.
After some time, the region of the stem above the ring becomes swollen due to the accumulation of sugars (assimilates) and below the ring, tissues may die.
This shows that sugars are translocated in the phloem.
Radioactive isotopes can be used to trace the movement of substances in plants. The isotope can be used to produce radioactively labelled carbon dioxide (). Plants will incorporate this into sugars during photosynthesis.
These radioactively labelled sugars can be tracked as they move through the plant using autoradiography. This involves taking thin cross-sections of the stem and placing them onto X-ray film. The film becomes blackened where it is exposed to radiation from the ()-labelled sugars.
The blackened regions are only found in the phloem tissue, showing that sugars are transported here.