
Mass spectrometry (Topic 7A and Topic 19A)
On this page
Organic molecules in a mass spectrometer are vapourised then undergo ionisation, with the loss of an electron from one of the covalent bonds.
This can be represented as:
is the molecular ion, it represents the whole molecule minus one electron.
The singly charged molecular ion peak, , has an m/z equal to the molecule’s relative molecular mass ().
The molecular ion peak has the highest m/z value and is located on the far right of the mass spectrum.
Mass spectra of organic molecules will exhibit a tiny peak at 1 mass unit greater than the molecular ion.
This is called the M+1 peak and is caused by the presence of the carbon-13 isotope which comprises of all carbon atoms.
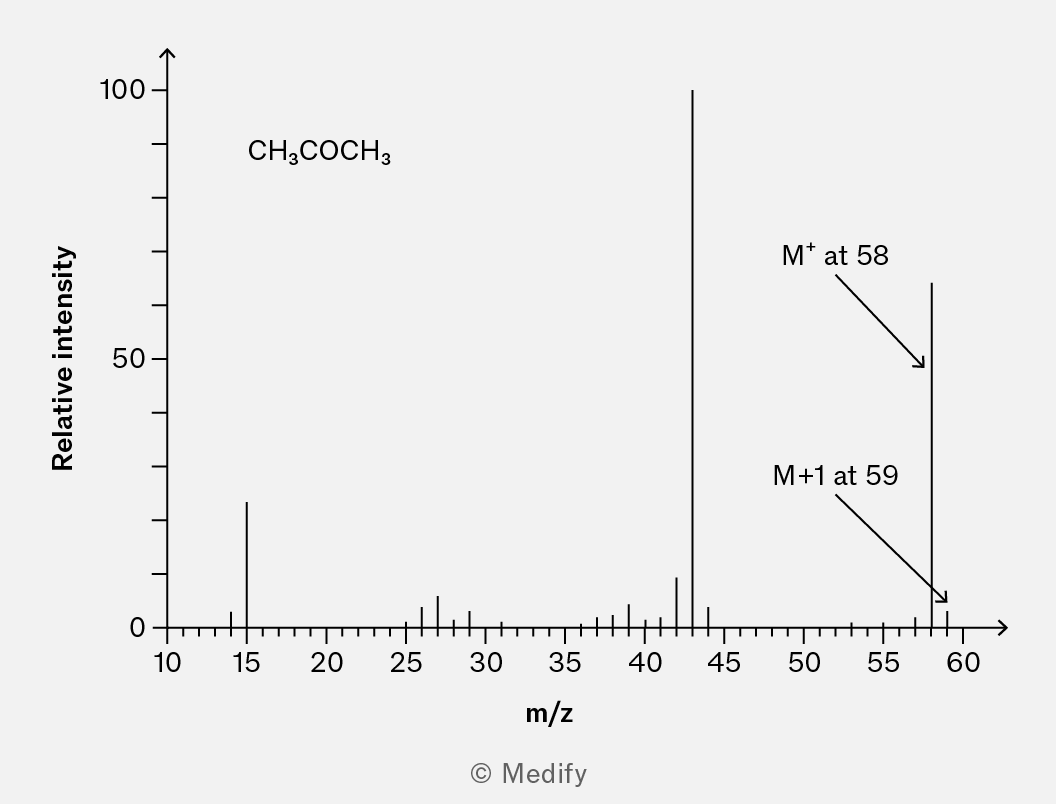
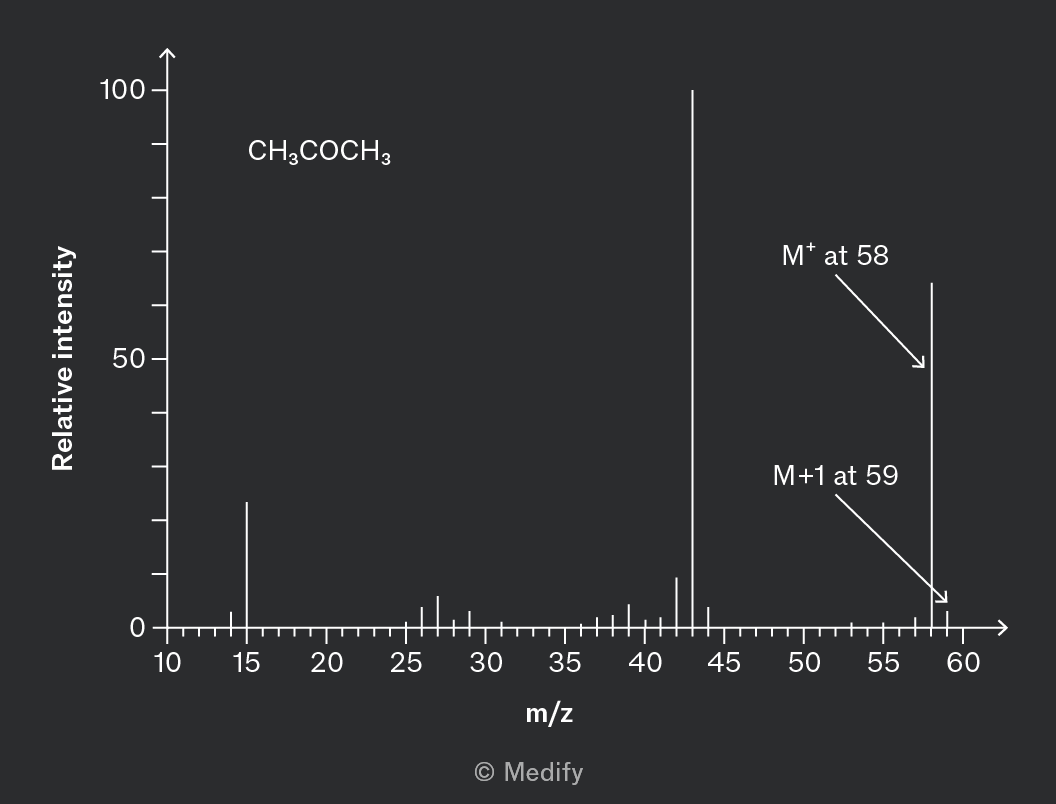
The of propanone, , is 58.
In the spectrum of propanone, the molecular ion peak, , is at 58 and a smaller M+1 peak at 59 shows the proportion of propanone featuring carbon-13.
Molecular ions formed during ionisation are positively charged radicals and are generally unstable.
They split to form a radical and a cation; this is called fragmentation.
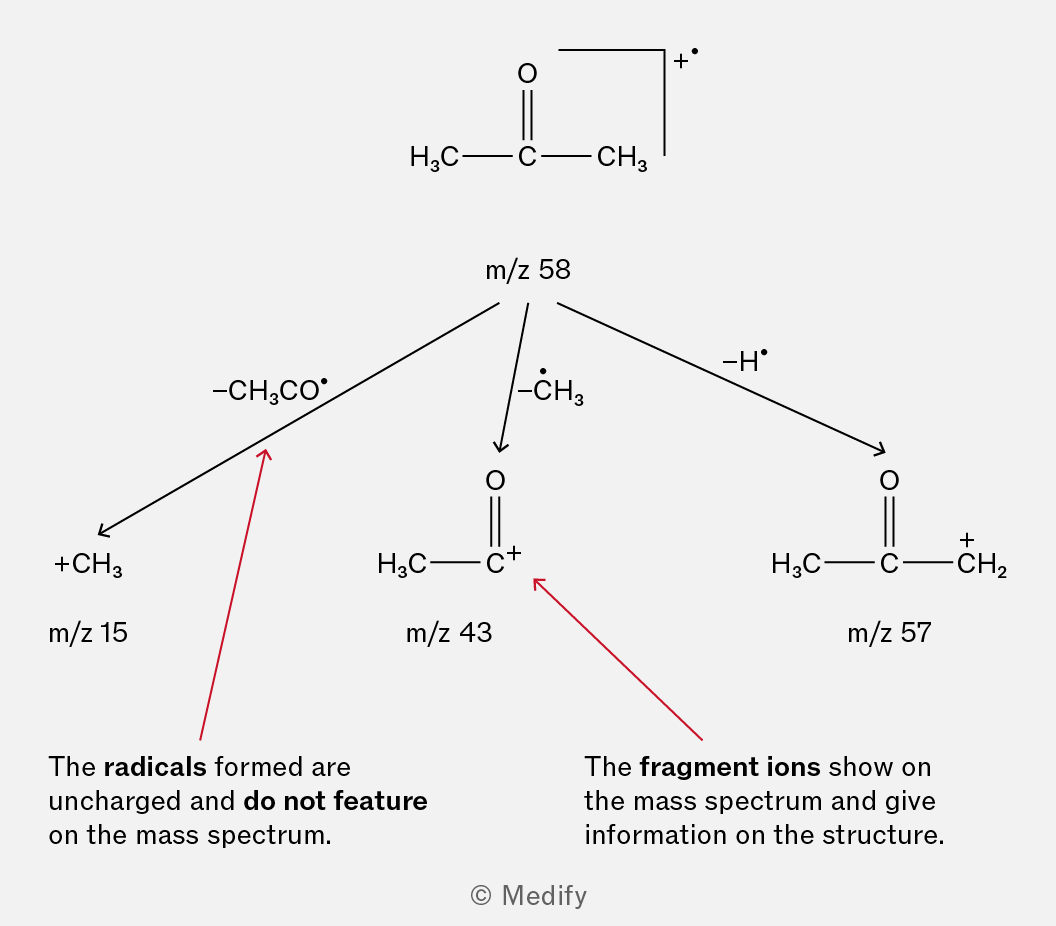
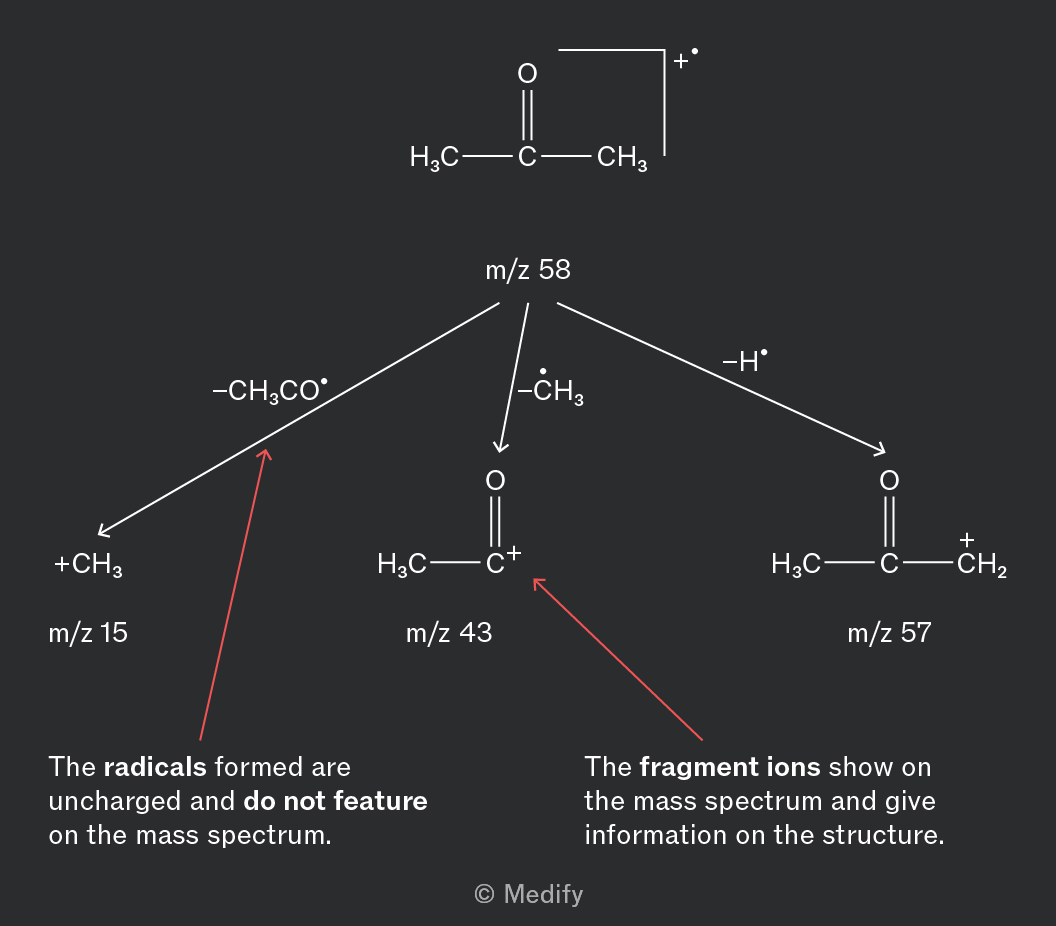
The cationic molecular fragment ions can be seen in the mass spectrum.
All fragment ions will have lower molar mass than the molecular ion, .
Some fragment ions may be formed more frequently.
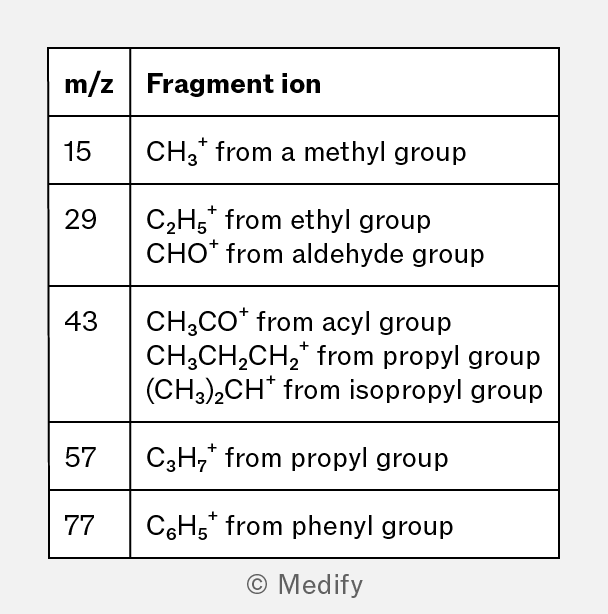
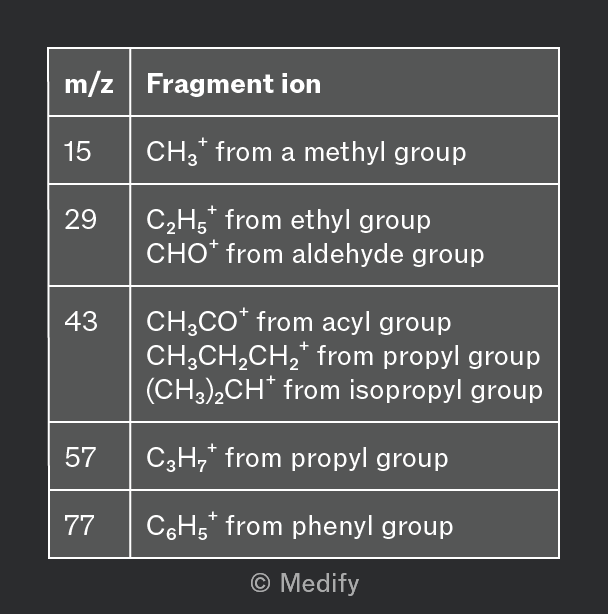
m/z 29 and m/z 43 are commonly used in exams due to the variety of fragments they can be associated with.
Relative atomic mass, Ar, is the average weighted mass of the isotopes that comprise an element.
Mass spectrometry produces signals linked to the exact molecule detected. The signal is related to the actual mass of the isotopes present and not the relative atomic mass.
High-resolution mass spectrometers can resolve signals to 4 d.p.
When the mass to charge ratio (m/z) of a molecular ion is recorded to 4 d.p., it can be positively identified by comparison to a reference database to give a molecular formula.
In low-resolution mass spectrometry, and would both show molecular ion peaks at 74.
The molecular formula cannot be deduced from the molecular ion peak.
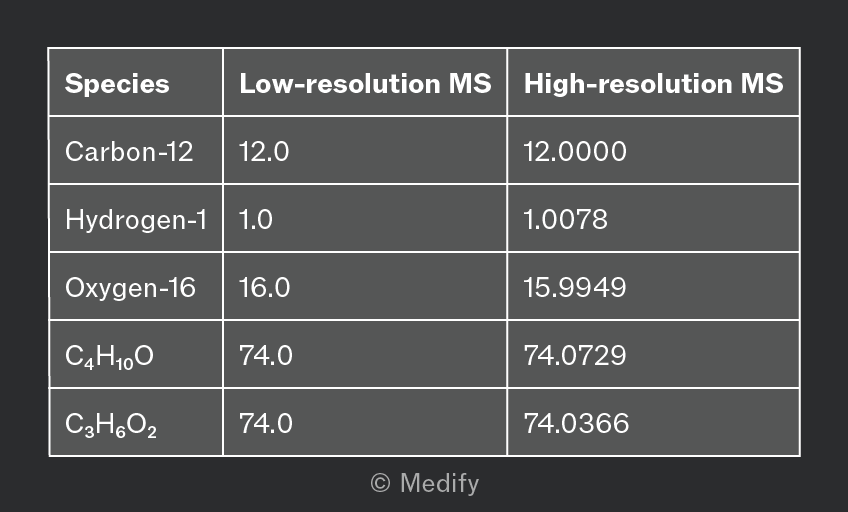
In high-resolution mass spectroscopy, the combined relative isotopic masses, correct to 4 d.p., of each molecule are detected. These more precise values can differentiate between the molecular formulas.
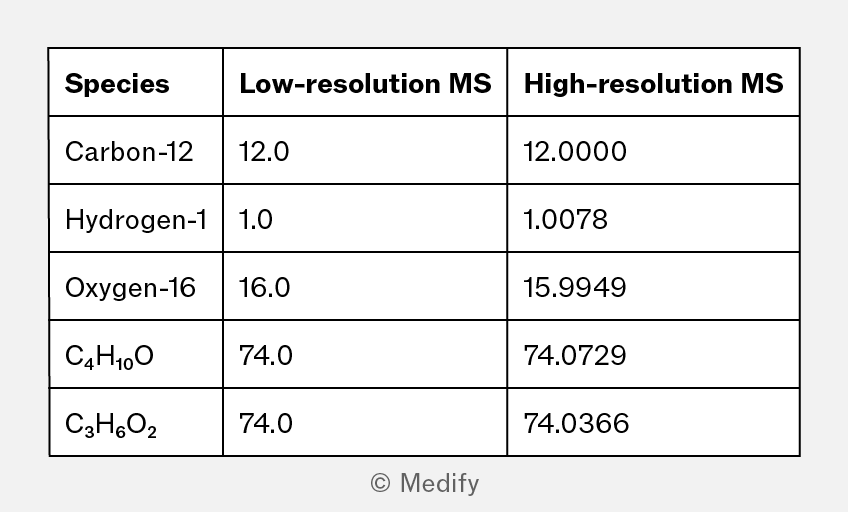
You may be expected to:
- describe the use of a reference database alongside high-resolution mass spectroscopy to identify the molecular formula from the molecular ion peak
- predict the m/z signal on a high-resolution mass spectrum given a reference table of isotopic masses to 4 d.p.
- identify peaks associated with the masses of trace isotopes, such as carbon-13 at M+1.