
Infrared (IR) spectroscopy (Topic 7B)
On this page
Different functional groups present in an organic compound can be identified from their IR stretching peaks.
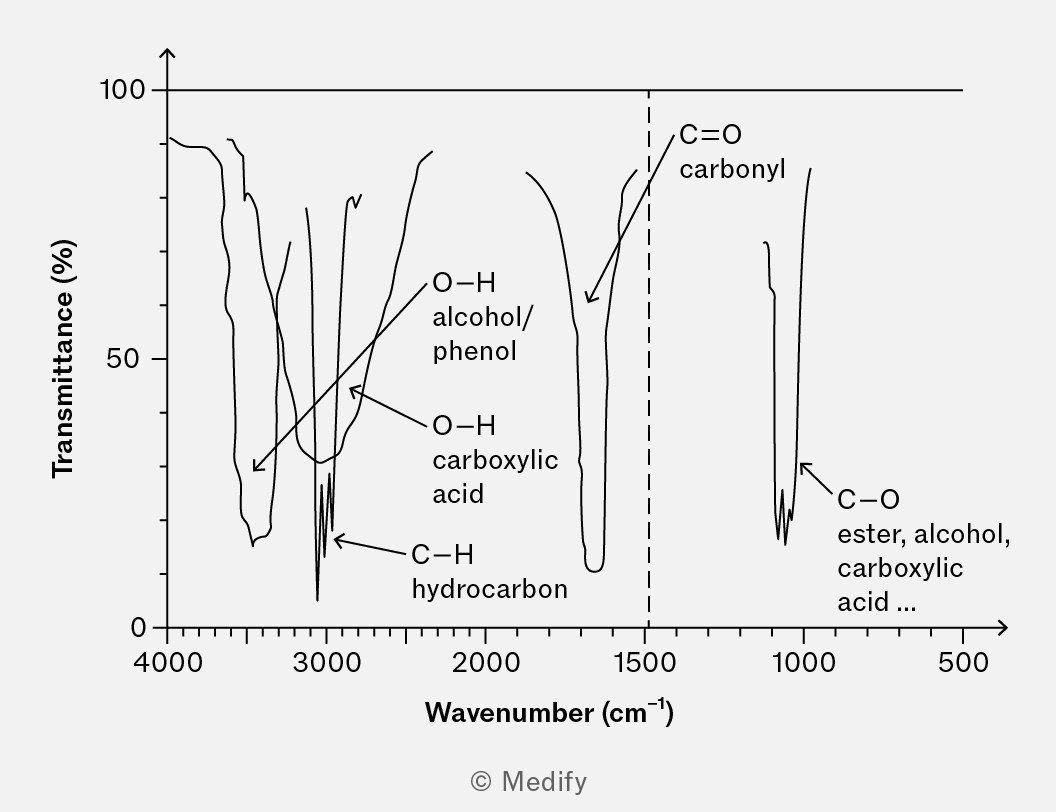
A basic outline of the main groups and their characteristics absorption frequencies in IR is as shown below:
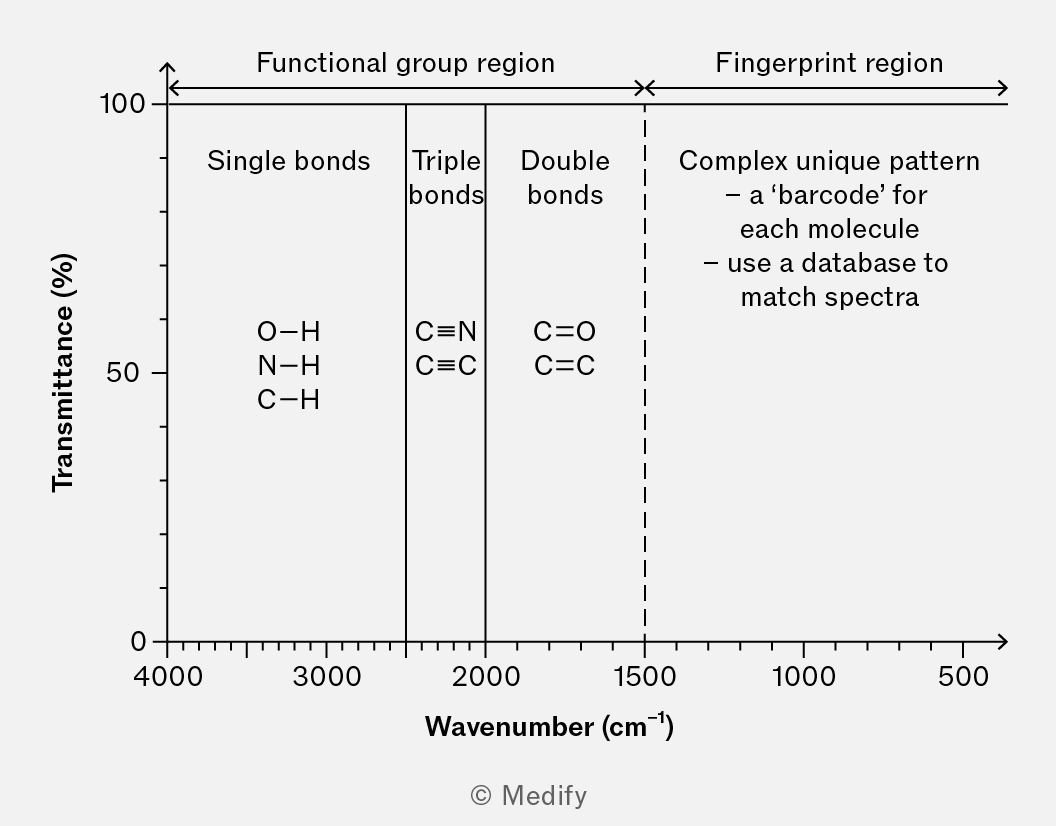
You will not be required to memorise this data.
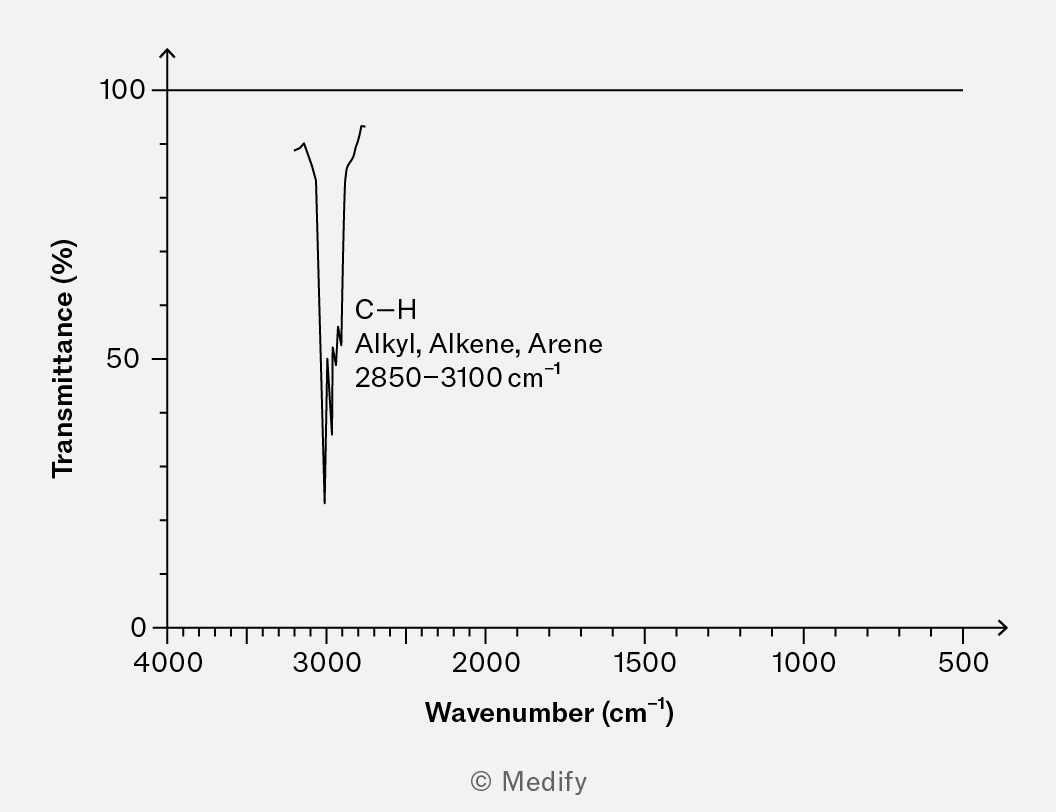
The presence of the bond stretching is easy to locate, though of limited use in distinguishing one organic compound from another.
A strong, broad peak is characteristic of bond stretching in alcohols.
This notable peak is located just to the left of the landmark bond peak and is very popular in exam questions.
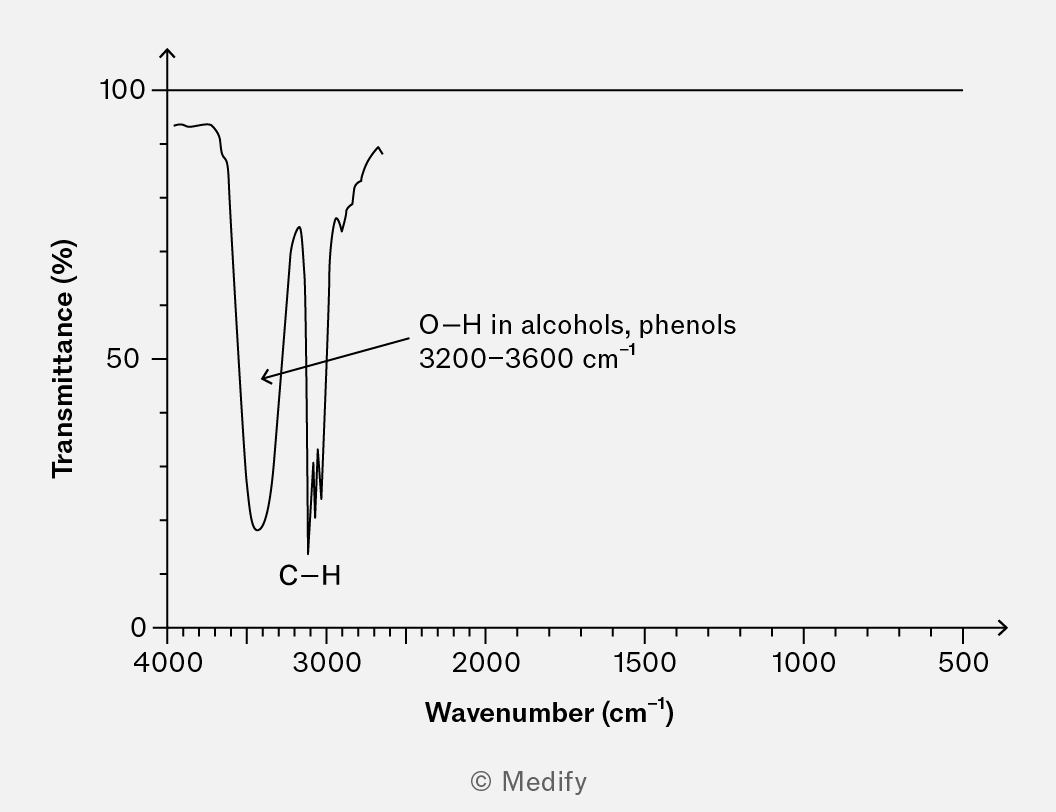
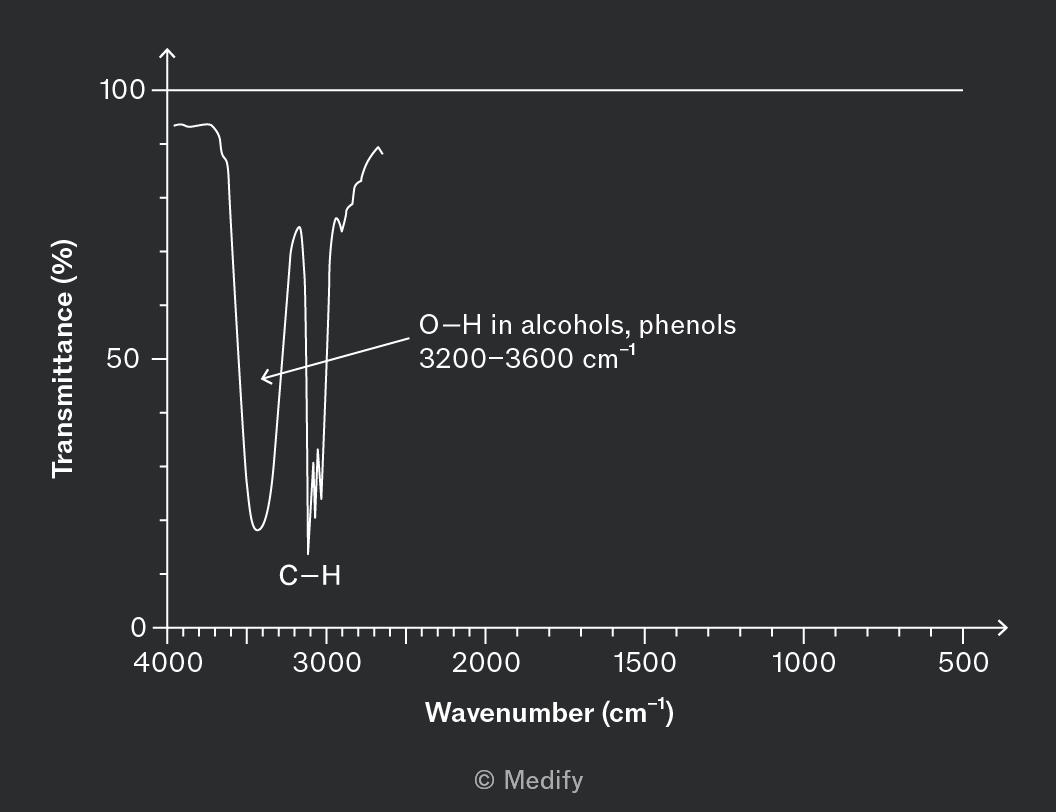
Be careful as the bond, although a weaker signal, is located in the same region as a bond.
The bond stretching, found in aldehydes, ketones, and other carbonyl-containing compounds is very easy to recognise as a strong narrow peak, almost in the middle of the spectrum around .
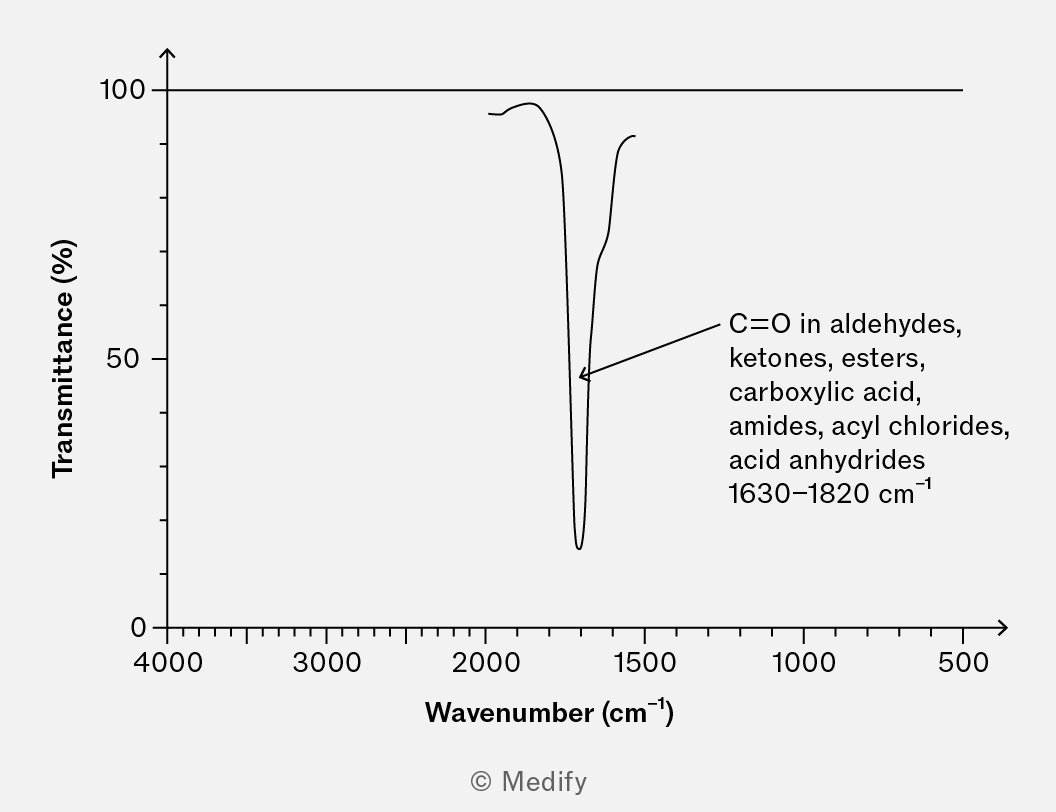
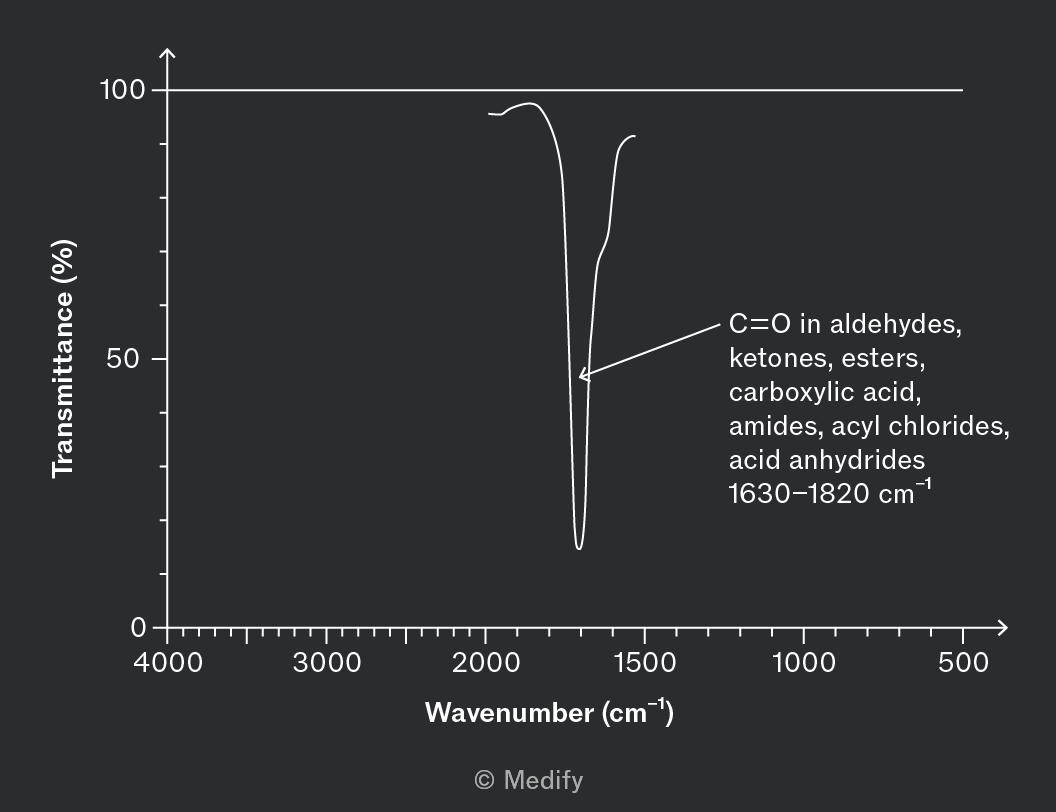
More details are required to fully identify the functional group.
The spectrum for the carboxylic acid group contains a stretch at and the very broad and strong peak of the group in carboxylic acids from .
Its breadth is due to hydrogen bonding between carboxylic acid groups causing variation in the vibration.
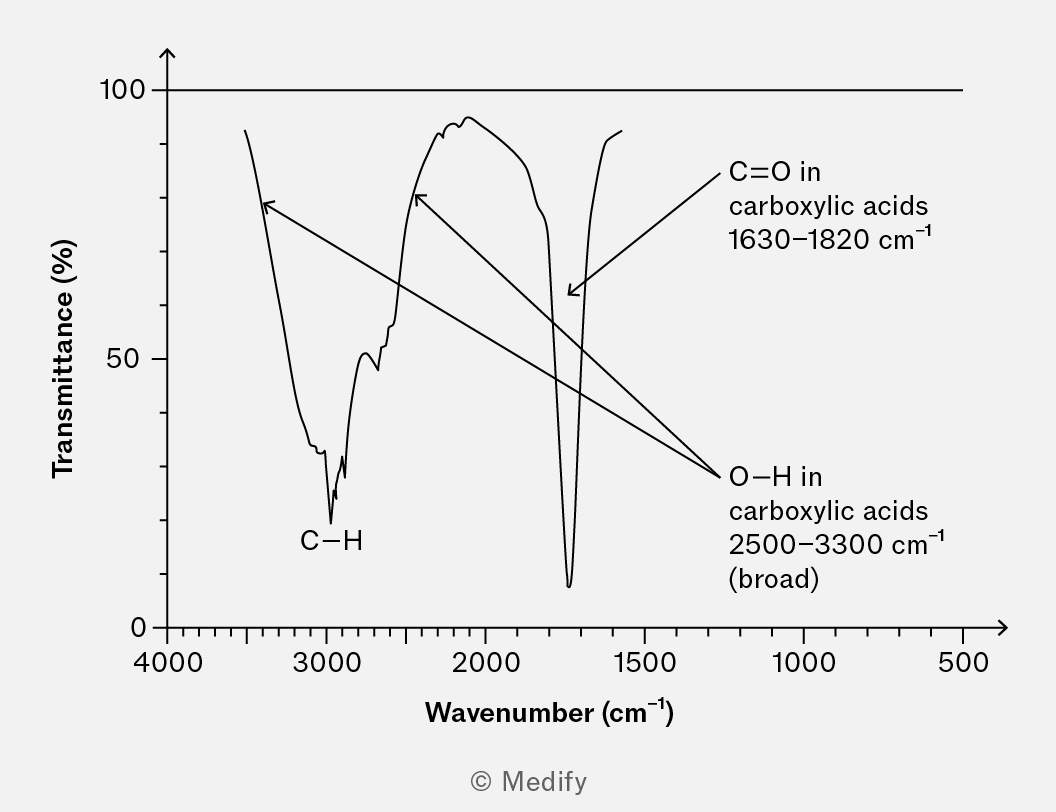
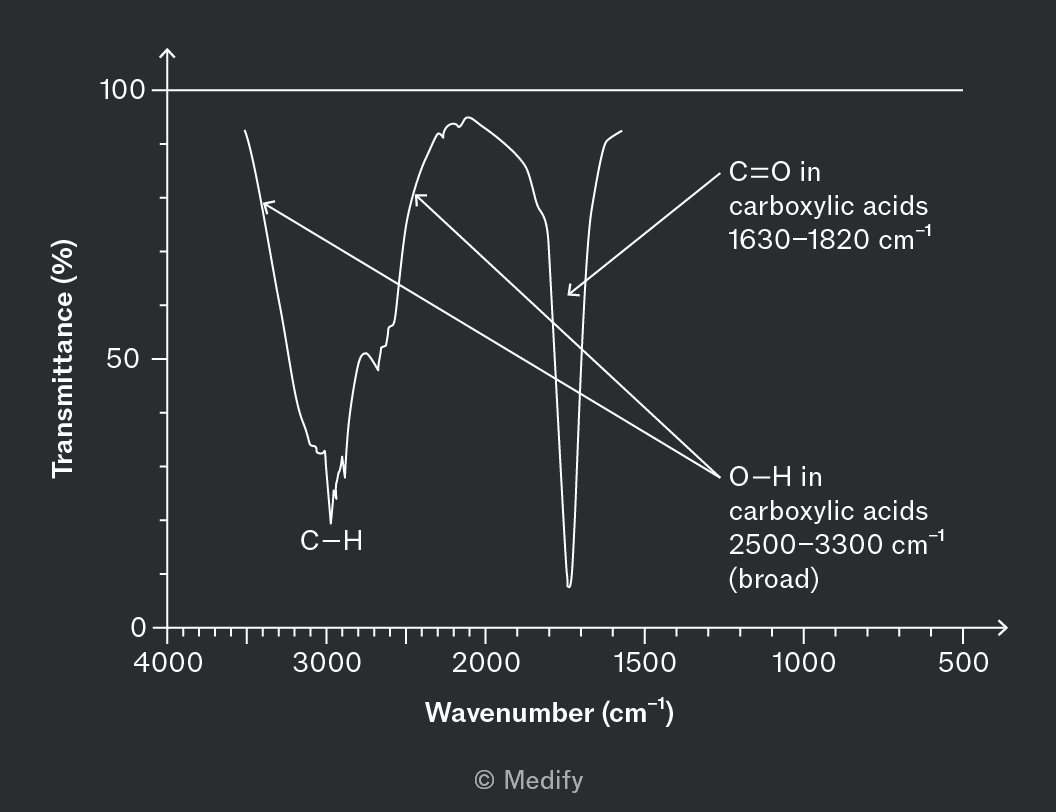
The carboxylic acid peak overlaps the bond peak, which can often be seen just below the broad carboxylic acid peak.
If there was a narrow peak and a peak this would indicate an alcohol and a carbonyl were present, not a carboxylic acid.
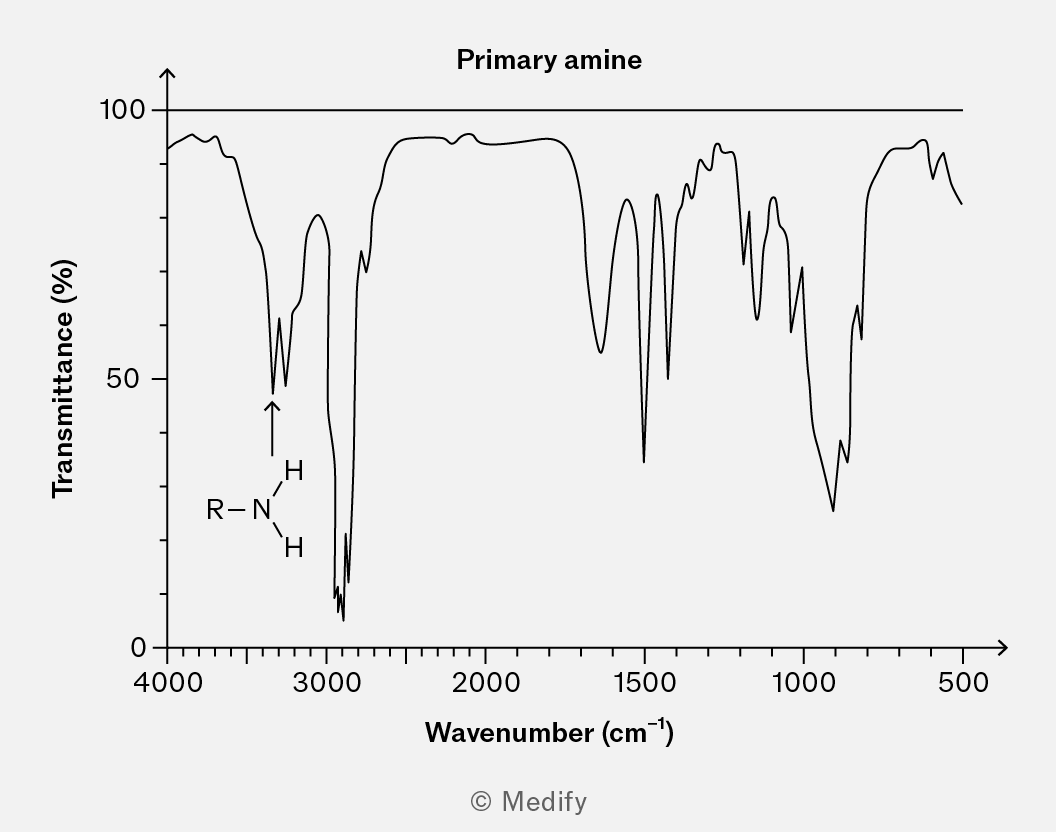
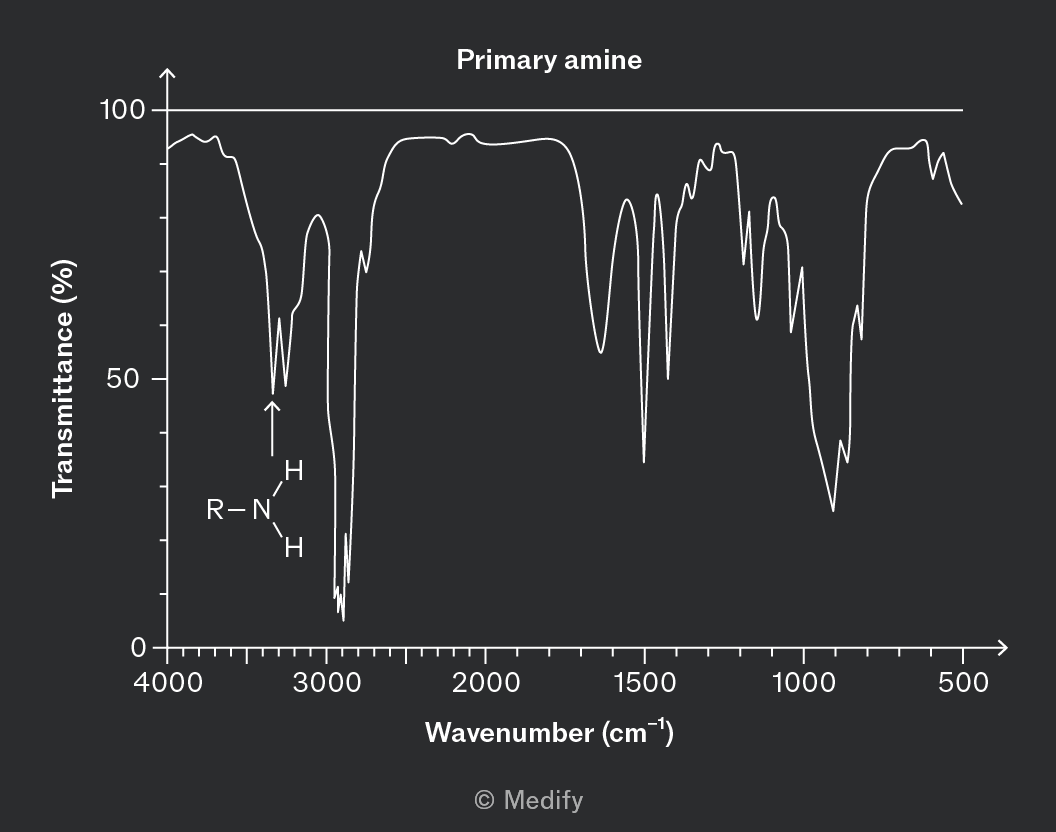
In amine’s, bond stretching appears as a characteristic peak in the IR spectrum, typically between .
This peak is often medium in intensity and can be either sharp or broad, depending on whether the amine is primary or secondary. It is significantly less intense than the of an alcohol, but is in the same region.
Most exam questions present an infrared spectrum and ask for the identity of the compound, or some structural features, deducible from the data.
Using the supplied data sheet spectroscopy table is essential here but a good understanding of the key peaks below will speed up your analysis.
IR spectra are most commonly assessed in combination with other techniques such as nuclear magnetic resonance (NMR) and mass spectrometry.
The absence of particular peaks from a spectrum can also help to confirm the identity of a functional group.
A commonly tested scenario is analysis of an alcohol oxidation. This involves distinguishing unreacted alcohol, aldehydes, ketones, and/or carboxylic acids.
Here we need to look for the absence, or presence, of the carboxylic acid’s broad peak. Likewise, the absence or presence of an alcohol peak. This will give a definitive answer on the presence of a carboxylic acid or an unreacted alcohol.
Aldehydes and ketones require additional data to identify. The IR spectra could be combined with NMR, mass spectrometry or qualitative tests such as using the Tollens reagent.
Question walkthrough
Combined spectroscopic analysis
Using mass spectrometry, IR spectrometry and elemental analysis in tandem