Chromatography (Topic 19C)
On this page
Chromatography is a separation technique used in which a mixture of substances, dissolved in a mobile phase, is passed over an inert stationary phase.
Separation is achieved through exploiting the difference in the sample’s solubility in the moving phase compared to its retention by the stationary phase.
Key types of chromatography include:
- Thin layer chromatography (TLC).
- Gas chromatography (GC).
- High pressure liquid chromatography (HPLC).
stands for retention factor and represents how far through a stationary phase a component has moved compared to the distance moved by its solvent.
Compounds can be identified by comparing their values to those of known substances.
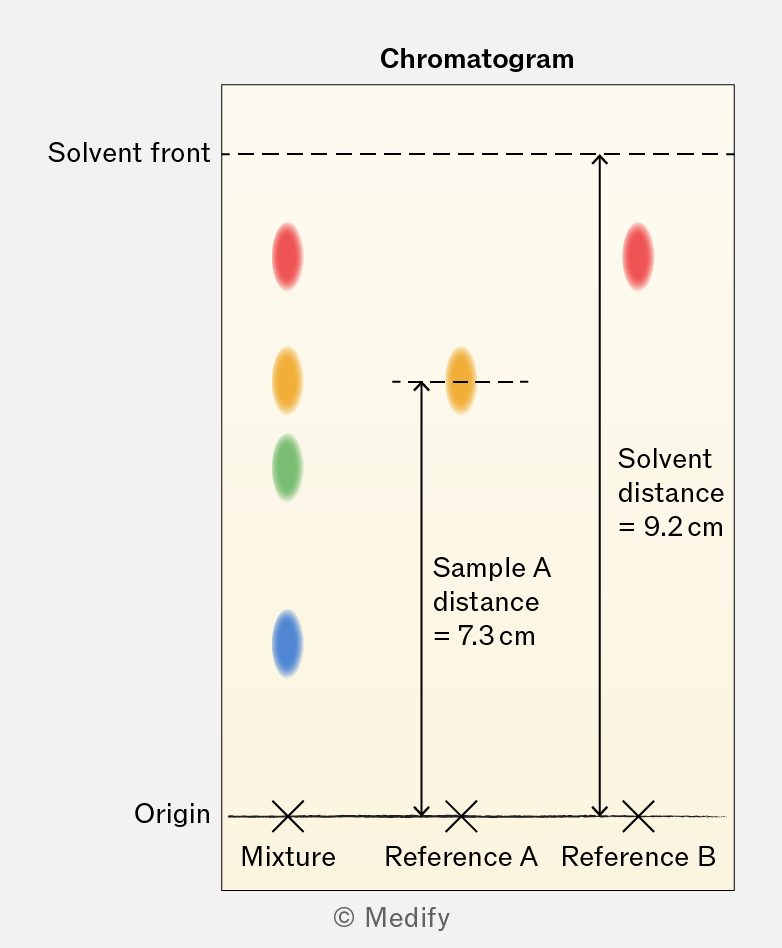
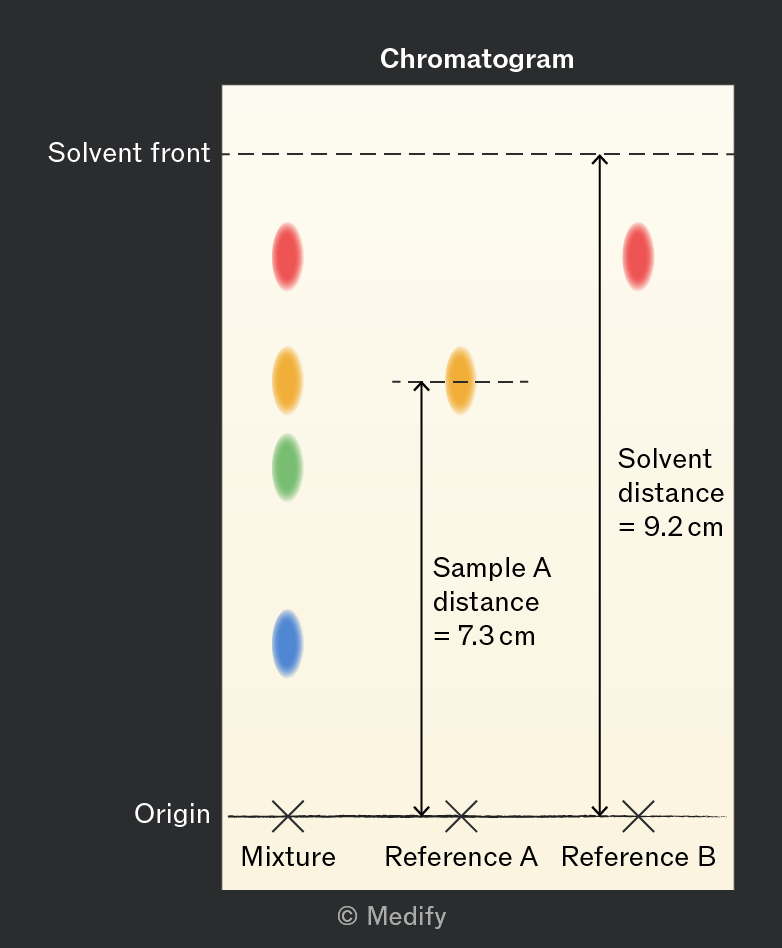
For the chromatogram shown above, the calculated value of reference A is:
The greater the value, the closer the distance moved by a sample is to the distance moved by the solvent. This indicates a sample is more strongly attracted to the solvent than to the stationary phase.
All values will be less than 1.
Note that values are specific to the stationary phase and solvent being used.
High pressure liquid chromatography (HPLC), and gas chromatography (GC), are both forms of column chromatography.
In column chromatography, the stationary phase is packed into the column. The mobile phase, containing the sample, is allowed to pass through the column.
As the solvent moves down the column, the sample components are separated based on solubility in the moving phase compared to retention by the stationary phase. Components that interact more strongly with the stationary phase move more slowly and are extracted out of the column (eluted) later.
The sample is separated into its individual components, which can then be collected and analysed. Pairing separation by column chromatography with analysis by mass spectroscopy (MS) is common in analytical chemistry.
Gas chromatography (GC), uses a column packed with an inert solid, or with a solid coated by a liquid. An inert carrier gas is passed through the column under pressure and at a high temperature.
All sample components are injected at the same time; the first component to emerge has the shortest retention time. This means the component has the greatest bonding affinity for the carrier gas compared to the retention by the stationary phase.
Many conditions in column chromatography must be controlled. These include:
- Type of stationary phase.
- Type of mobile phase.
- Flow rate.
- Temperature.
Under the same conditions molecules will always exhibit the same retention time. This can be used to identify specific compounds from a mixture when compared to a database on reference materials.
In the output spectra for high pressure liquid chromatography (HPLC), and gas chromatography (GC), the area under a sample peak is proportional to the concentration of compound in the sample. This area is the integrated peak height.
A calibration graph can be produced by running samples of the target material at known concentrations through the set-up.
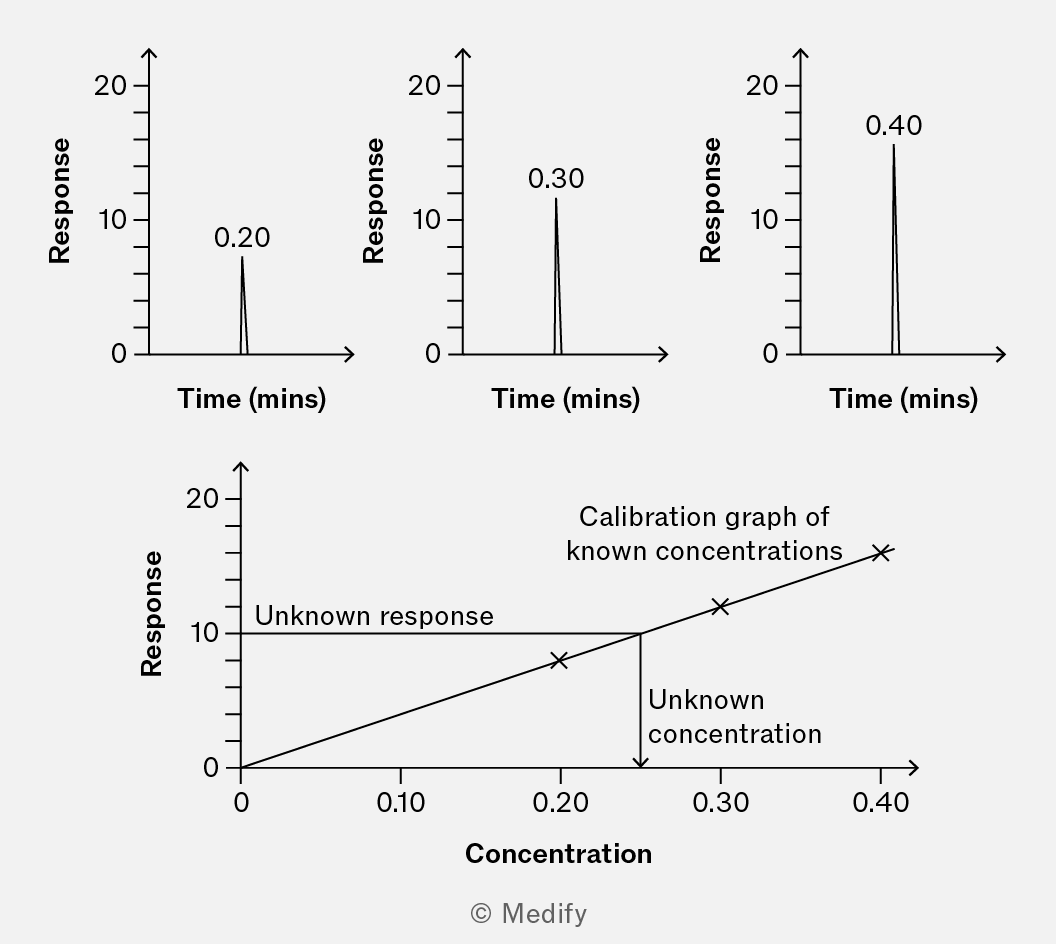
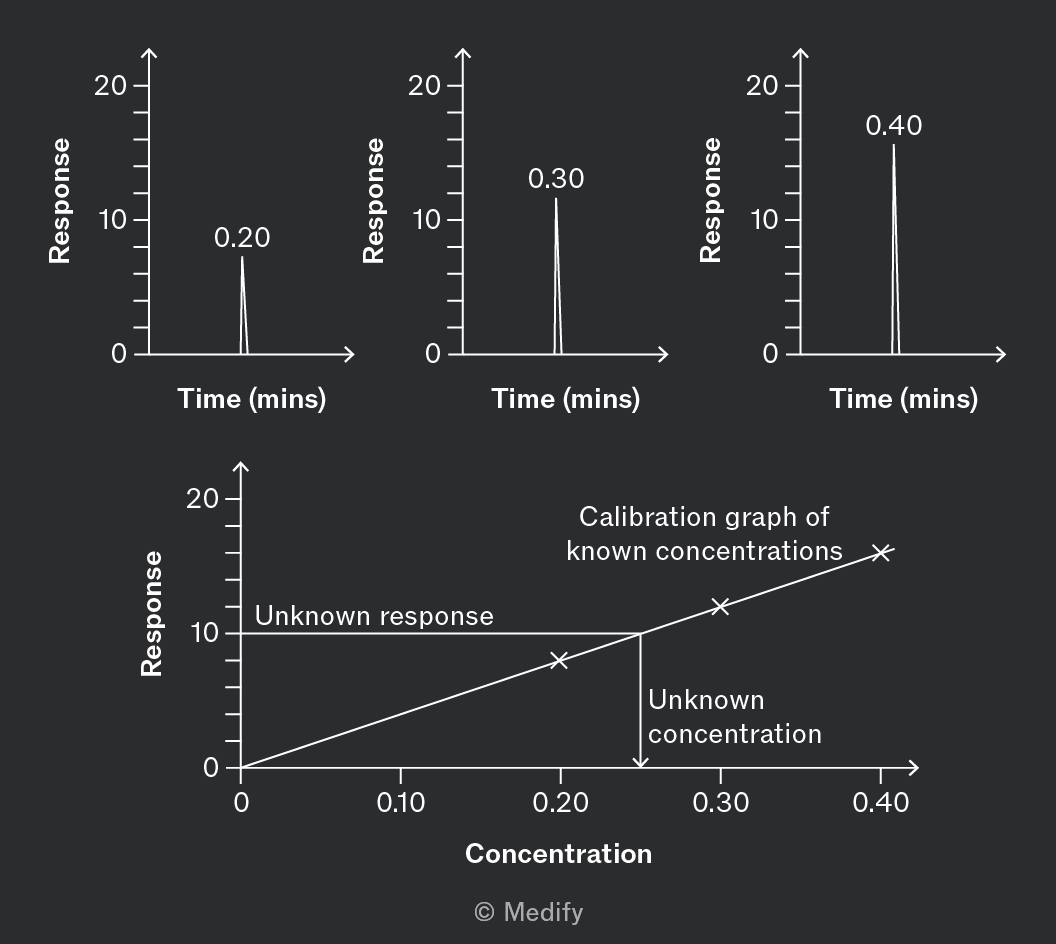
The calibration graph can be used to measure the concentration of a component in the test sample from its integrated peak on the spectra.
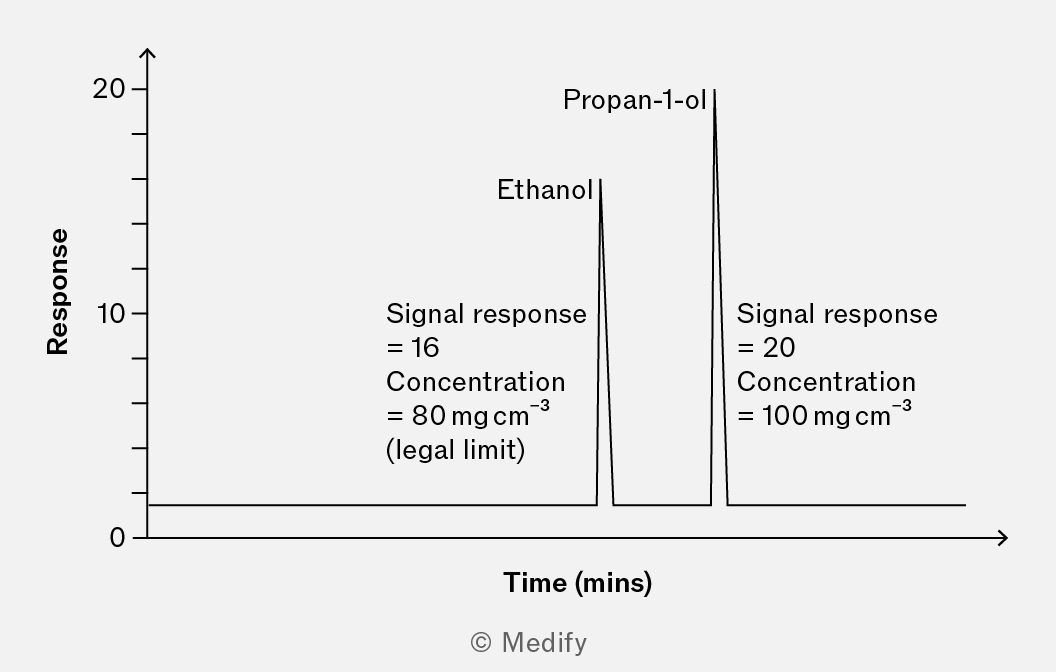
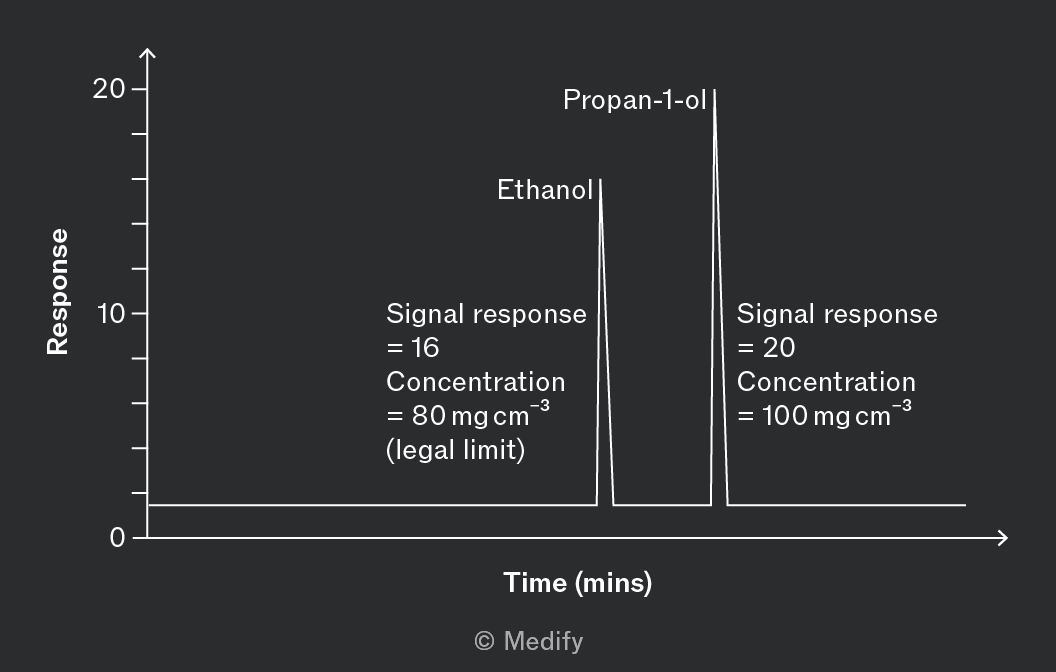
In forensic analysis, a known concentration or quantity of a similar substance, the internal standard, is added to a sample of a substance of unknown concentration.
By measuring the relative signal response the unknown quantity can be calculated.
A known concentration of propan-1-ol is added to a sample of blood or breath when assessing alcohol levels.
By comparing the relative peak area to propan-1-ol, the concentration of blood ethanol can be measured accurately.