
NMR spectroscopy (6.3.2)
On this page
Some nuclei possess a net non-zero magnetic moment, which means they exhibit a net magnetic force. and are key examples of nuclei with net non-zero magnetic moments.
When placed in an external magnetic field, as in a nuclear magnetic resonance (NMR) spectrometer, the nuclei’s magnetic moment can align with or against the direction of the external magnetic field. The energy gap between these alignments is detectable in NMR spectroscopy. It is the resonant frequency of the nucleus.
The surrounding nuclei in a molecule, the molecular environment, influences the size of the resonant frequency observed. This results in a separate signal being observed by all non-identical nuclei within a molecule.
The NMR spectrum is a plot of energy absorption against chemical shift () measured in parts per million (ppm).
A carbon-13 NMR spectrum helps study the structure of organic molecules by revealing information about:
- the number of different carbon environments present – from the number of peaks.
- the type of environment each carbon is in – from the chemical shift ().
Chemical shift, denoted by , is the difference between the resonant frequency of the observed nucleus and that of a reference compound, which is assigned an arbitrary value of zero on the NMR spectrum.
The zero value of the reference peak is found on the right hand side of an NMR spectrum.
NMR active atoms, bonded to different atoms or chemical groups, have different exposure to the external magnetic field. This is commonly referred to as a different environment.
Nuclei in a different chemical environment display resonance at different chemical shifts. This results in distinct peaks being produced on the carbon-13 NMR spectrum.
When analysing molecules, it is important to consider symmetry. If two carbon atoms are positioned symmetrically within an organic molecule, they are called equivalent carbons as they are equally shielded from the external magnetic field and therefore display the same chemical shift.
Your data sheet provides chemical shifts associated with different molecular environments. You need to be able to use this alongside your knowledge of NMR to describe the link between a molecule and its carbon-13 NMR spectrum.
The carbon-13 NMR spectrum of butanone is shown below.
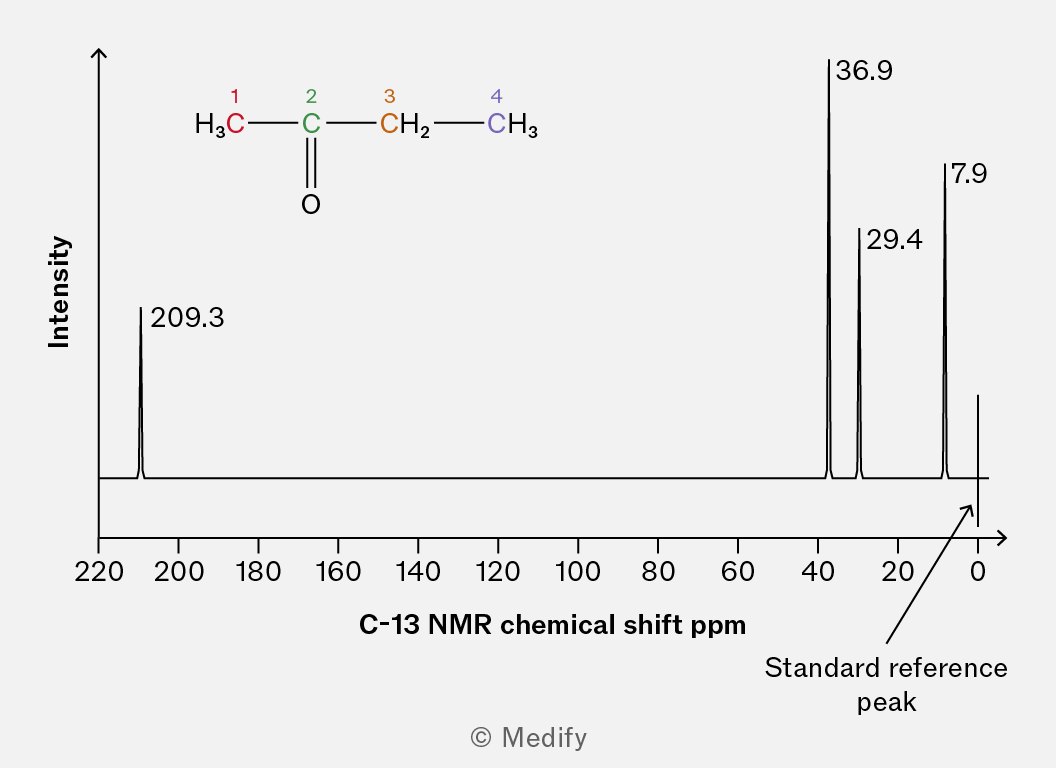
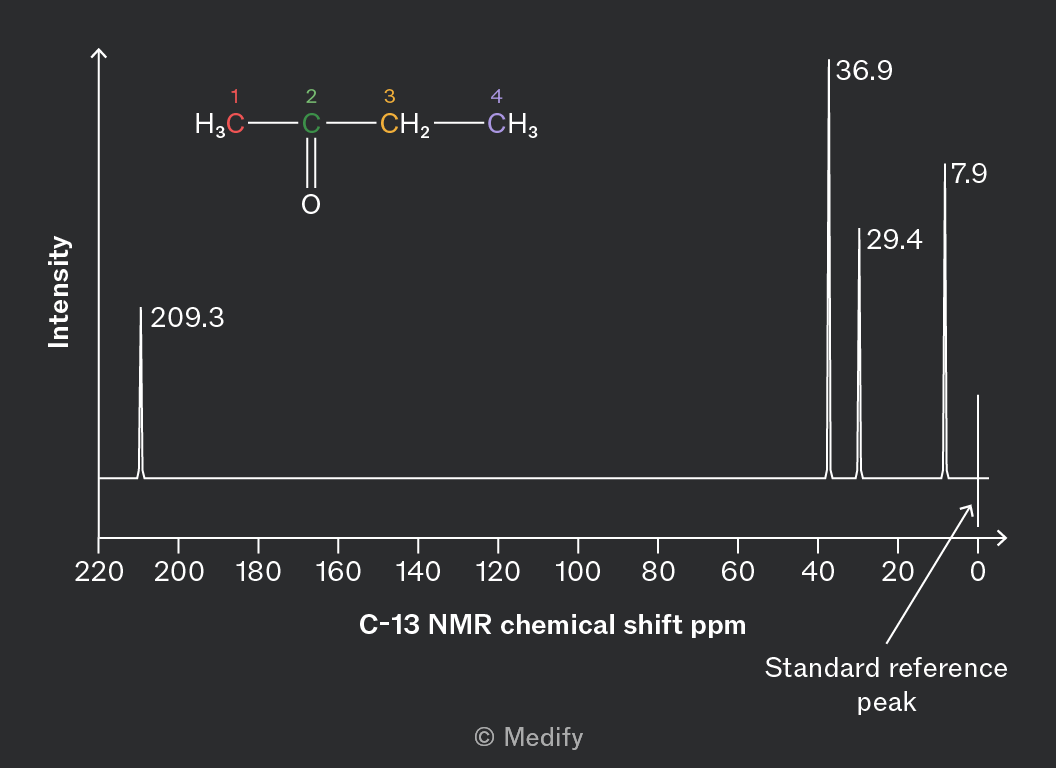
The spectrum shows four distinct peaks at different chemical shift () values. This links to the four different carbon environments present.There are no symmetrical, equivalent carbons.
Carbon 2, 209.3 ppm, the carbonyl carbon, shows on the far left of the spectra as the electronegative oxygen reduces nuclear shielding.
Carbons 1, 3 and 4 are all in the alkyl region, from 0 – 50 ppm.
Carbon 3, 29.4 ppm, is more shielded and therefore further right, than carbon 1, 36.9 ppm, due to the inductive effect of the methyl group. Carbon 4, 7.9 ppm, experiences the most significant nuclear shielding as it is furthest from oxygen. It sits furthest to the right.
Carbon-13 NMR gives a simpler spectra than proton NMR spectroscopy due to the lack of nuclear coupling.
The relative abundance of carbon-13 is only 1% meaning that the incidences of coupling between NMR active nuclei are infrequent and not visible on the spectrum.
Interactions between and are removed from the spectrum carbon-13 NMR spectroscopy: the spectrum are proton decoupled.
Identifying the number of non-equivalent carbon environments tells you how many peaks to expect on a carbon-13 NMR spectrum.
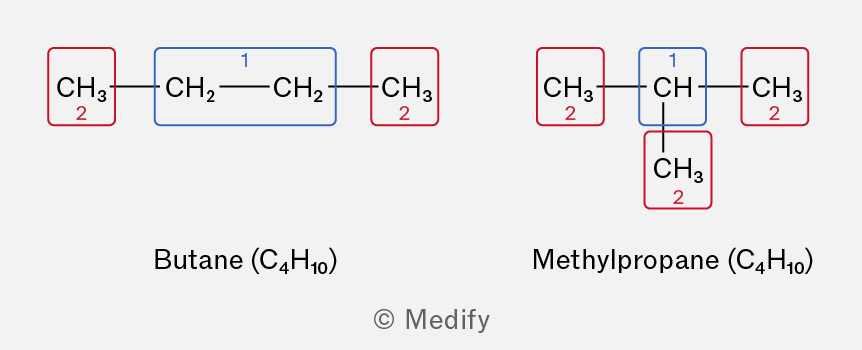
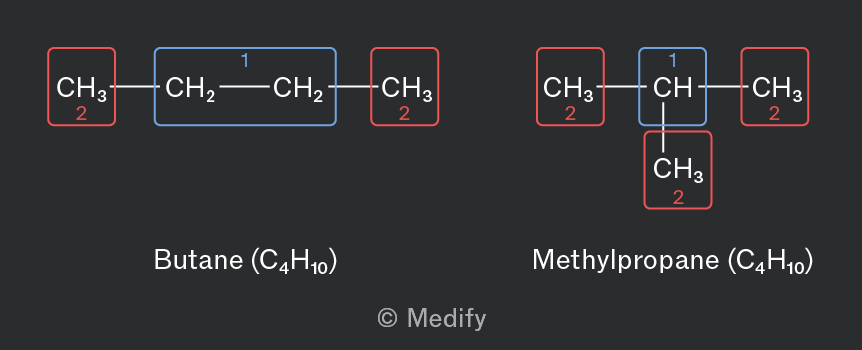
Both butane and its isomer methylpropane have two carbon environments.
The number of carbons in each environment, and therefore the integrated area under the peaks, is different. Butane will show relative peak intensity of 1:1 whereas methylpropane will show relative intensity at 1:3.
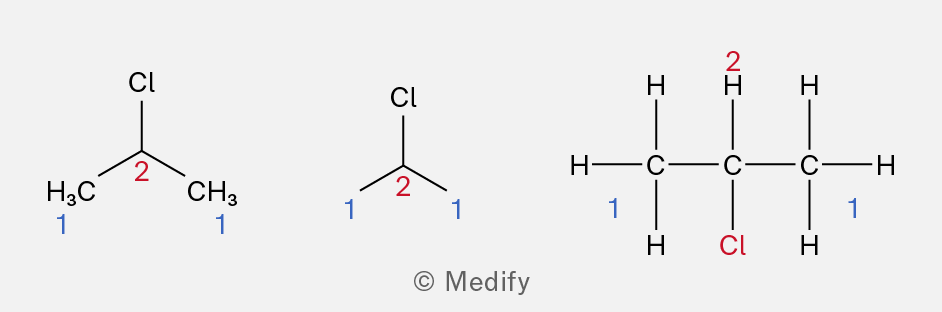
The molecules below are sorted according to the number of non-equivalent carbon environments they possess.
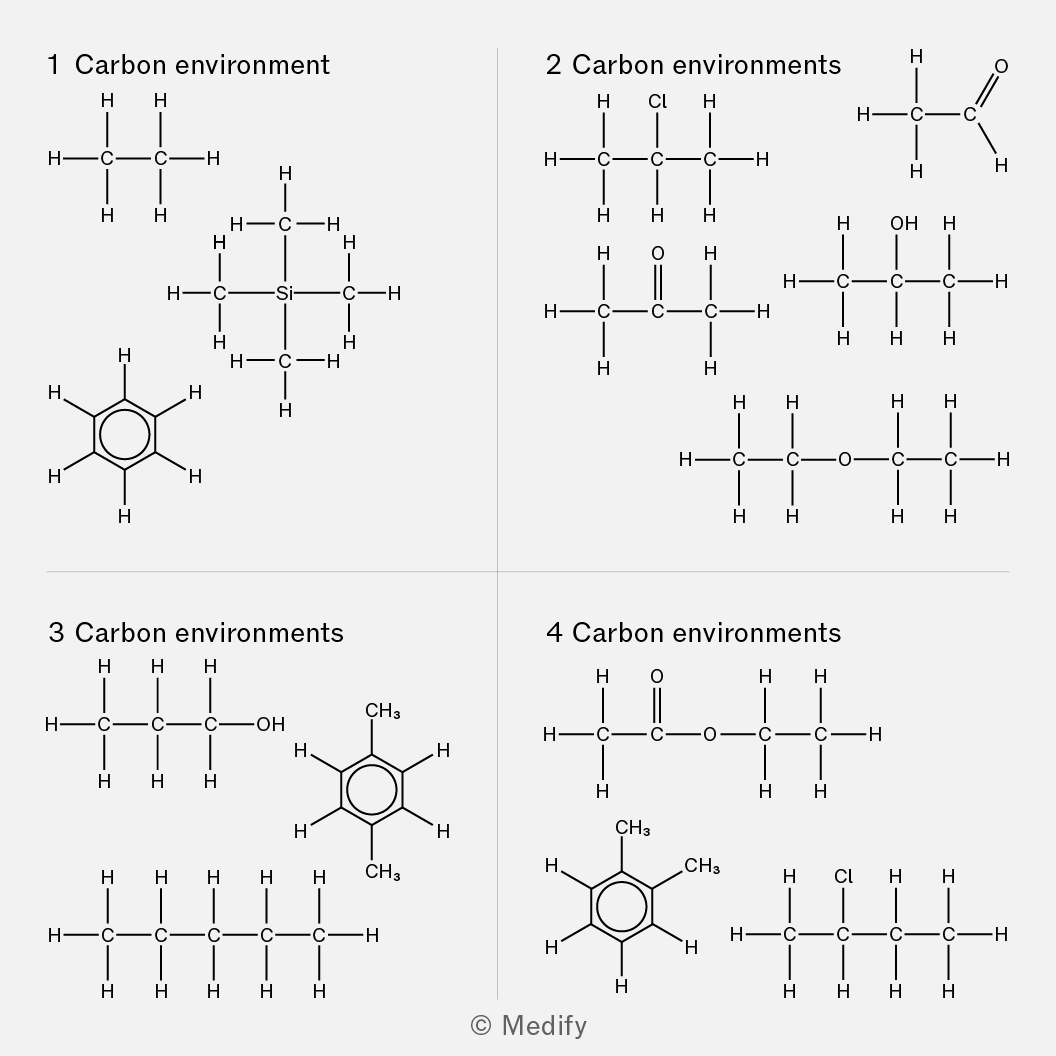
More structural information can be obtained from a proton NMR spectrum than a carbon-13 NMR spectrum.
The high-resolution proton NMR spectrum provides information about:
- The number of different proton environments – from the number of peaks.
- The type of environment each proton is in – from the chemical shift () values.
- The relative numbers of protons in each environment – from the area under the peaks.
- The number of non-equivalent protons adjacent to the proton being observed – from the splitting pattern.
A proton NMR peak is split into sub-peaks due to interaction with the spin states of nearby protons, belonging to different chemical environments.
This splitting of the main peak into sub-peaks is called spin-spin splitting or spin-spin coupling.
Spin-spin splitting does not occur when the adjacent protons are in an equivalent chemical environment.
The ‘ rule’ gives the number of sub-peaks expected from a single proton environment. This is one greater than the number of nonequivalent protons on the adjacent atoms.
The table below shows the common spin-spin splitting patterns in organic molecules.
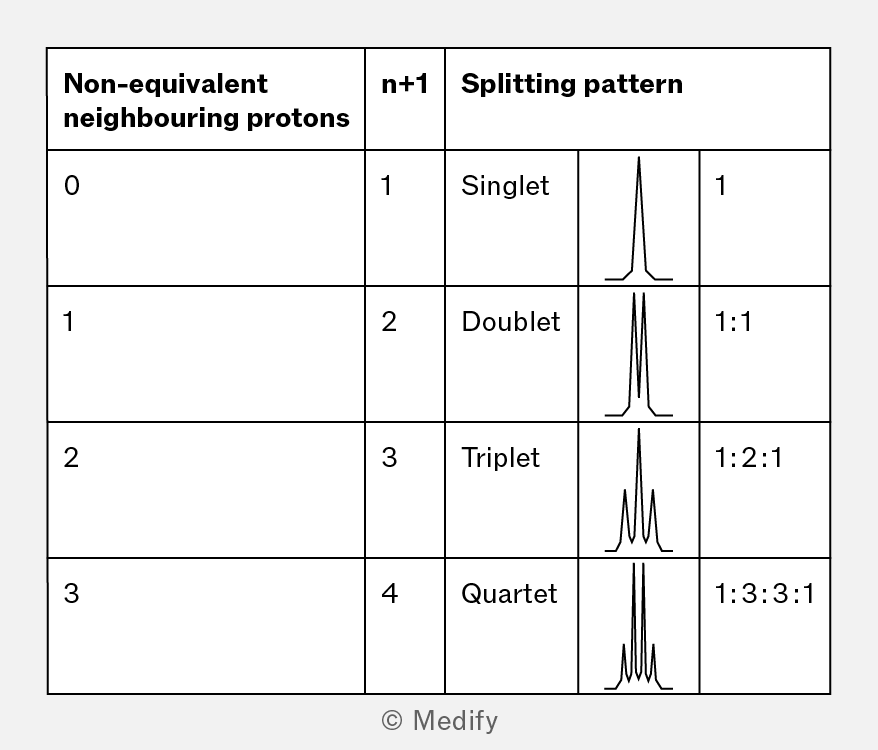
If the main peak is split into more than four sub-peaks, it is called a multiplet.
Your data sheet provides chemical shifts associated with different molecular environments. You need to be able to use this alongside your knowledge of NMR to describe the link between a molecule and its proton NMR spectrum.
The high-resolution proton NMR spectrum of ethanol is shown below.
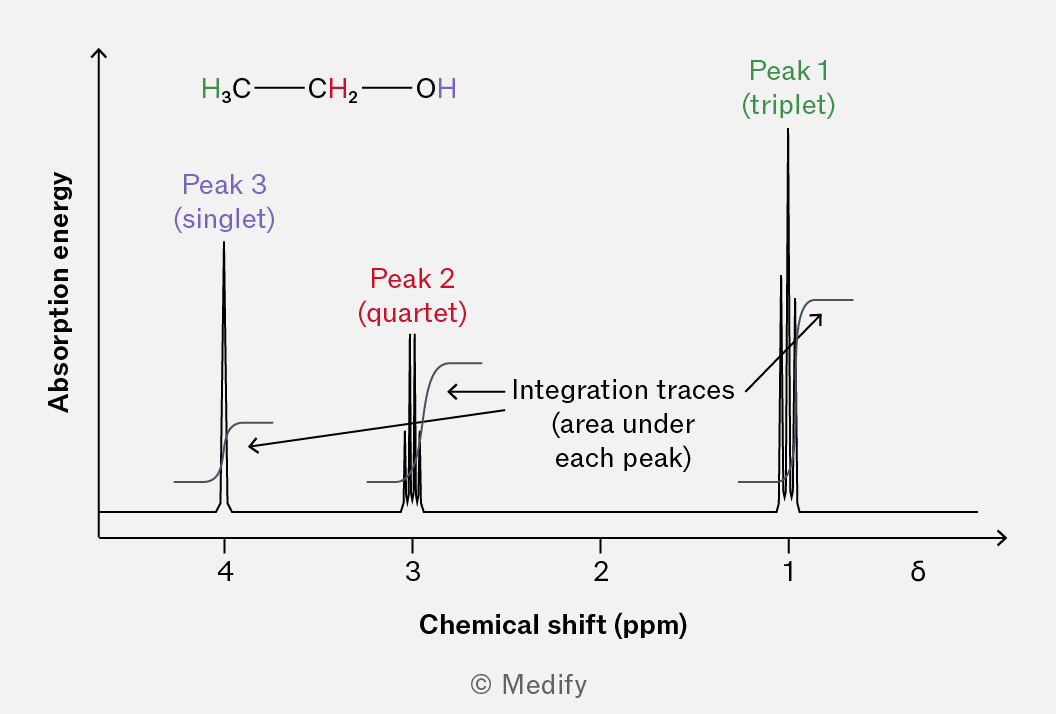
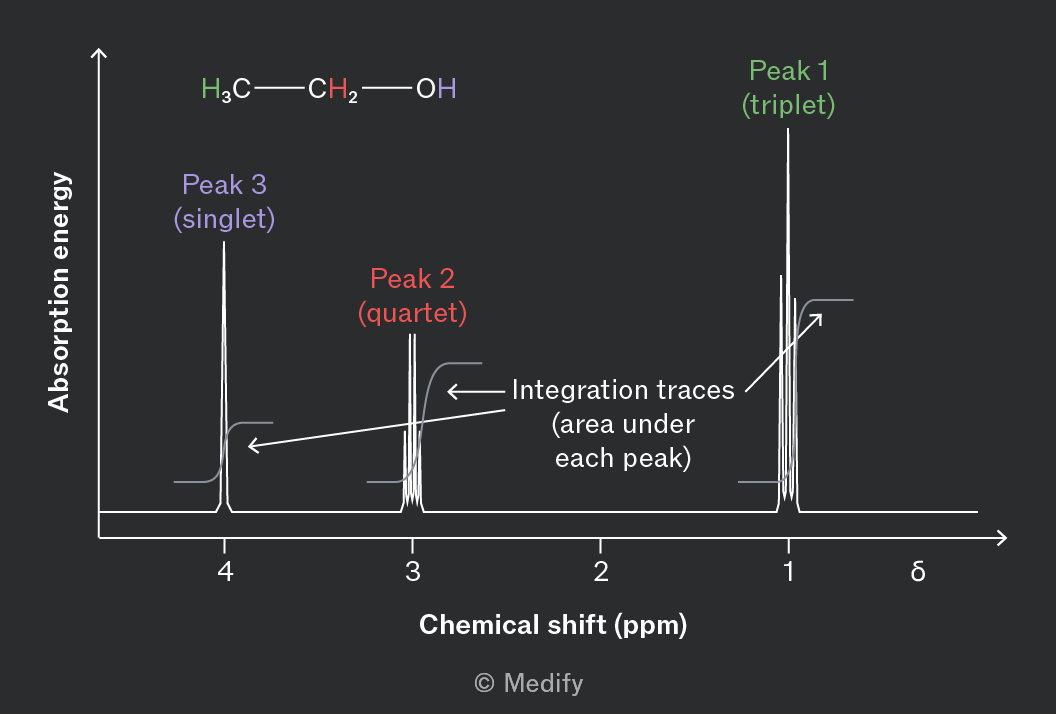
The signals causing peaks 1 and 2 are split by neighboring non-equivalent protons.
Peak 1 is in the region for . It shows three sub-peaks and is called a triplet. According to the rule, there must be two non-equivalent protons on adjacent carbons. The integration trace shows it is twice as intense as peak 3 and therefore represents two protons. The peak is from the protons being split by the protons.
Peak 2 is in the region for . It shows four sub-peaks and is called a quartet. According to the rule, there must be three non-equivalent protons on adjacent carbons. The integration trace shows it is three times as intense as peak 3 and therefore represents three protons. The peak is from the protons being split by the protons.
The protons stay uninfluenced by the spin-spin coupling effect, therefore peak 3 remains a singlet, characteristic of hydroxyl functional groups. This is only one proton so the integration trace represents one.
Identifying the number of non-equivalent proton environments tells you how many peaks to expect on a proton NMR spectrum.
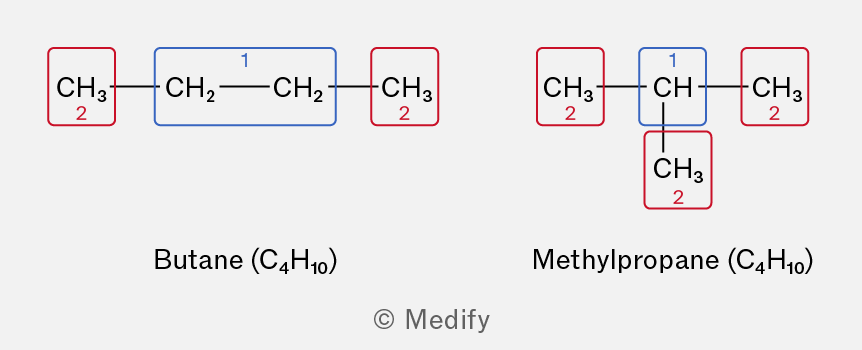
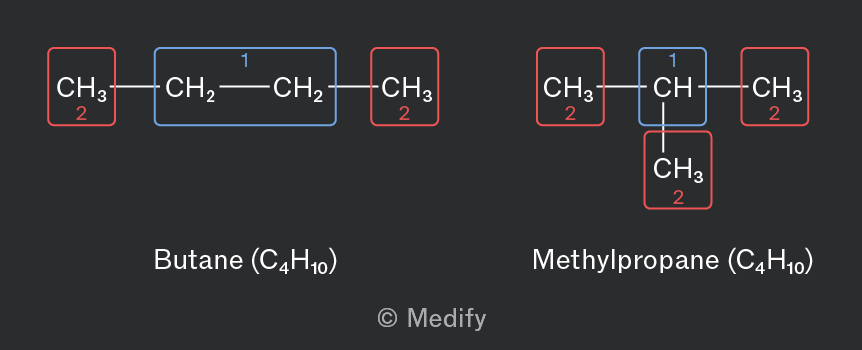
Both butane and its isomer methylpropane have two proton environments.
The number of protons in each environment, and therefore the integrated area under the peaks, is different.
Identifying whether neighboring proton environments are equivalent tells if splitting is expected in a proton NMR spectrum.
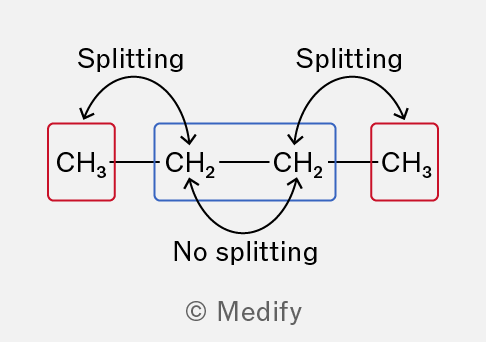
The neighboring groups in butane are in the same environment. They produce a combined signal which is split by the terminal protons forming a quartet.
Each is only split by the two neighboring protons, not the total number of equivalent protons in the environment. The peak produced is a triplet, not a multiplet.
The molecules below are sorted according to the number of non-equivalent proton environments they possess.
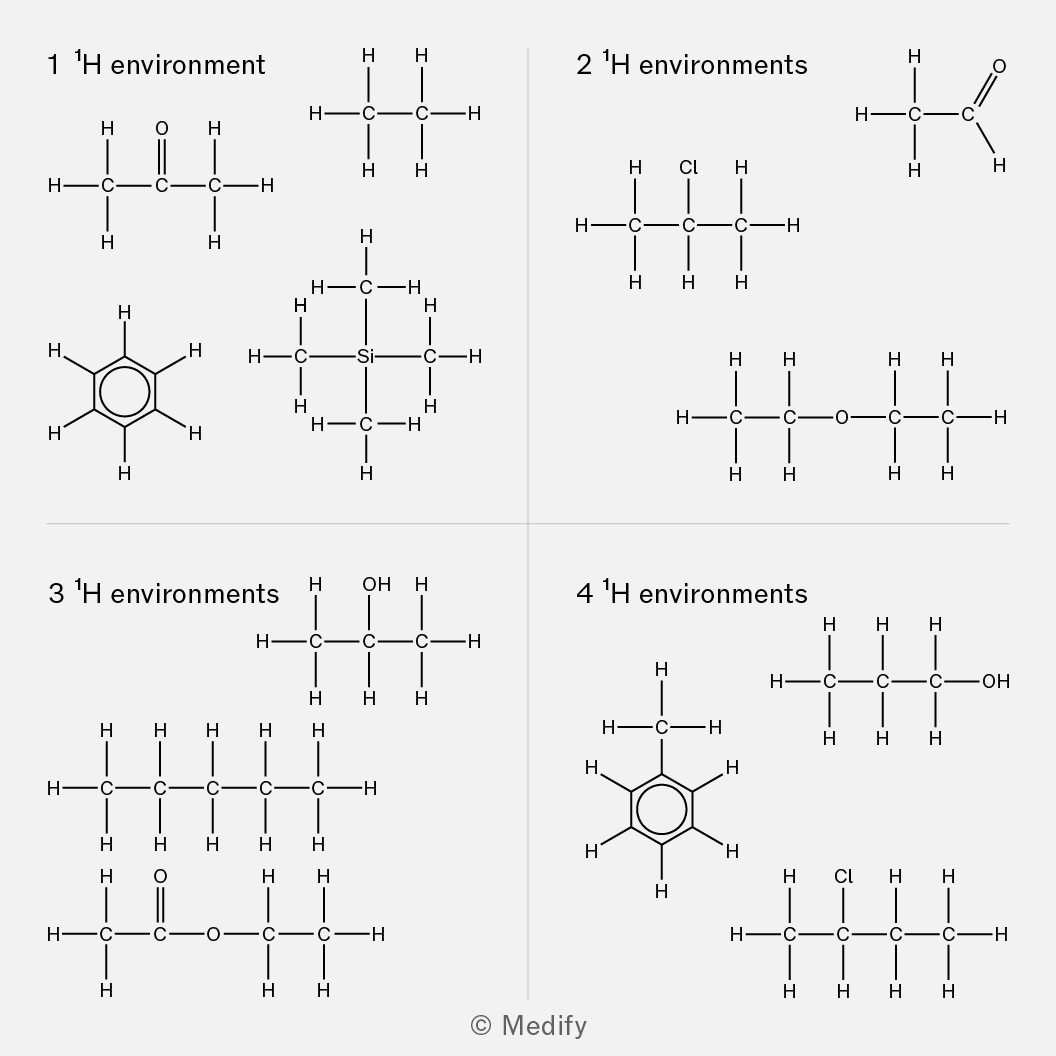
Note that:
- Asymmetry in esters and amides means that alkyl groups either side cannot be equivalent.
- Protons on alcohols and amines are counted although they are not visible on the NMR spectrum when is present.
- In aromatic compounds the ortho, meta and para positions are considered different environments.
Using skeletal displayed formula, in whole and especially in part, can lead to difficulties in counting protons and equivalent proton environments.
Tetramethylsilane (TMS) is used as the standard reference for chemical shift measurements in NMR spectroscopy.
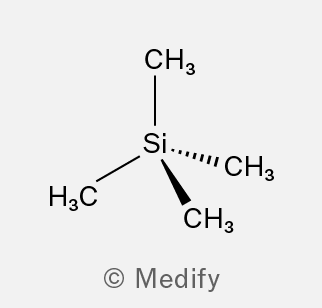
TMS is ideal as a standard reference because it has four equivalent carbon and proton environments, which is why it gives a single, sharp absorption peak on the NMR spectrum.
The sample is mixed with a drop of TMS. The TMS peak is assigned an arbitrary value of 0 at the far right of the spectrum. The chemical shifts of all other peaks are recorded relative to the TMS peak, the shift increases in value going left.
Silicon has a low electronegativity compared to carbon, hydrogen, oxygen, and nitrogen and so allows more nuclear shielding in TMS than in most test samples. Most other groups therefore absorb at a frequency higher than TMS and appear to its left on the spectrum.
Deuterium is an isotope of hydrogen with a neutron in its nucleus. It has the relative isotopic mass of 2 and is written as or .
The nucleus of deuterium is not active in NMR spectroscopy; it does not possess a net non-zero magnetic moment.
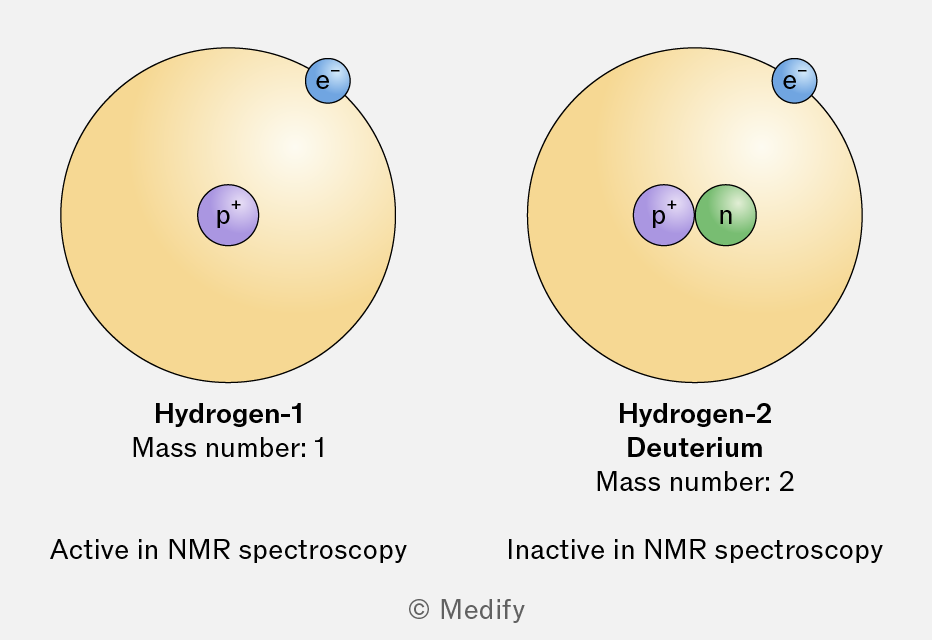
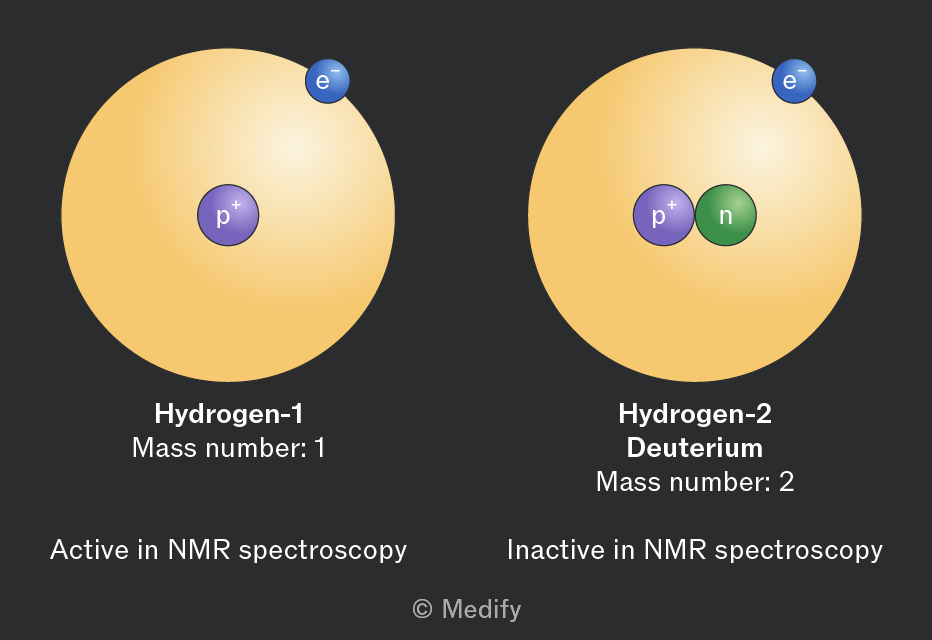
In NMR spectroscopy, the solvent used for dissolving the sample must not contain any spin active nuclei as these would produce signals obscuring those of the test sample.
Deuterated solvents are used. Deuterated means all the atoms have been replaced with NMR inactive atoms.
Commonly used solvents for NMR are deuterated trichloromethane , deuterated dimethylsulfoxide and deuterated water .
Protons directly attached to oxygen atoms (e.g. in the group) or nitrogen atoms (e.g. in the group), are sometimes referred to as a labile proton. These protons exchange with other labile protons in the sample or solvent, to varying degrees.
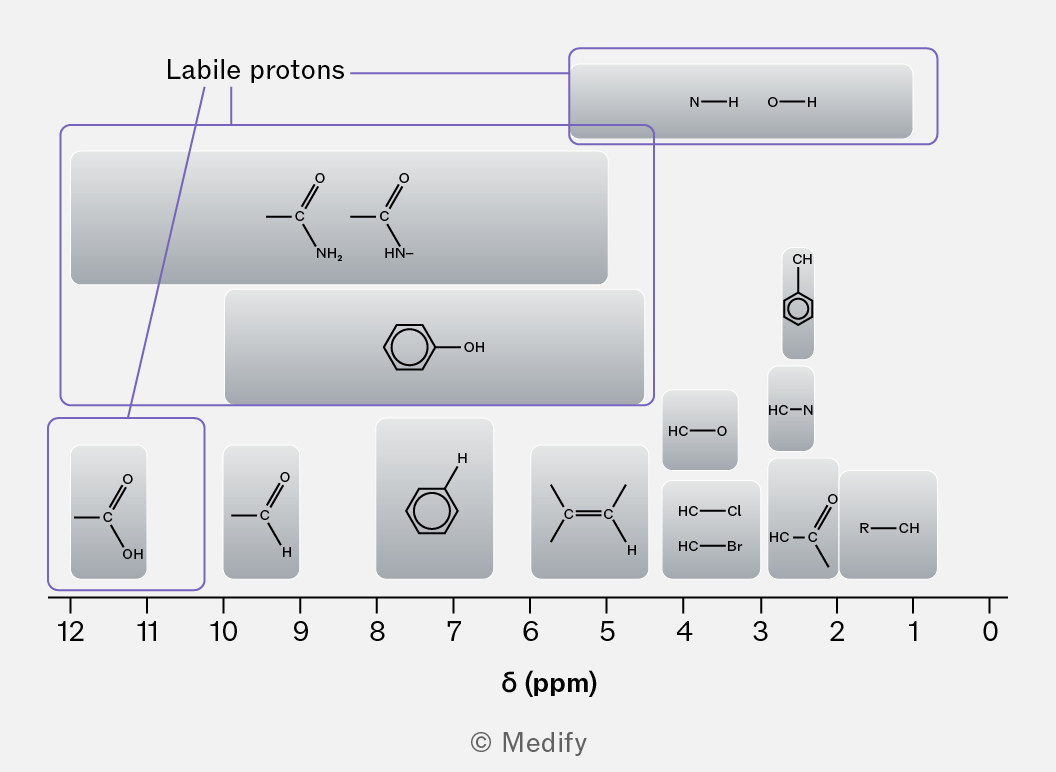
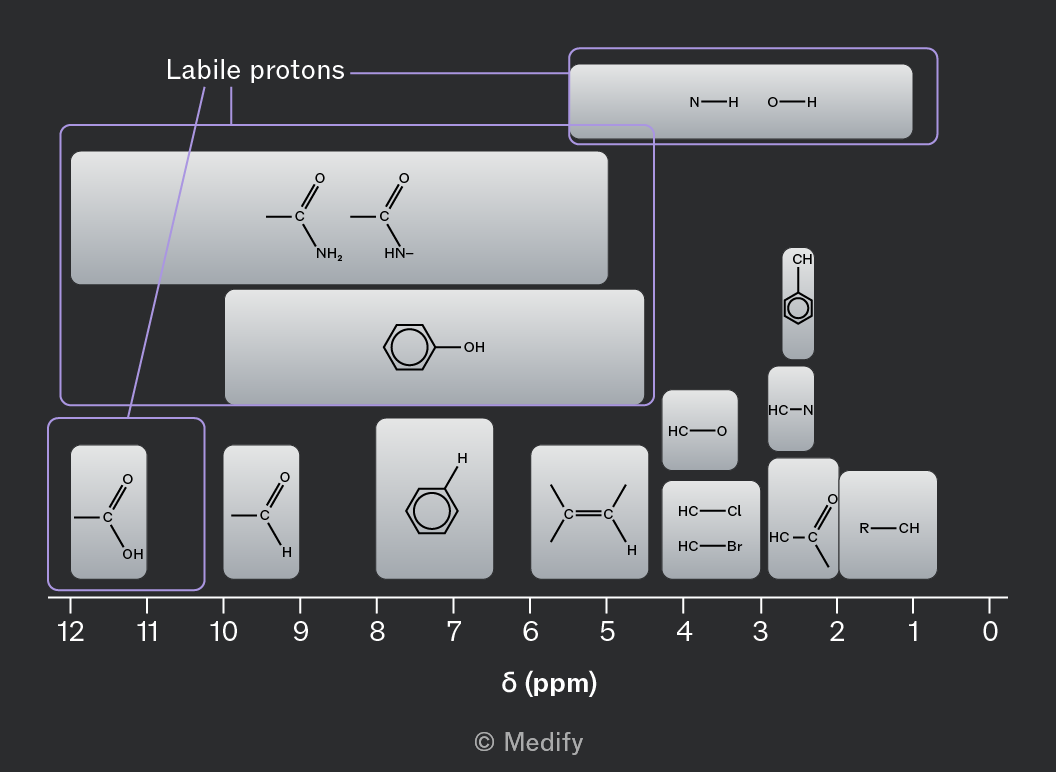
Labile protons:
- Usually show as shorter, broader peaks on an NMR spectrum.
- Do not usually cause the splitting of the peaks of adjacent protons.
- Do not usually have their signals split by adjacent protons.
- Have a wide range of possible chemical shifts – this changes heavily with solvent and sample concentration.
In order to get definite evidence of labile and protons in the sample, the proton exchange method can be used.
- A proton NMR spectrum is obtained in deuterated organic solvent.
- A small volume of deuterated water () is added and the mixture is shaken.
- A second spectrum is obtained.
- Peaks no longer present in the second run are linked to labile protons from or .
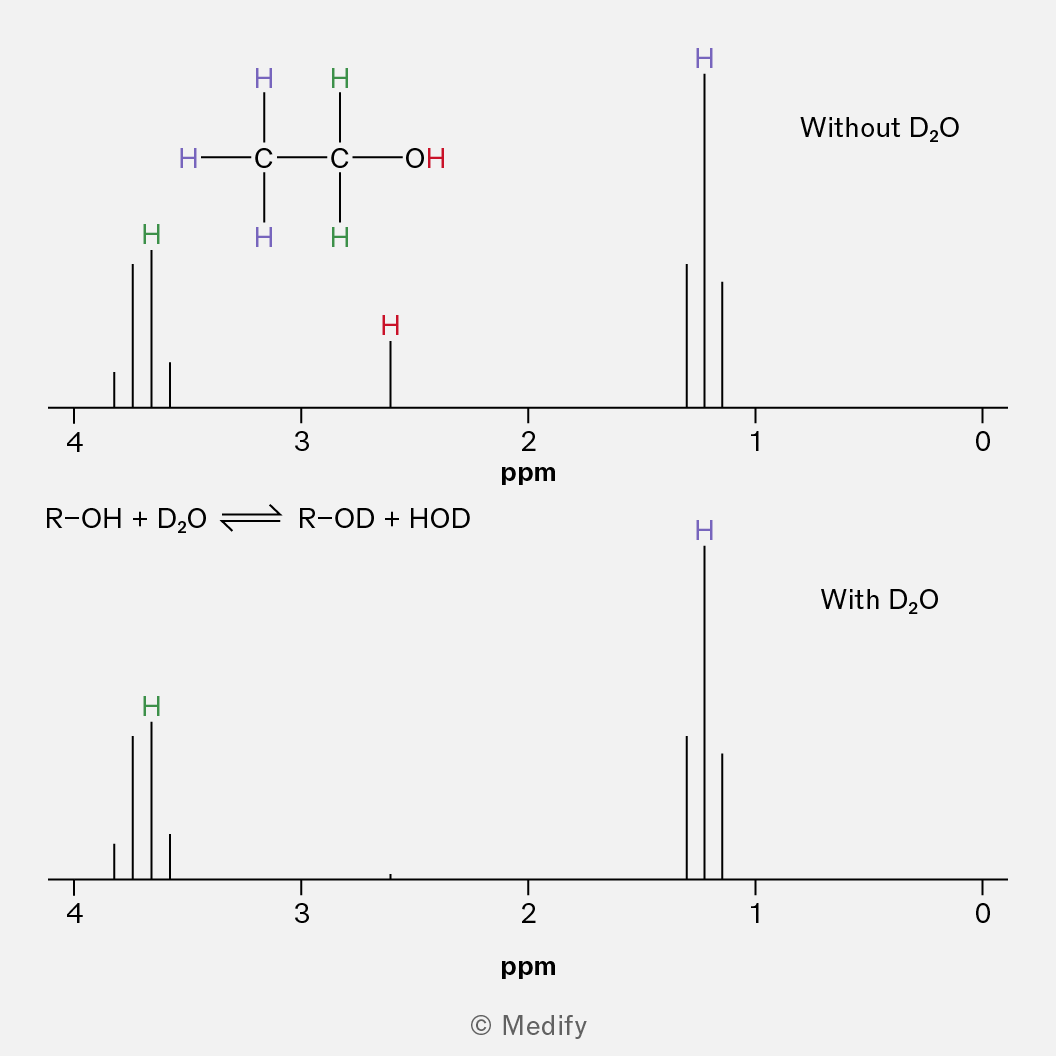
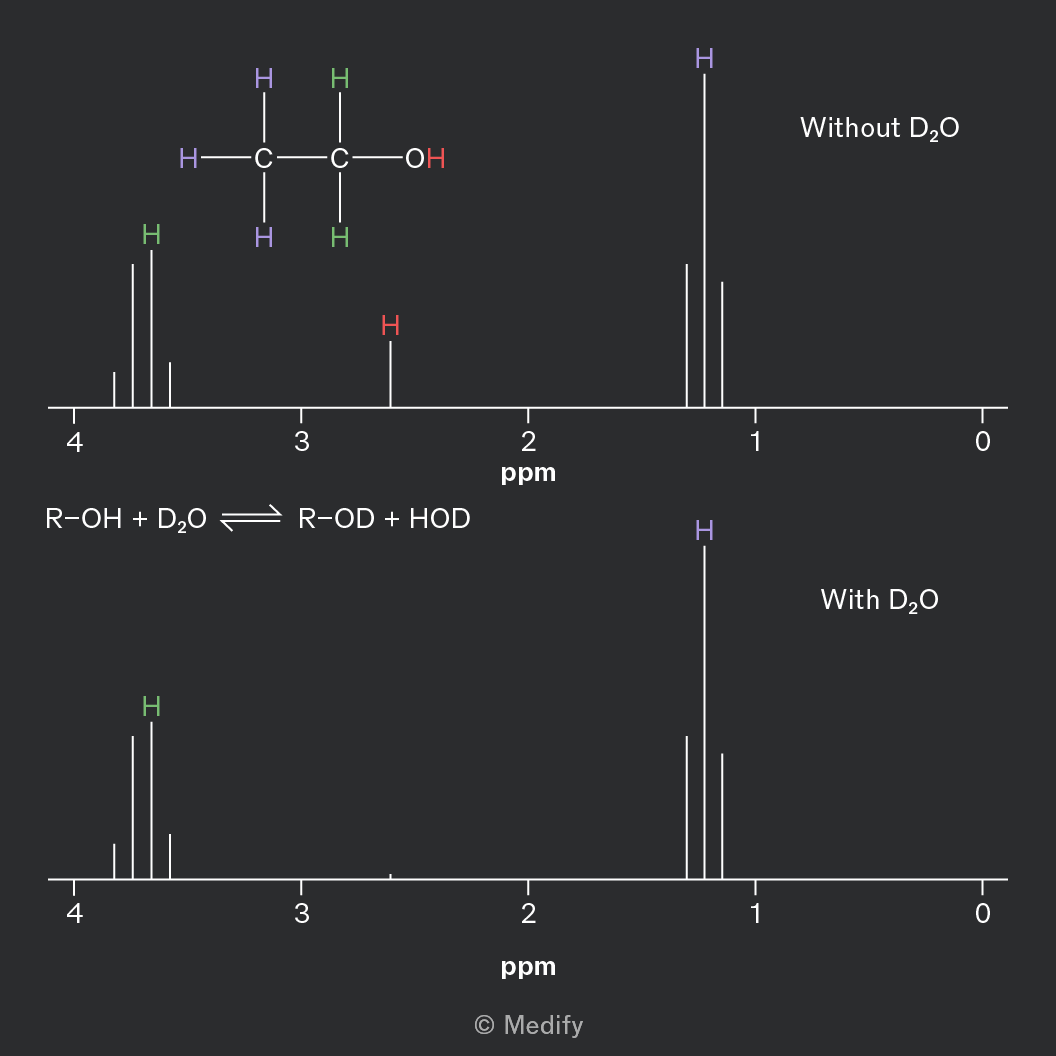
Deuterium, from , exchanges with the or protons in the sample. As deuterium is not visible on NMR the deuterated groups, or are not detected.