
Biological measurement (3.10.3)
On this page
The heart contains four chambers:
- The right atrium receives deoxygenated blood from the body through the superior and inferior vena cavae.
- The right ventricle receives deoxygenated blood from the right atrium and sends it to the lungs through the pulmonary artery.
- The left atrium receives oxygenated blood from the lungs through the pulmonary vein.
- The left ventricle receives oxygenated blood from the left atrium and sends it to the body through the aorta.
Valves are located at the entrance and exit of the ventricles, each opening only one way to prevent blood from backflowing.
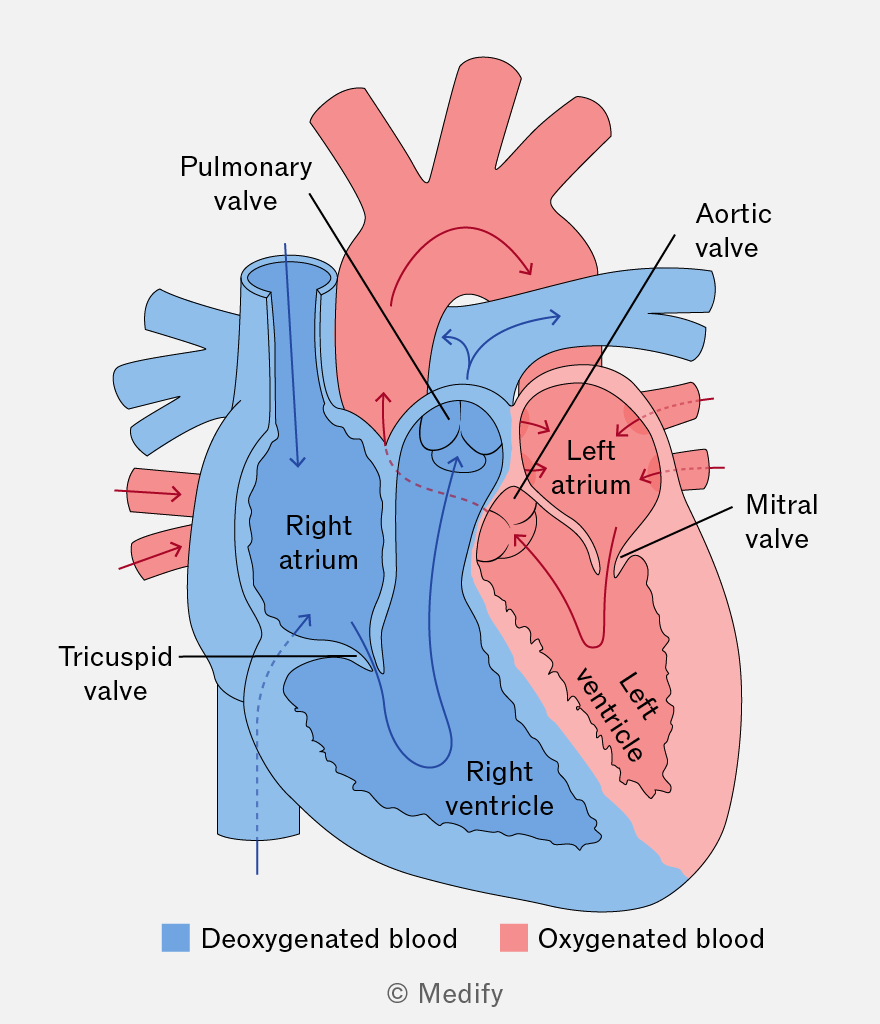
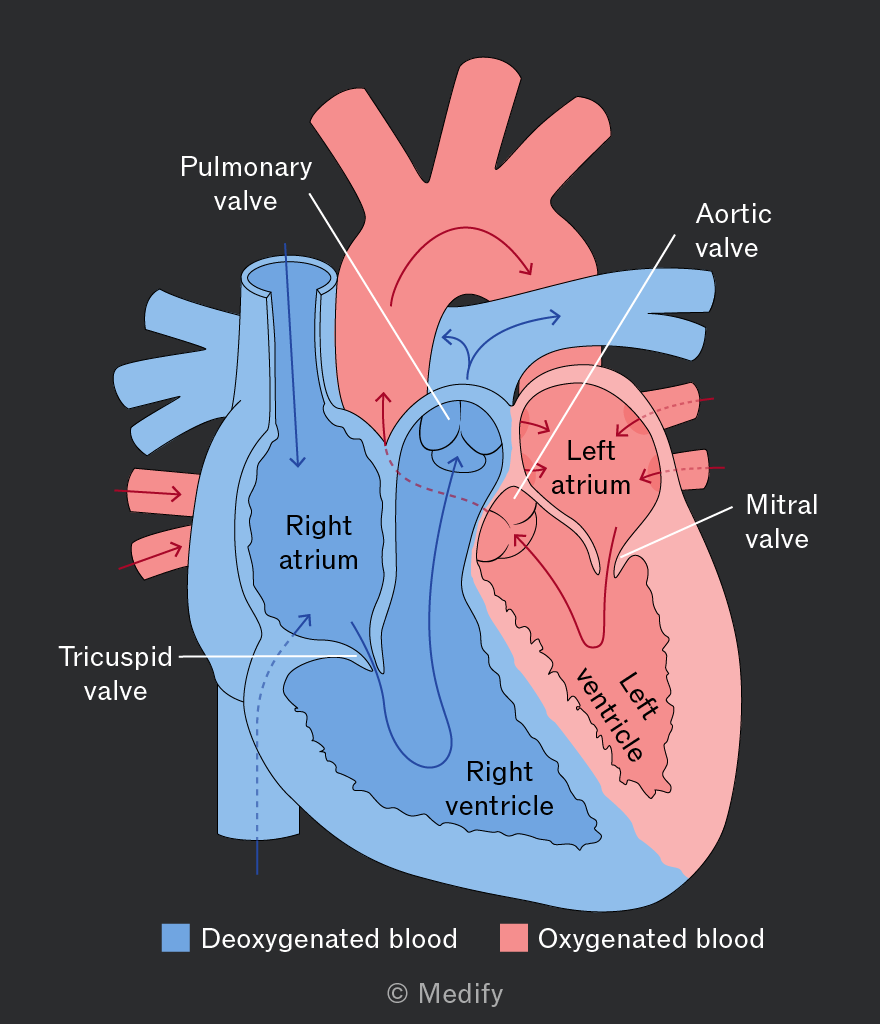
It’s important to note that you do not need to know detailed heart anatomy in this course. However, a basic understanding how the heart functions will help you grasp electrocardiography.
The heart generates its own electrical signals through a cluster of specialised cells located in the right atrium, known as the sinoatrial node.
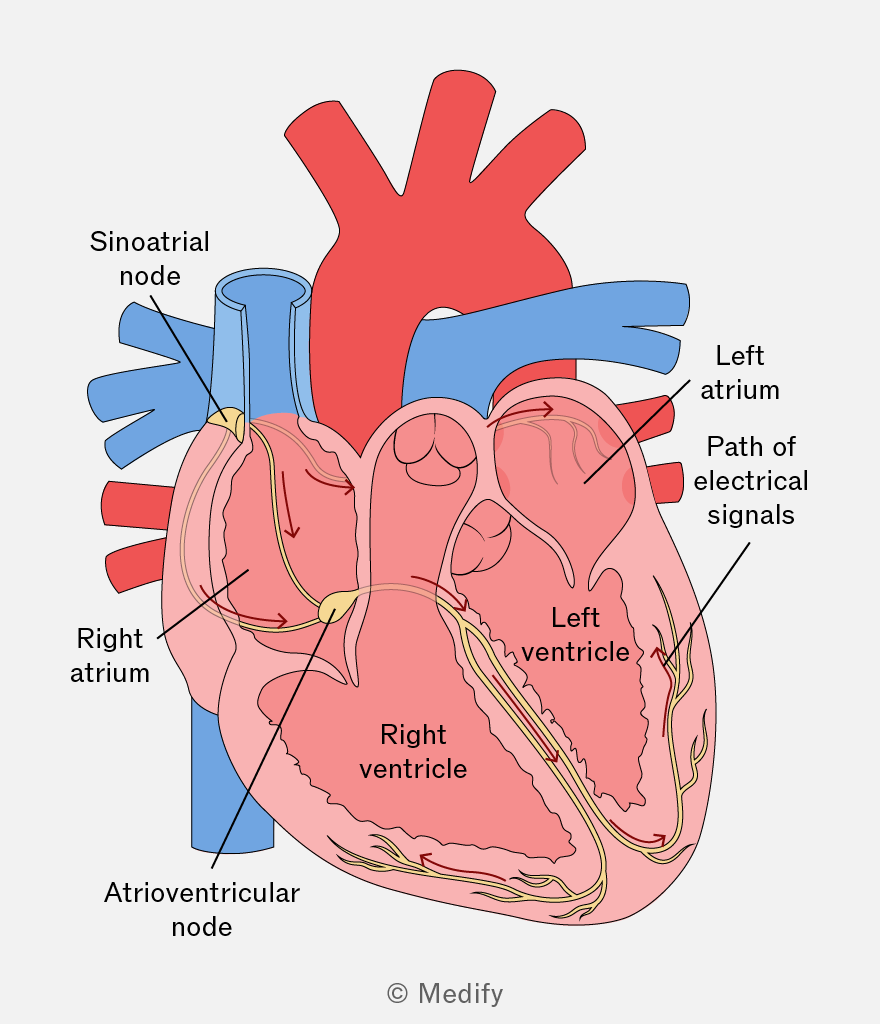
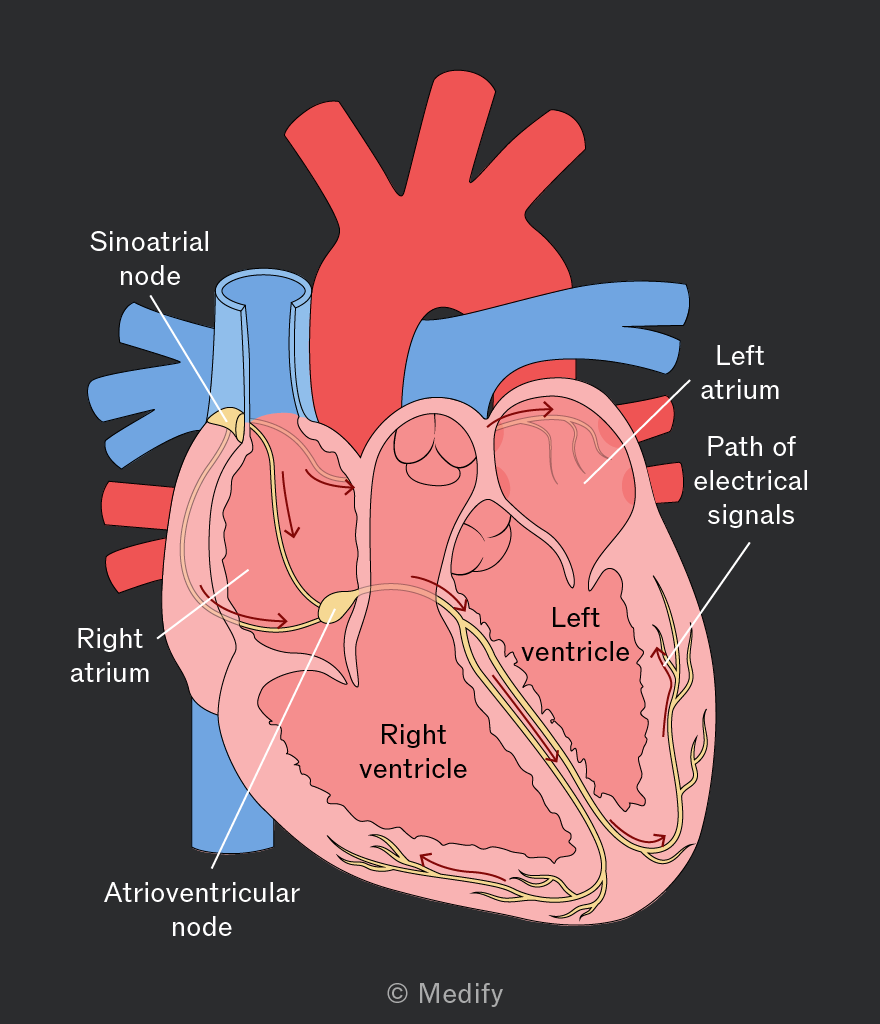
The diagram above shows the chambers of the heart where these electrical signals are generated:
- When at rest, the sinoatrial node in a healthy human adult produces electric signals about 60 to 100 times per minute.
- The electrical signals spread through the left and right atria, signalling them to contract and send blood into the left and right ventricles.
- The signals spread to the ventricles via the atrioventricular node, delaying the pulse by approximately to prevent simultaneous contraction of the atria and ventricles.
- The left and right ventricles contract and pump blood out of the heart.
This process offers a simplified explanation of the human heartbeat.
An electrocardiograph can weakly detect the electrical signals generated in the heart on the body’s surface.
This device detects the signals and plots the potential difference between electrodes placed on the body against time. This is an electrocardiogram (ECG).
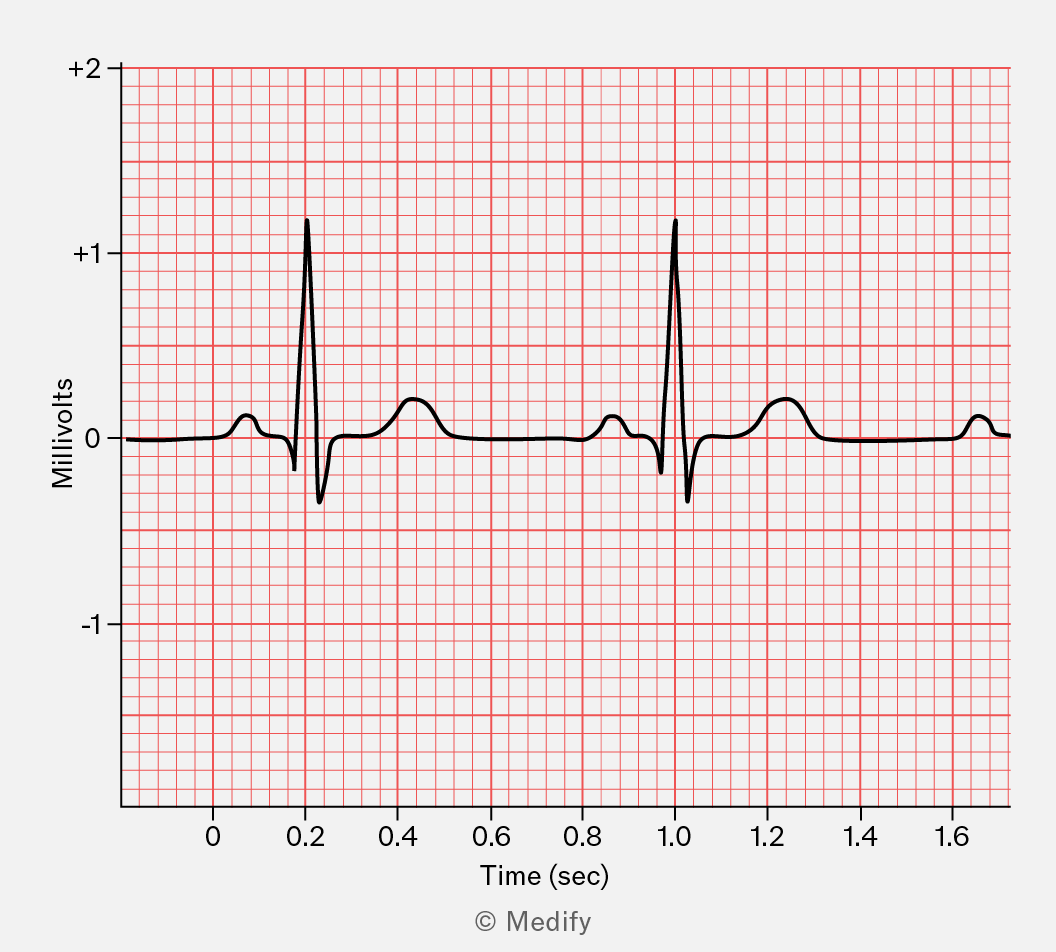
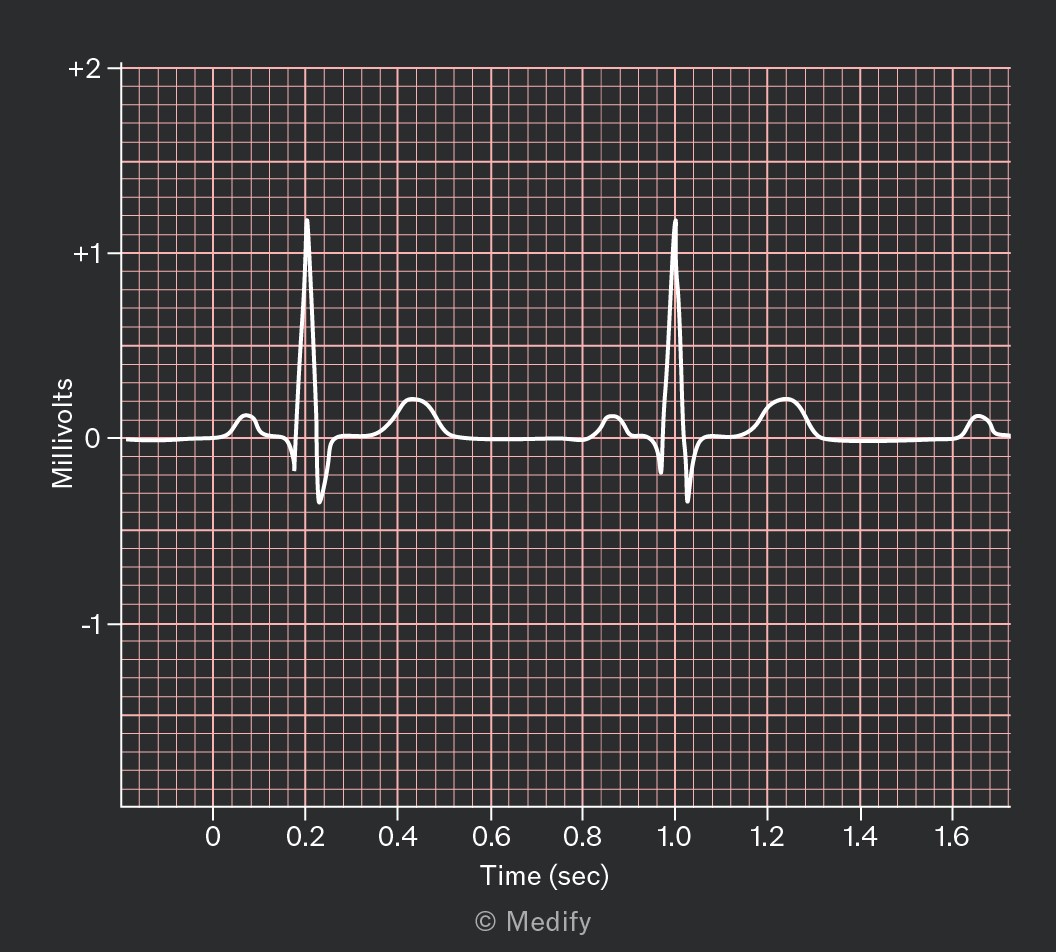
The diagram below shows an example of an electrocardiogram.
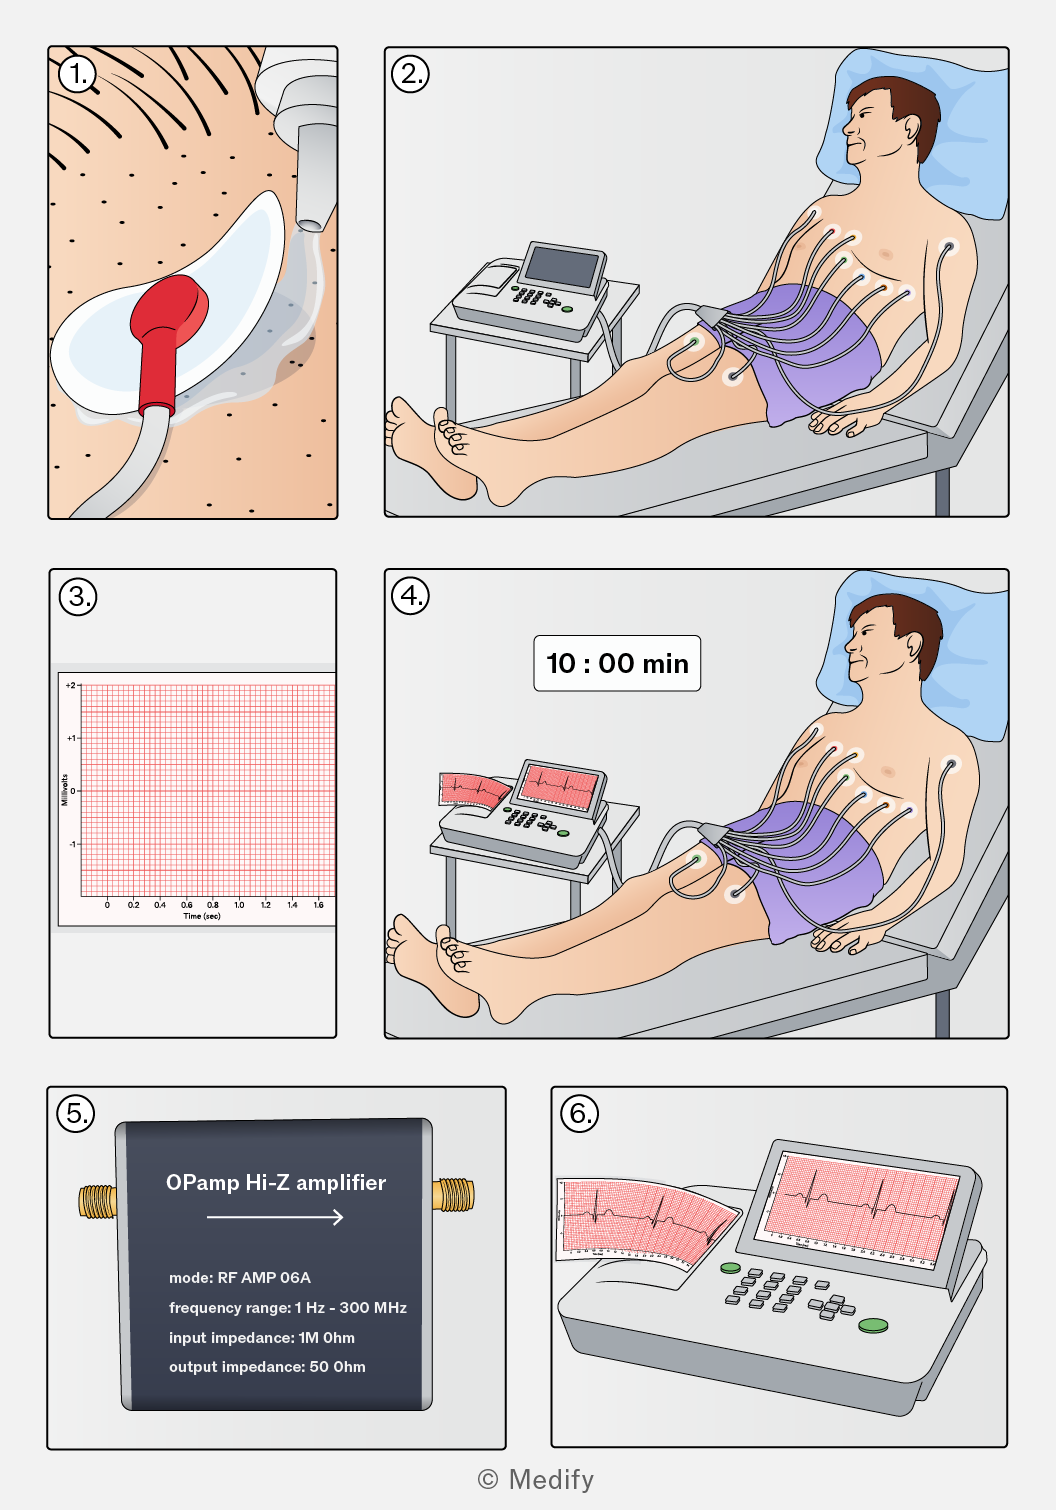
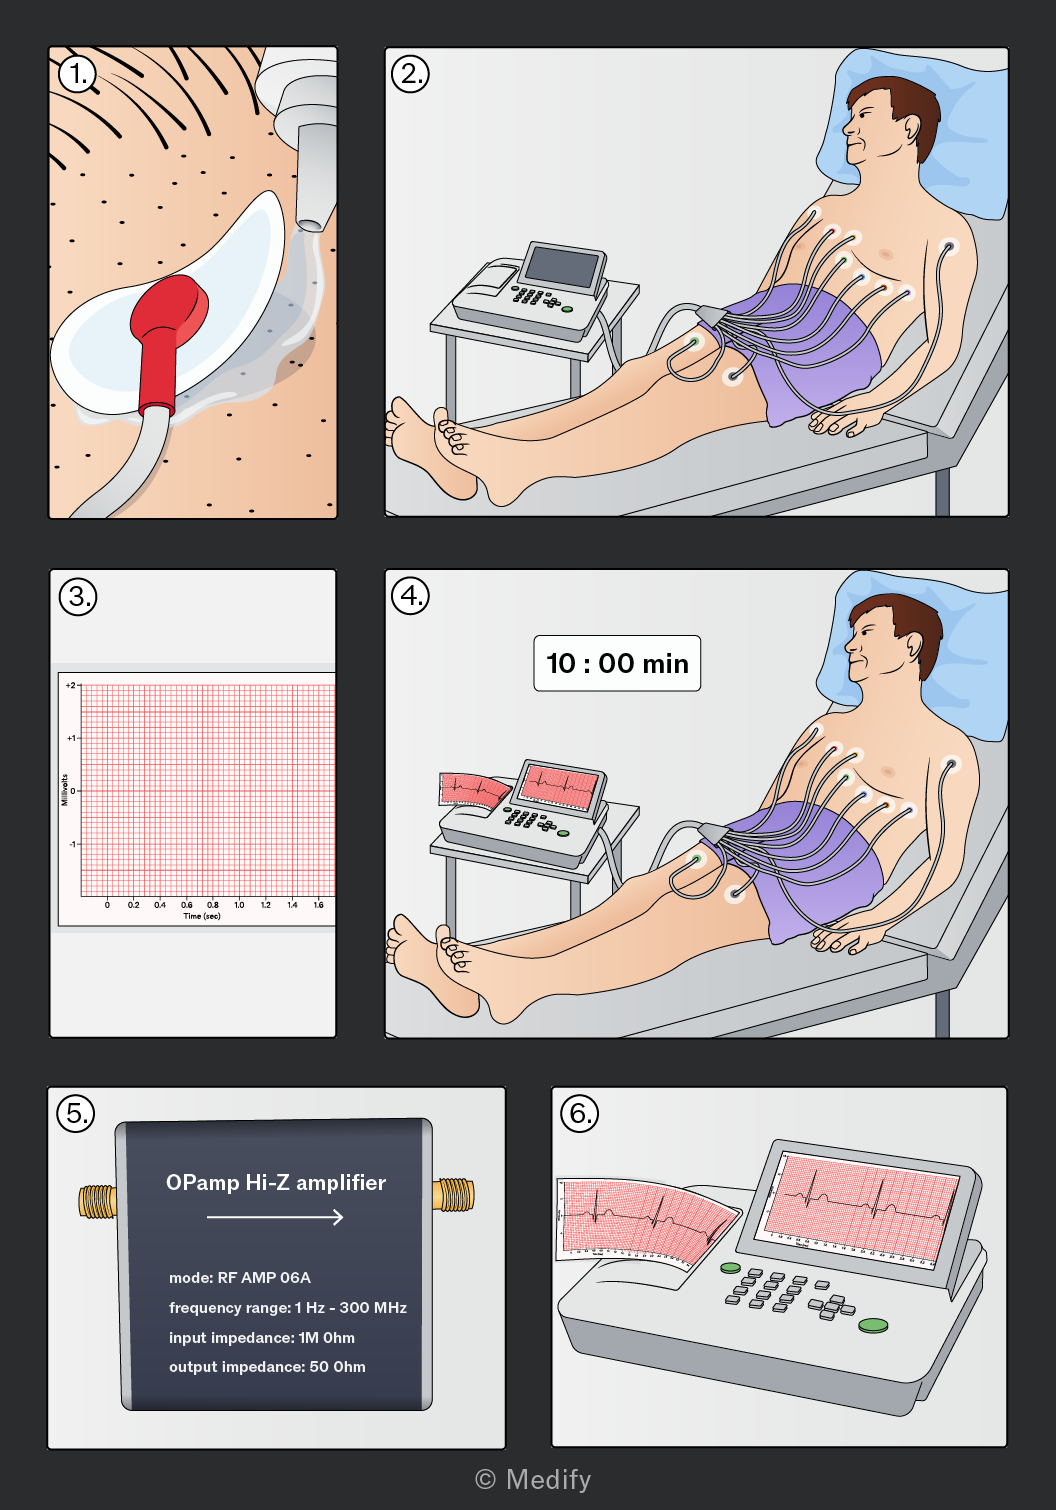
Steps in obtaining an electrocardiogram (ECG):
- To reduce any electrical resistance between the electrodes and skin, hair and dead skin cells are removed, and a conductive gel is applied.
- Electrodes are placed in specific locations on the body, close to the heart. Electrodes are placed on the chest (closest to the heart) and the limbs (where the arteries are close to the surface).
- The potential difference between the electrodes is measured over time.
- Patients are required to remain still for approximately 10 minutes to reduce any unwanted signals. The wires connecting the electrodes are also shielded from any A.C. sources to avoid possible interference.
- The body significantly attenuates the signals by absorbing some of them. Therefore, the signals are amplified by a high-impedance amplifier.
- An ECG is produced for doctors to examine and assess the heart’s health.
An electrocardiogram (ECG) is a graph of the electrical activity of the heart that doctors use to assess its health.
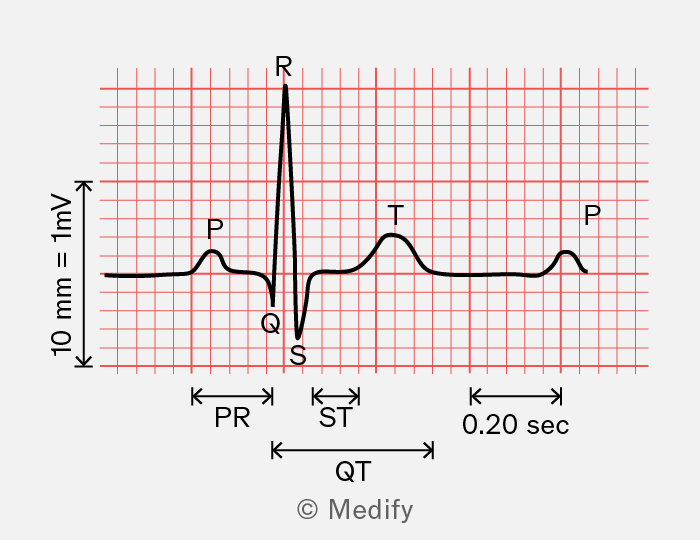
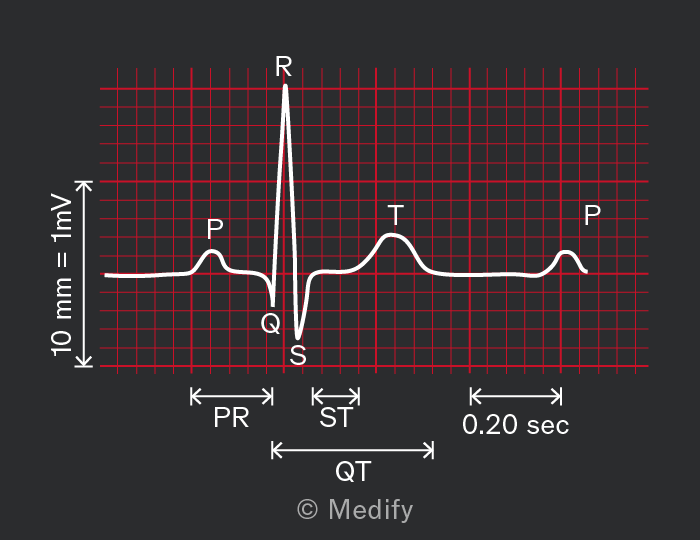
Every ECG contains three distinct waves in a single heartbeat:
- P wave: This is the moment where the electrical signal is generated and causes the atria to contract.
- QRS wave: This is the moment where the ventricles contract and is a much larger signal than when the atria contract due to being larger chambers than the atria.
- T wave: This is the moment the ventricles relax and prepare to receive blood for the next heartbeat.
There is approximately between the peaks of the P wave and the QRS wave, called the PR interval.
It is important to note that the heart’s electrical signal has a delay. The atrioventricular (AV) node delay is the specific pause introduced by the AV node, which acts as a bottleneck before the signal reaches the ventricles. The PR interval is the total time from atrial to ventricular depolarisation, as measured on an ECG, and includes the AV node delay plus the signal travel time through the atria and the ventricles.
Question walkthrough
Biological measurement
,