X-ray imaging (3.10.5)
On this page
An X-ray tube is a device that produces X-rays. It consists of an evacuated glass tube containing an anode and a cathode. Under the influence of a high voltage source, electrons are quickly accelerated from the cathode toward the anode, where X-rays are produced.
The anode is typically made of tungsten. The target rotates while producing X-rays to efficiently dissipate the intense heat generated when high-speed electrons bombard it.
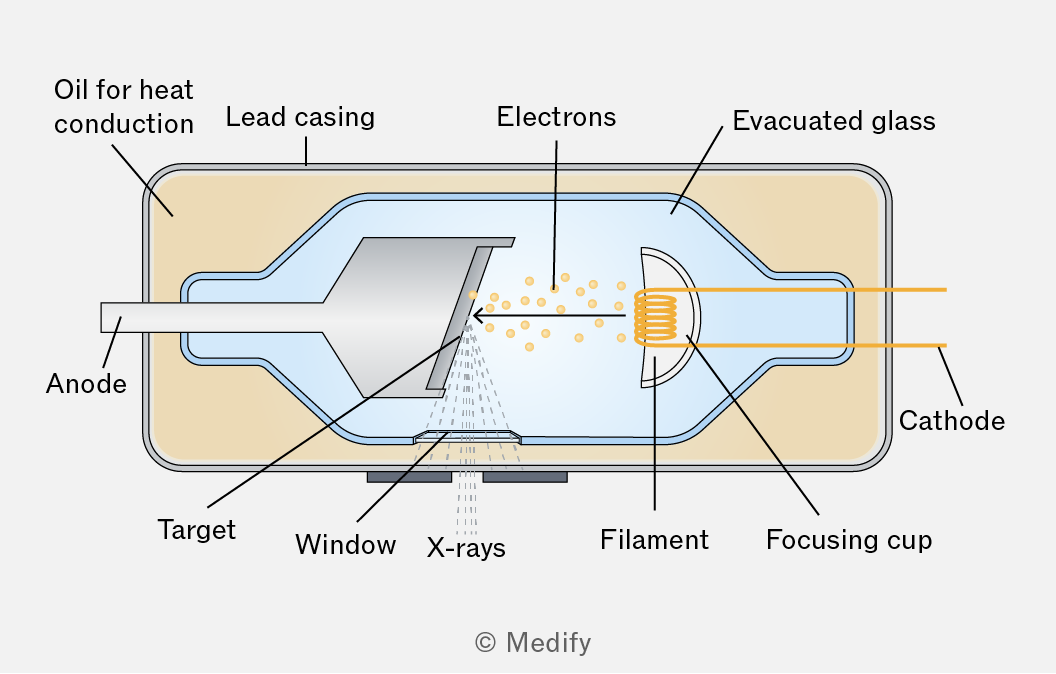
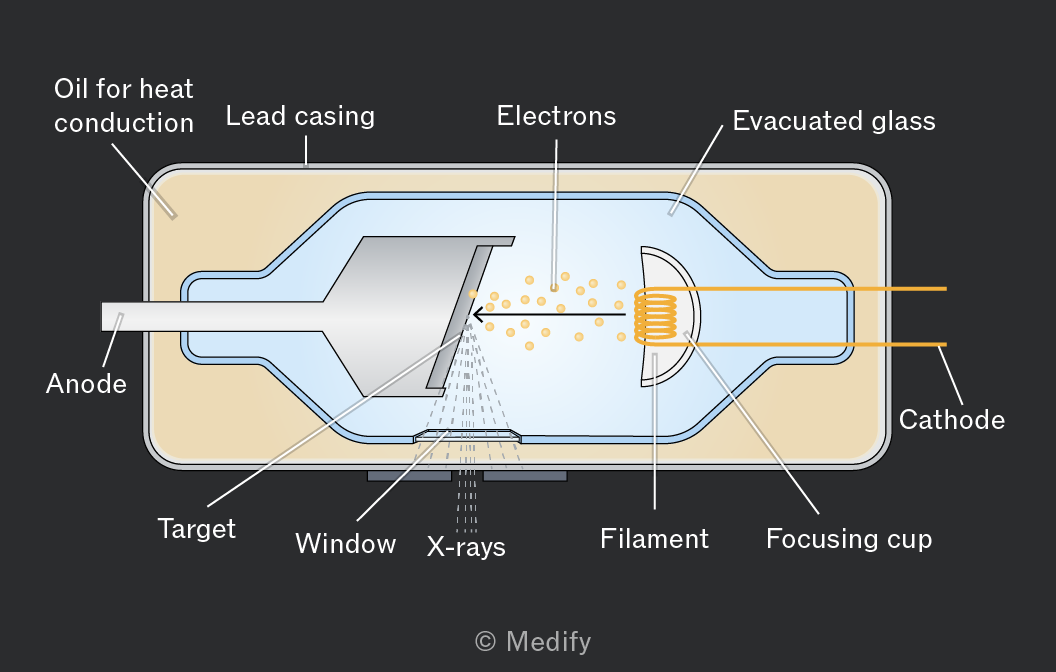
X-rays are produced in an X-ray tube by the following process:
- A current passing through the cathode generates electrons by thermionic emission.
- A potential difference between the cathode and anode accelerates the electrons.
- Electrons strike the rotating tungsten target at a high speed.
- The tungsten target partially or fully converts the electrons’ kinetic energy to X-rays in all directions.
X-rays are primarily generated at the tungsten target when high-speed electrons are incident on it. This occurs through two main processes:
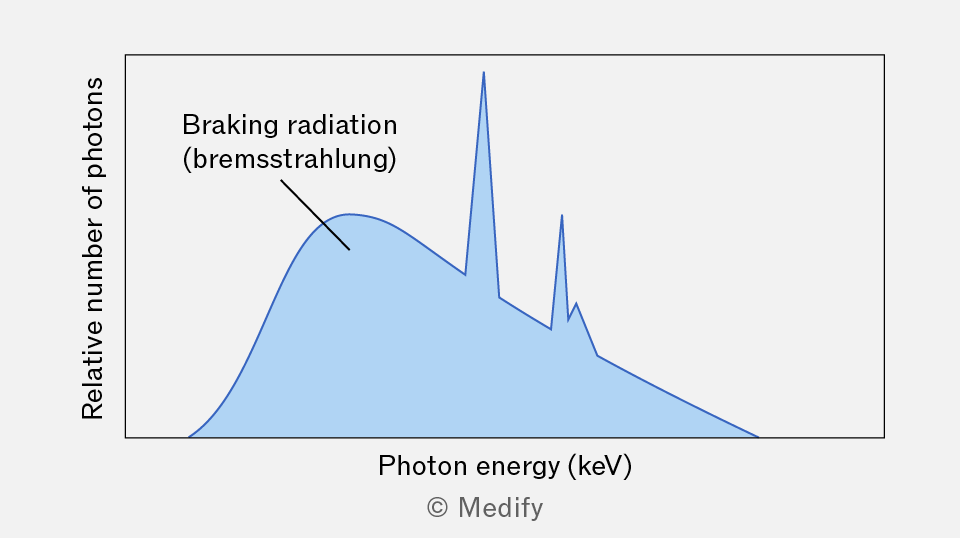
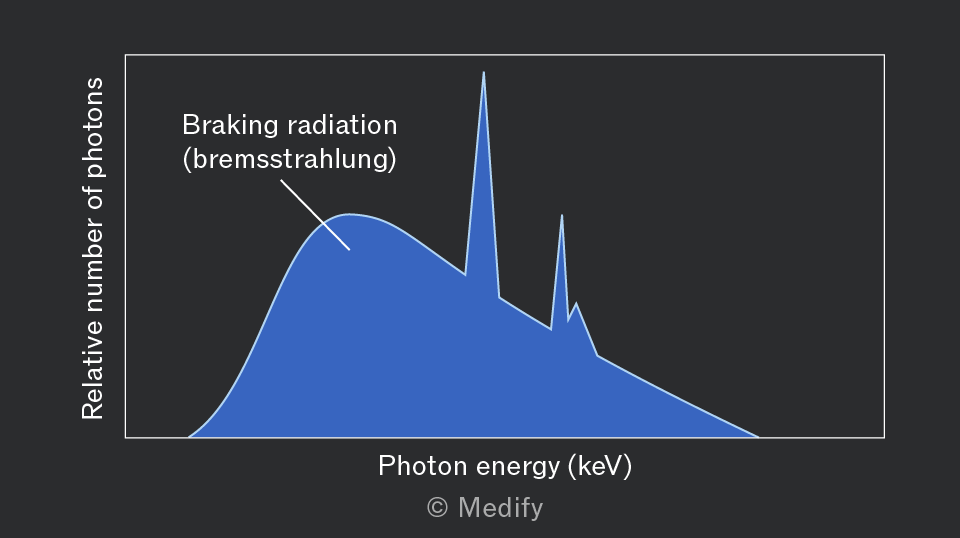
Fast-moving electrons incident on the target are rapidly decelerated by the electric fields of the tungsten atoms, producing X-rays known as Bremsstrahlung (braking radiation).
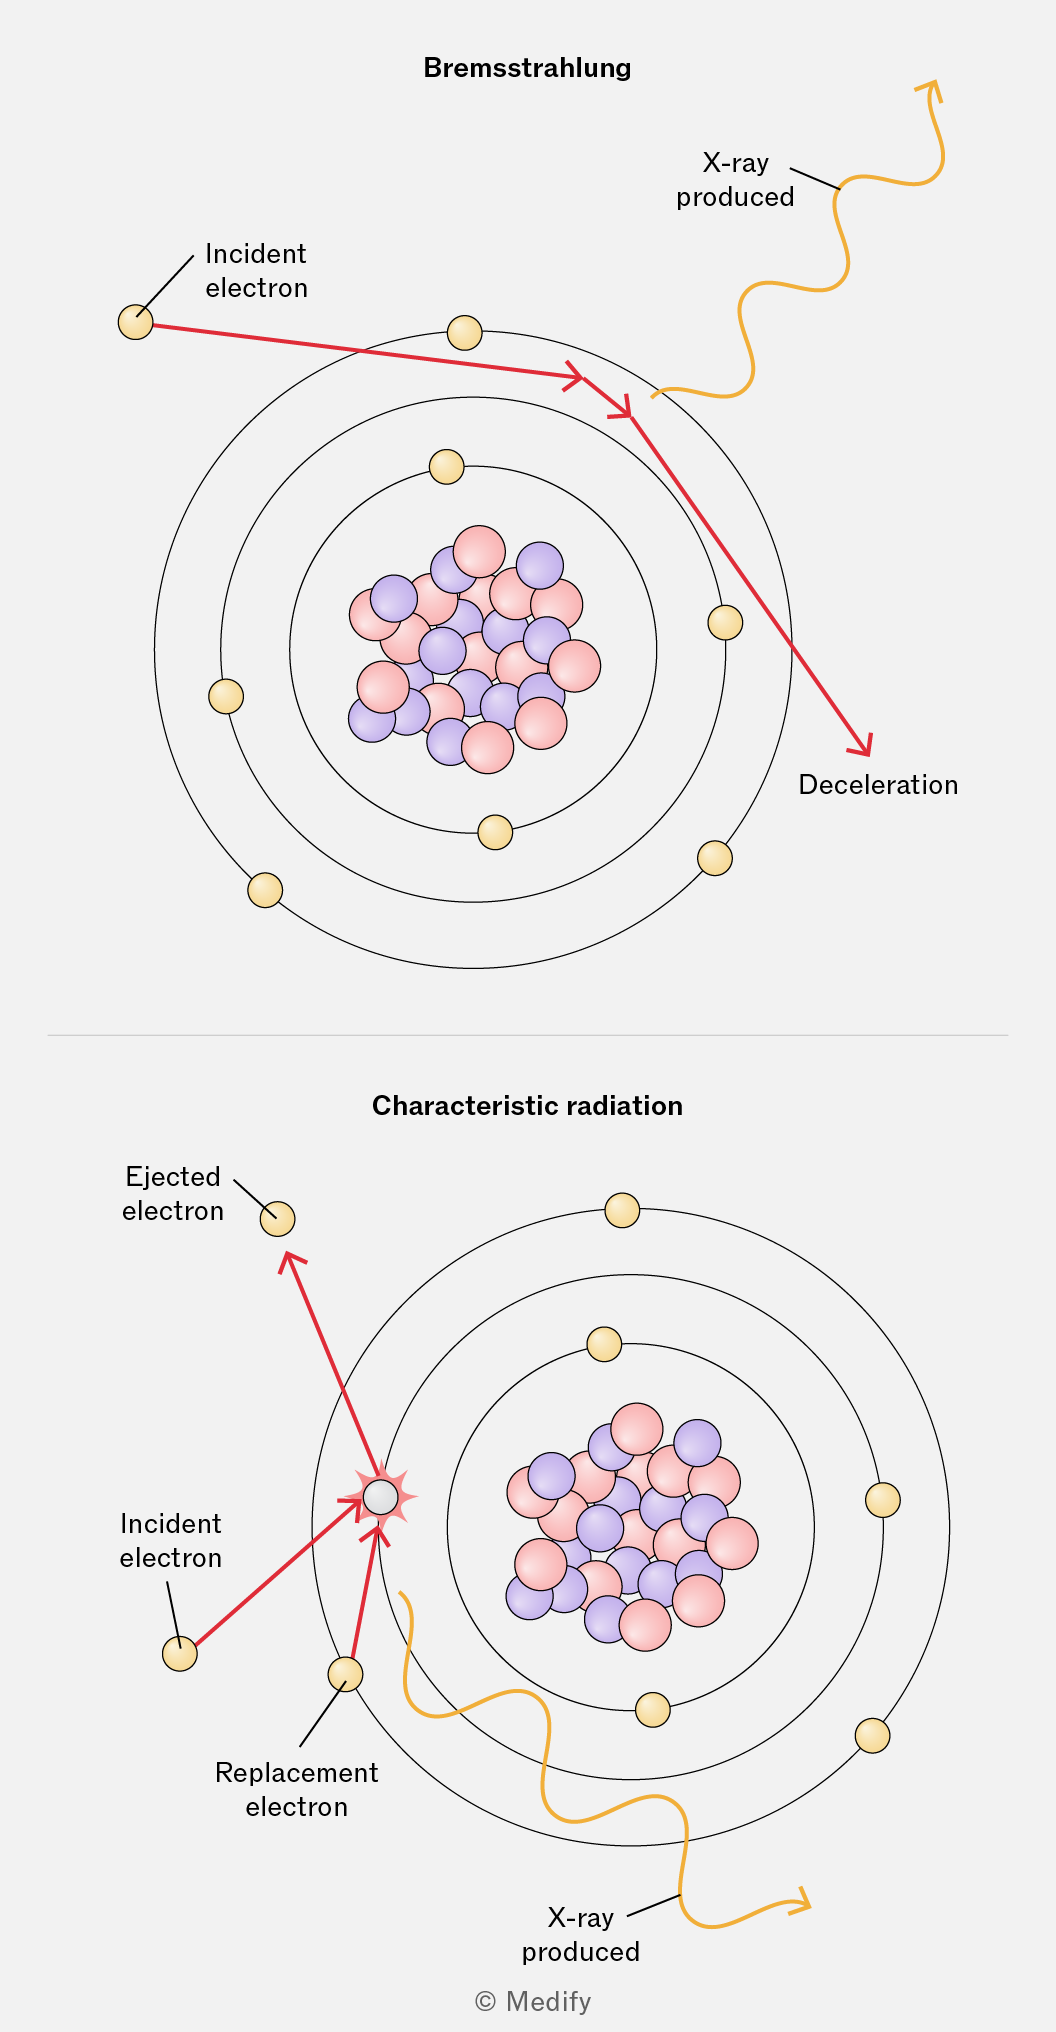
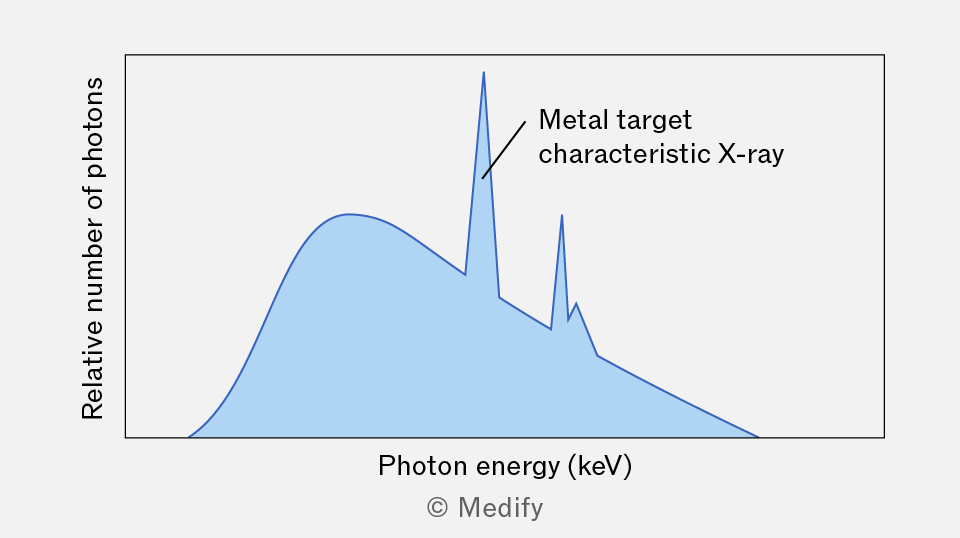
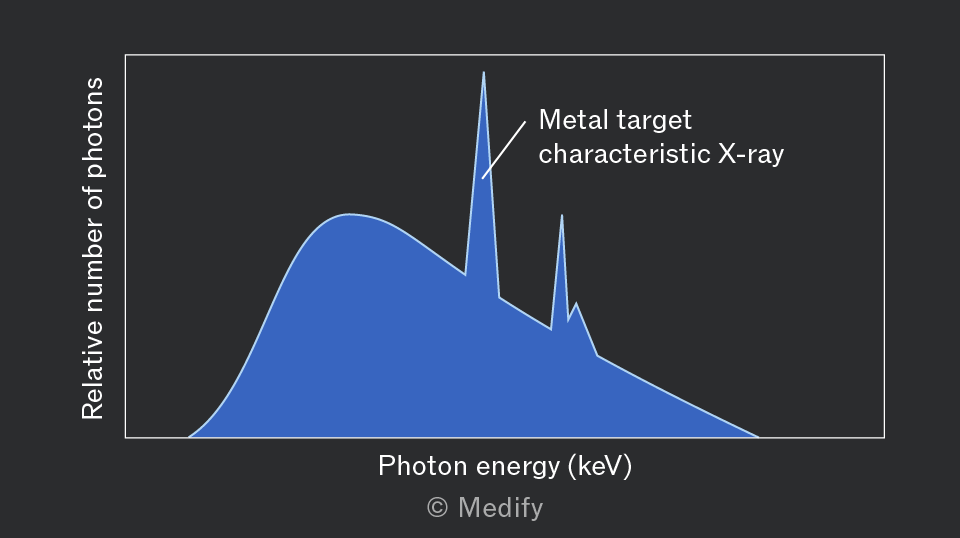
Fast-moving electrons incident on the target eject inner-shell electrons from tungsten atoms. When outer electrons in the same atom drop energy levels to fill their places, X-rays, known as characteristic radiation, are produced.
The X-ray spectrum produced by high-speed electrons striking a tungsten target is shown below.
Two observations can be made from the graph:
- A continuous spectrum of photon energy is produced by braking radiation.
- Sharp peaks at specific photon energies are produced by characteristic radiation.
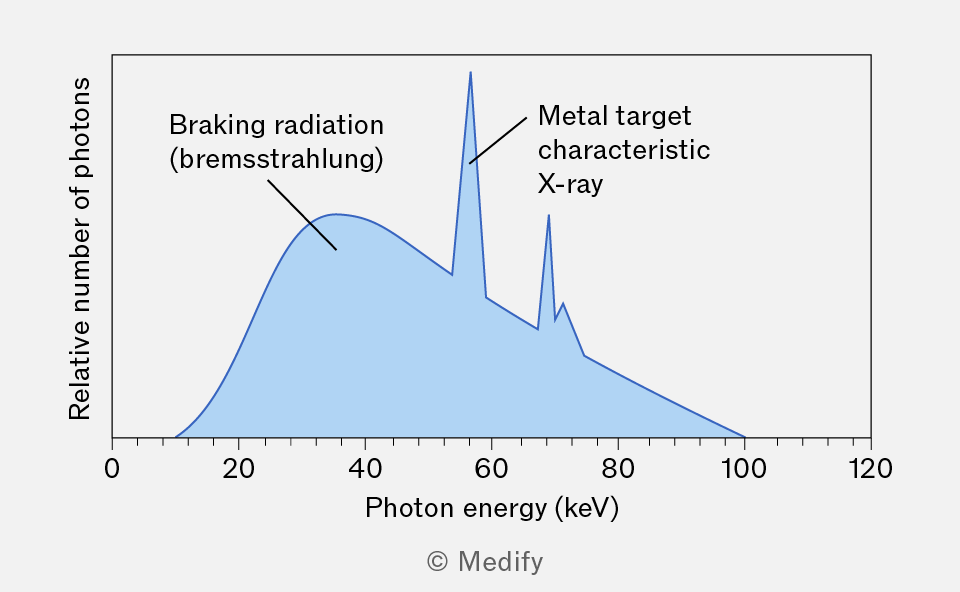
It is important to note that each metal produces distinct peaks at specific photon energies. If a metal other than tungsten is used, the characteristic radiation peaks would be at different energies. This property can be used to identify unknown metals from their X-ray spectra.
During the process that produces braking radiation, incident electrons can lose a fraction of their kinetic energy, meaning the emitted X-rays can have energies ranging from very low values to a maximum equal to the initial kinetic energy of the electron. The result is a smooth, continuous spectrum.
During the process that produces characteristic radiation, an electron ‘kicks out’ an electron in one of the atoms in the metal target. The vacant energy level is filled by an electron from a higher energy level, and the energy difference between the two levels is released as an X-ray.
Since electron binding energies in atoms are quantised and unique for each element, the emitted photons have discrete, fixed energies. As a result, characteristic radiation appears in the spectrum as sharp peaks at specific energy values.
The current in the cathode of an X-ray tube controls the number of X-ray photons produced (or intensity) at each specific photon energy. A higher current increases the number of X-rays produced, and thus a higher curve will be observed. However, the current does not change the overall shape of the spectrum.
The voltage between the cathode and anode (tube voltage) controls the maximum energy of X-rays produced. A higher voltage produces X-rays with a higher maximum energy.
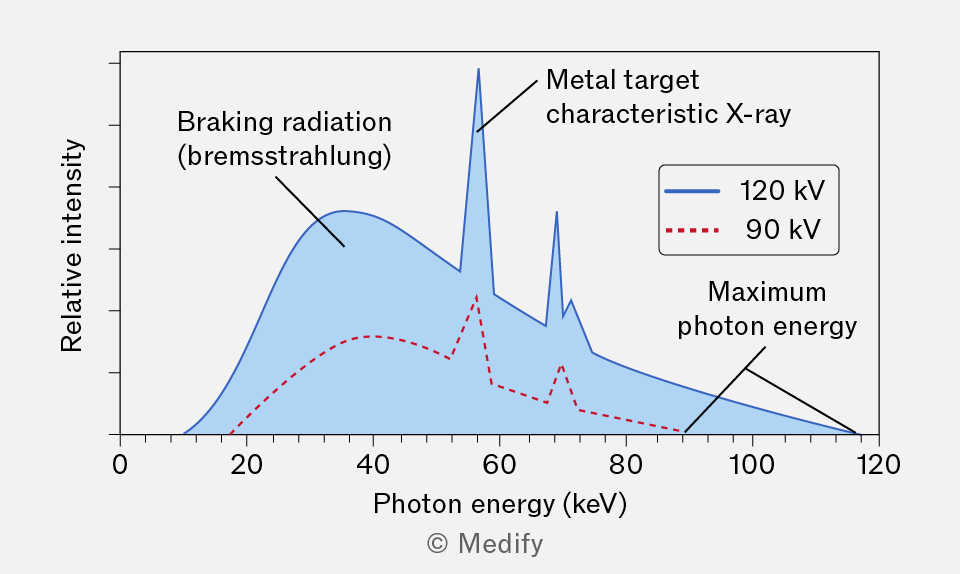
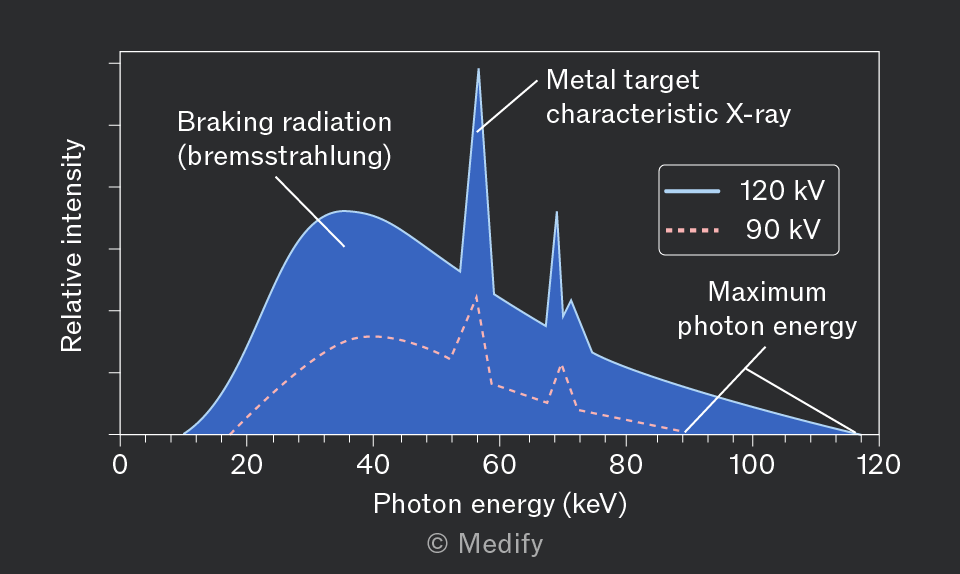
The graph displays the X-ray spectrum generated when fast electrons hit an unknown metal target, with data presented for two distinct tube voltages:
- A tube voltage of 120 kV produces a curve (in blue) with greater photon energies than a tube voltage of 90 kV (in red).
- A tube with a high cathode current (in blue) produces a curve with higher intensity than one with a low cathode current (in red).
The maximum energy of the X-rays produced by an X-ray tube relates to the potential difference applied between the anode and cathode. When electrons are accelerated by a potential difference, they gain kinetic energy :
Where:
- is the electron charge, and
- is the potential difference in
In an X-ray tube, the kinetic energy of the electrons is converted to X-rays at the tungsten target. If all of an electron’s kinetic energy is converted into producing an X-ray, then the maximum energy an X-ray can have equals:
Knowing that the energy of an X-ray photon is equal to:
Where:
- is Planck’s constant,
- is the speed of light,
- is the X-ray frequency, and
- is the X-ray wavelength.
Therefore, the maximum frequency and the minimum wavelength , respectively of an X-ray produced by an X-ray tube in terms of the potential difference is:
Question walkthrough
Determining X-ray tube voltage from spectra
Uses the cut-off wavelength of each continuous X-ray spectrum to find maximum photon energy (E = hc/λ) and the corresponding tube voltage (E = eV), then uses matching characteristic-radiation peaks to identify the shared target metal.
X-rays are used in medicine to produce an X-ray image of a patient, who is placed between an X-ray tube and a detector.
Traditionally, X-ray images were produced on photographic film, as shown below.
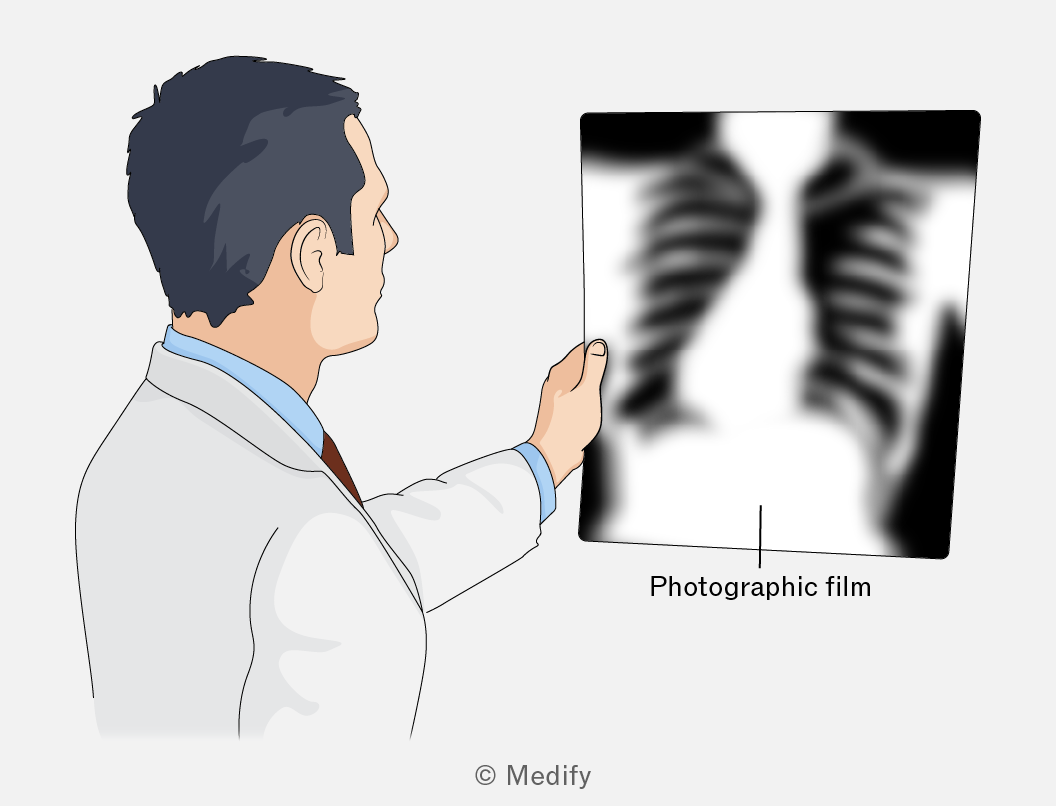
Photographic films are light‑sensitive materials that were used to record X‑ray images. The film has a coating with tiny crystals that interact with X‑rays. When the film is placed in developing chemicals, the exposed crystals turn dark, while the parts that were not hit by X‑rays stay light. This creates the black‑and‑white X‑ray image, where bones appear white and soft tissues appear darker.
An intensifying screen cassette contains two fluorescent screens that sandwich a sheet of photographic film.
- X-rays transmitted through a patient’s body enter the cassette front (X-ray transparent), are absorbed by the fluorescent screens and re-emitted as multiple visible light photons.
- These visible light photons expose the photographic film, producing the image.
- Lead foil lines the cassette back to prevent any transmission of harmful X-rays.
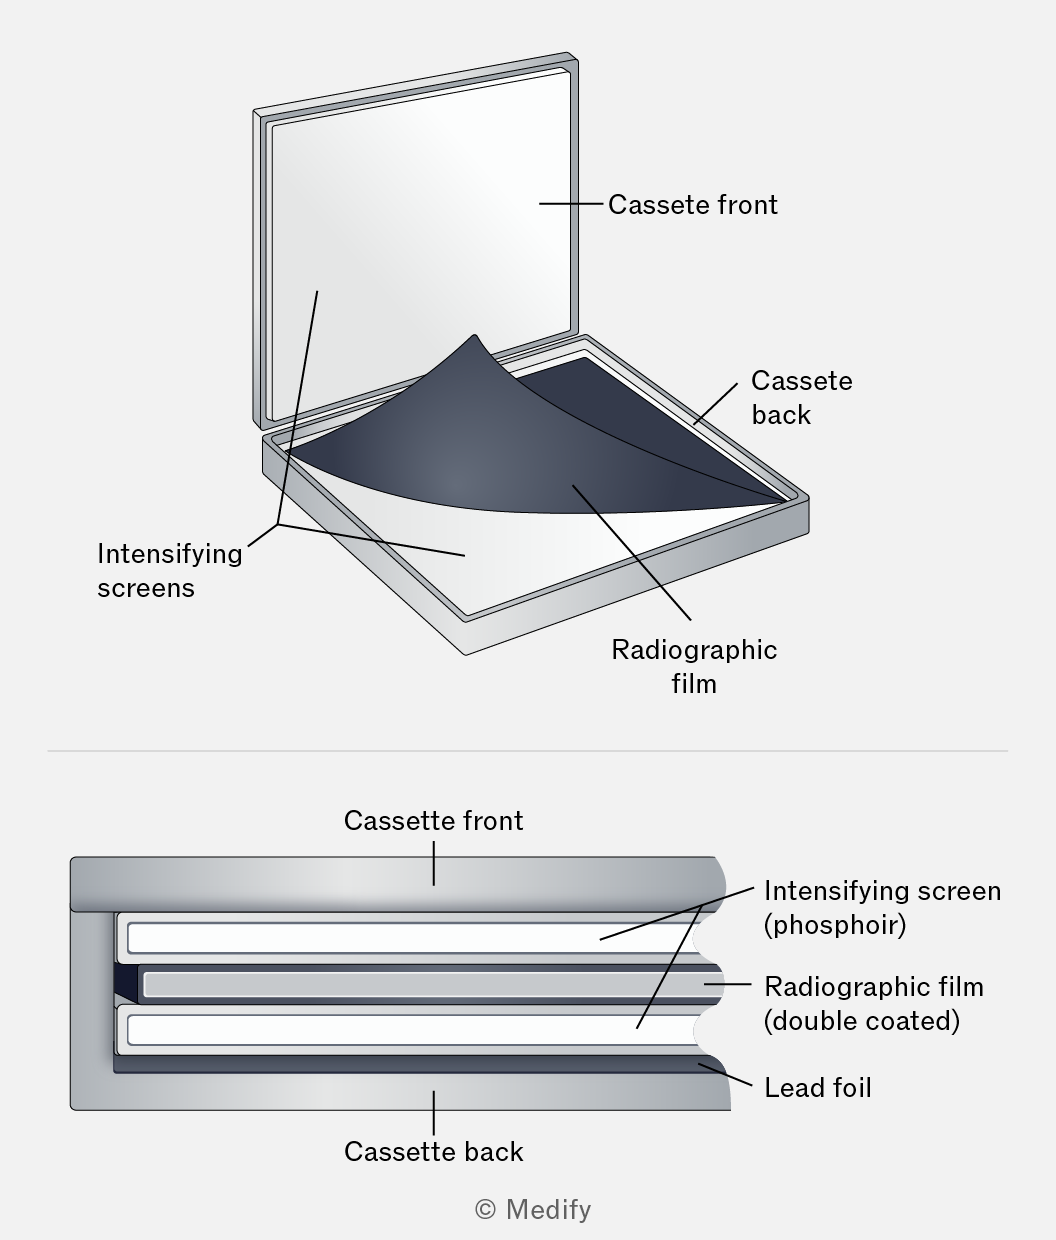
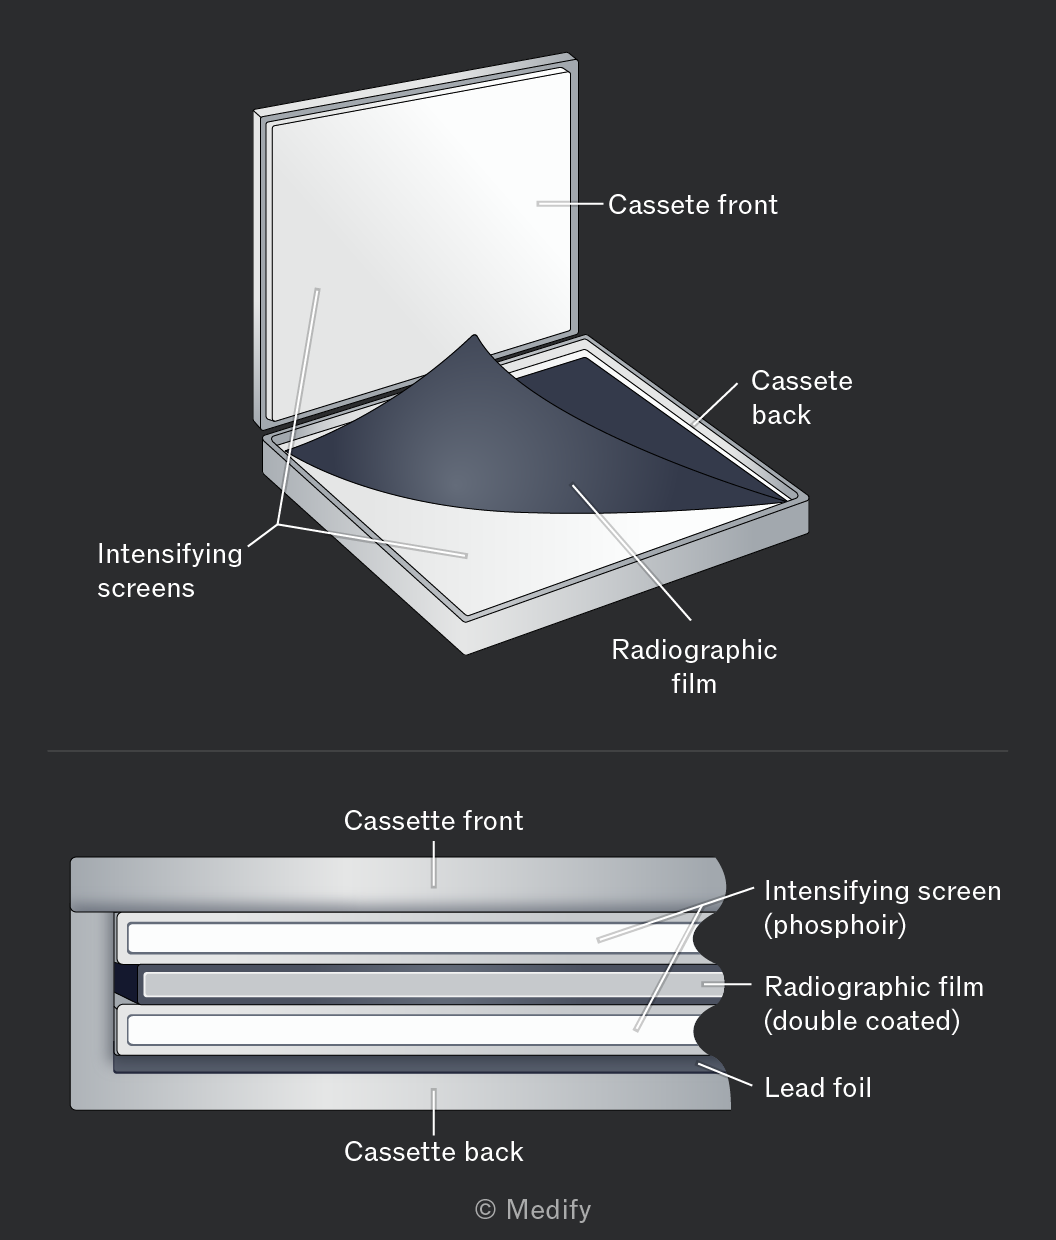
The key idea is signal amplification: one X-ray photon in, several visible light photons out. Because the light spreads slightly before reaching the film, images produced with fluorescent screens have slightly lower spatial resolution than directly exposing the film to X-rays.
Intensifying screens expose the film efficiently, reduce the patient’s radiation exposure and are relatively inexpensive, making them a practical choice for diagnostic imaging.
A flat panel (FTP) detector is used to digitally produce X-ray images of a patient’s body. In an X-ray scan, the FTP detector detects X-rays passing through the patient through this process:
- X-rays exiting the patient strike an X-ray scintillator that converts them into visible light photons (similar to the fluorescent screens in an intensifying screen cassette).
- Photodiode pixels beneath the scintillator produce a voltage at each pixel proportional to the visible light intensity falling on them.
- A thin-film transistor (TFT) array reads these voltages and transmits the data for digital image processing.
- The resulting digital image is processed and displayed on a monitor.
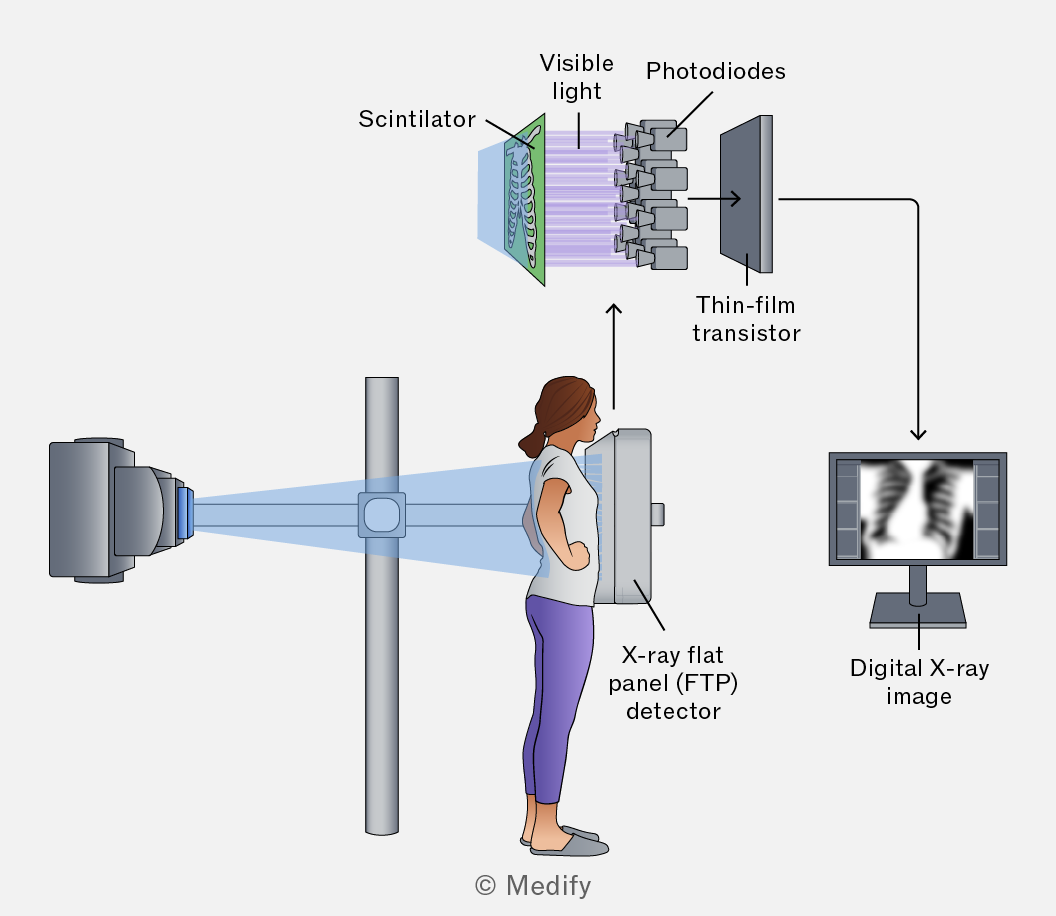
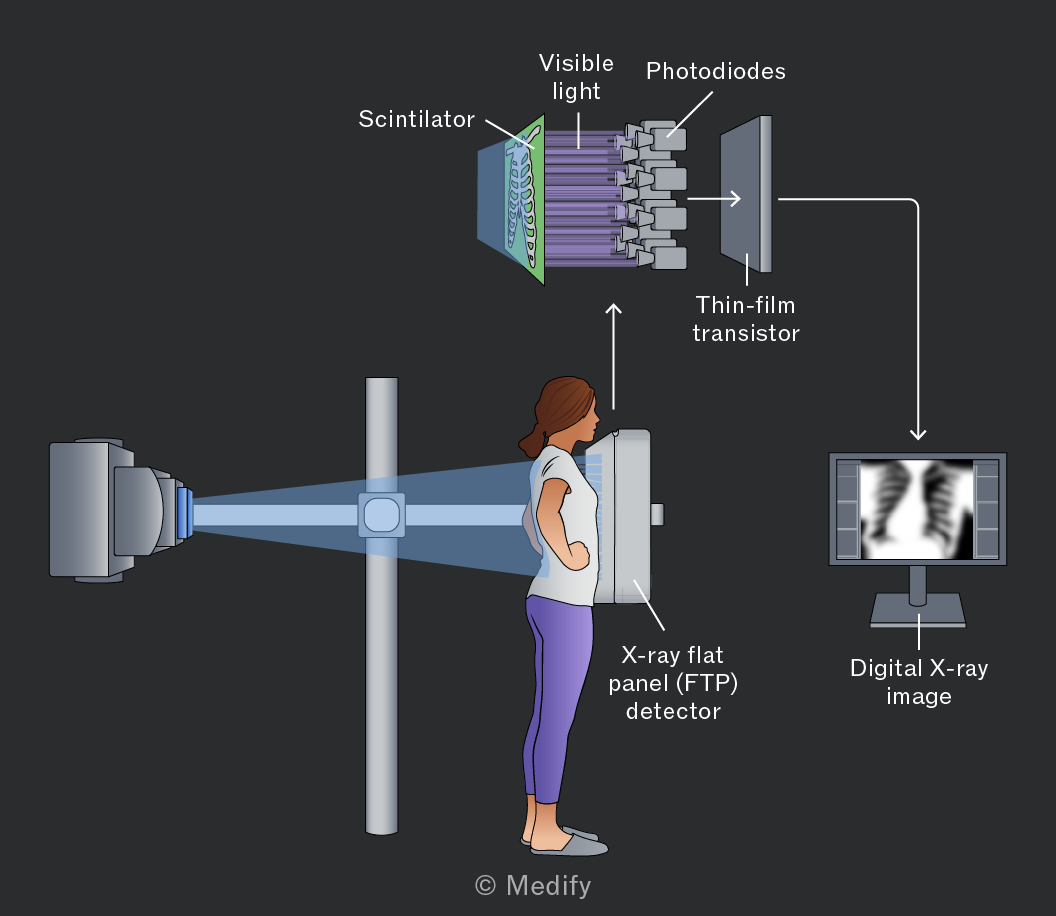
FTP detectors have largely replaced photographic film in modern imaging. Because the digital sensor is more efficient at capturing X-ray energy, lower radiation doses are needed. Digital images can also be enhanced, stored, and shared electronically.
Fluoroscopy uses a continuous X-ray beam to produce real-time moving images of internal organs and tissues. Because of this the patient’s radiation dose is significantly higher and is managed by:
- Introducing a contrast medium (e.g. barium) into the body increases the X-ray absorption of soft tissues, improving image contrast so structures such as the digestive tract or blood vessels are visible.
- A lower X-ray tube voltage reduces the energy of the X-ray beam, lowering the radiation dose. The image intensifier compensates by amplifying the weaker signal.
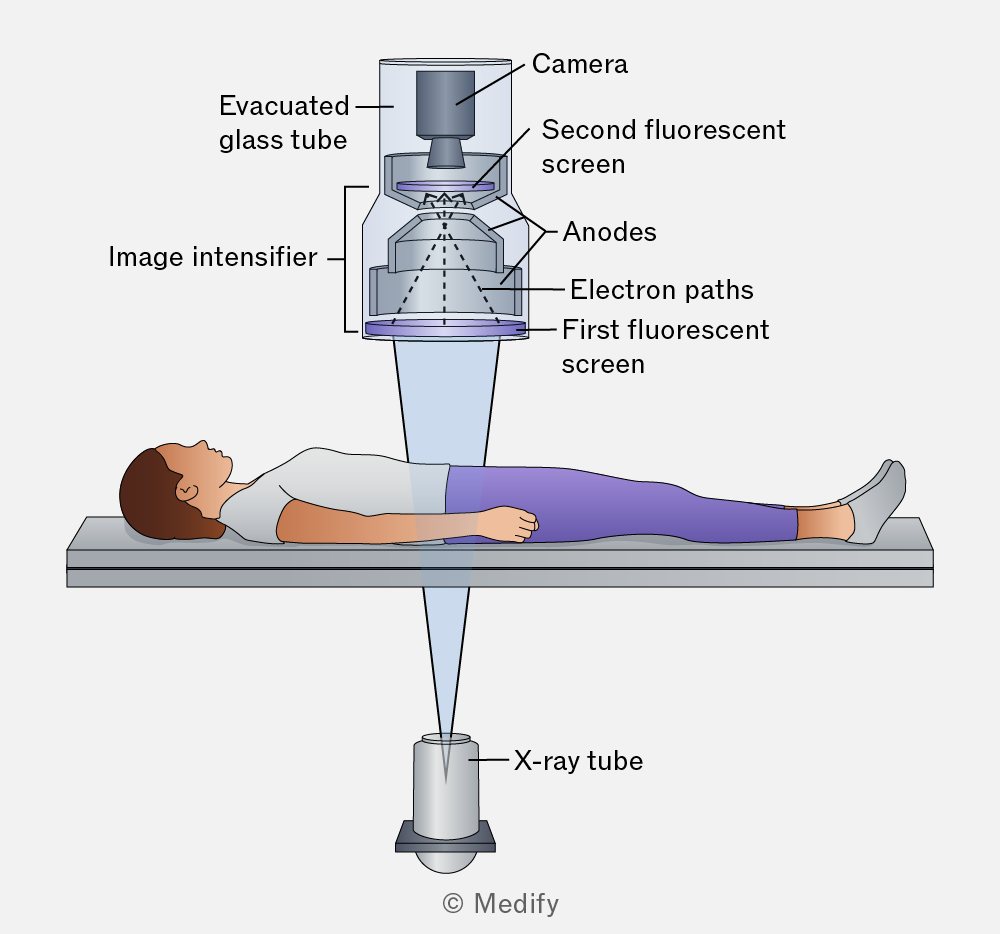
A fluoroscopic image intensifier amplifies the weak X-ray signal.
- X-rays strike the fluorescent screen, converting them into visible light.
- A photocathode absorbs the light and emits electrons.
- Accelerating anodes focus and accelerate the electrons across an evacuated glass tube.
- The electrons hit the second fluorescent screen, producing a bright, high-contrast image.
- A camera captures the output for real-time display on a monitor.
In X-ray imaging:
- Sharpness is defined as the clarity of the edges of body tissues. To enhance sharpness:
- use a narrow X-ray beam,
- reduce scattering of X-rays,
- use smaller pixel sizes,
- increase the source-to-image distance, and
- decrease the object-to-image distance.
- Contrast describes how much the darkness of different body tissues in an image changes from black to white. To enhance contrast:
- use a contrast medium, and
- use a lower x-ray tube voltage.
A contrast medium is a substance that readily absorbs X-rays. For example, a patient can swallow it to visualise the gastrointestinal tract.
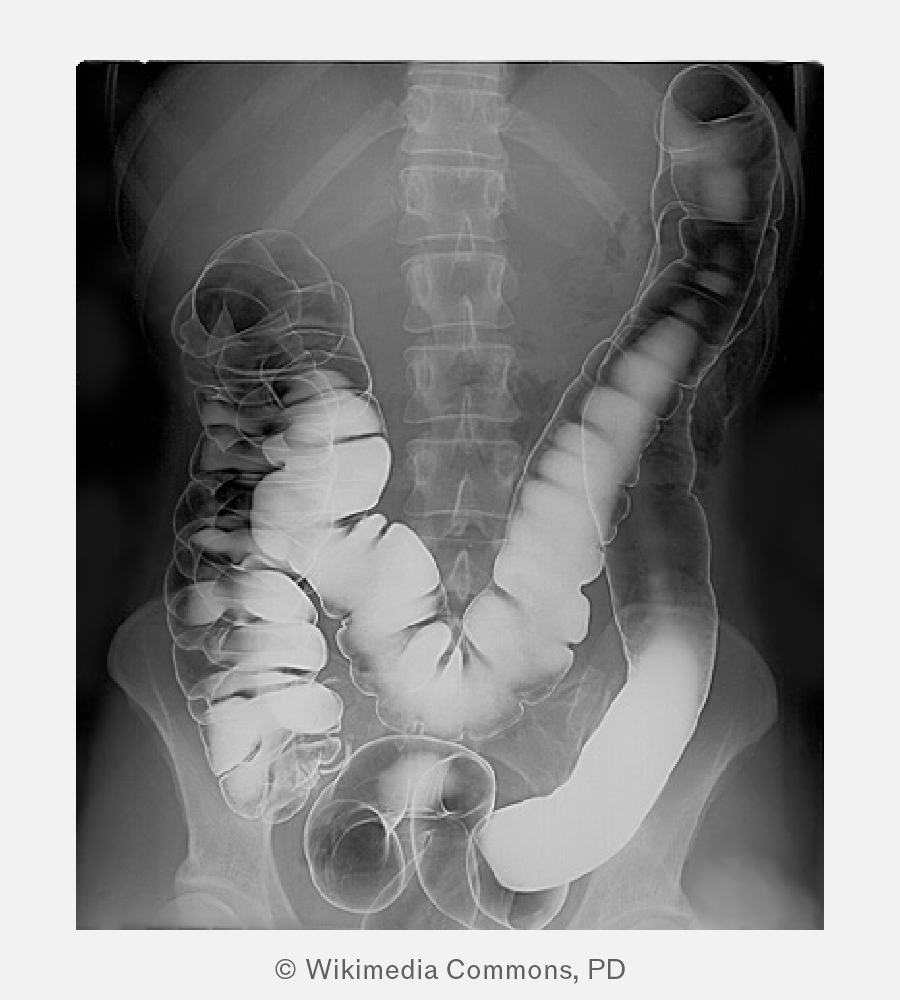
In the image above, a patient has ingested a barium meal, a contrast medium. Over time, the barium coats the patient’s entire intestines, allowing for a clearer X-ray image with enhanced contrast from surrounding organs and tissues.
X-ray images can be produced:
- digitally using flat-panel (FTP) detectors,
- as moving images with fluoroscopic image intensifiers, or
- as still images with photographic film.
The table below compares these methods.
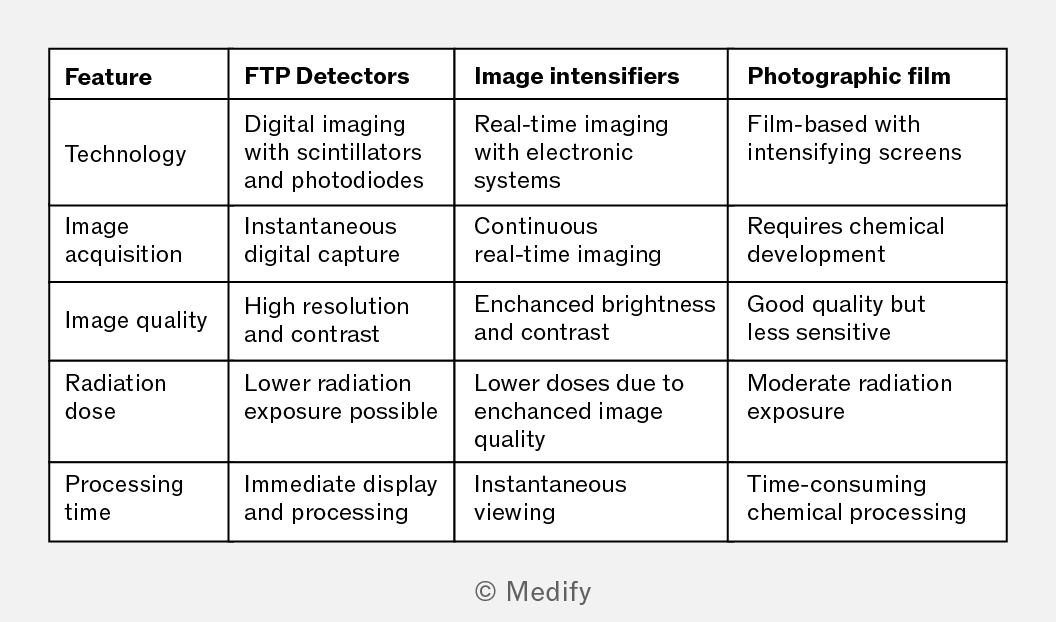
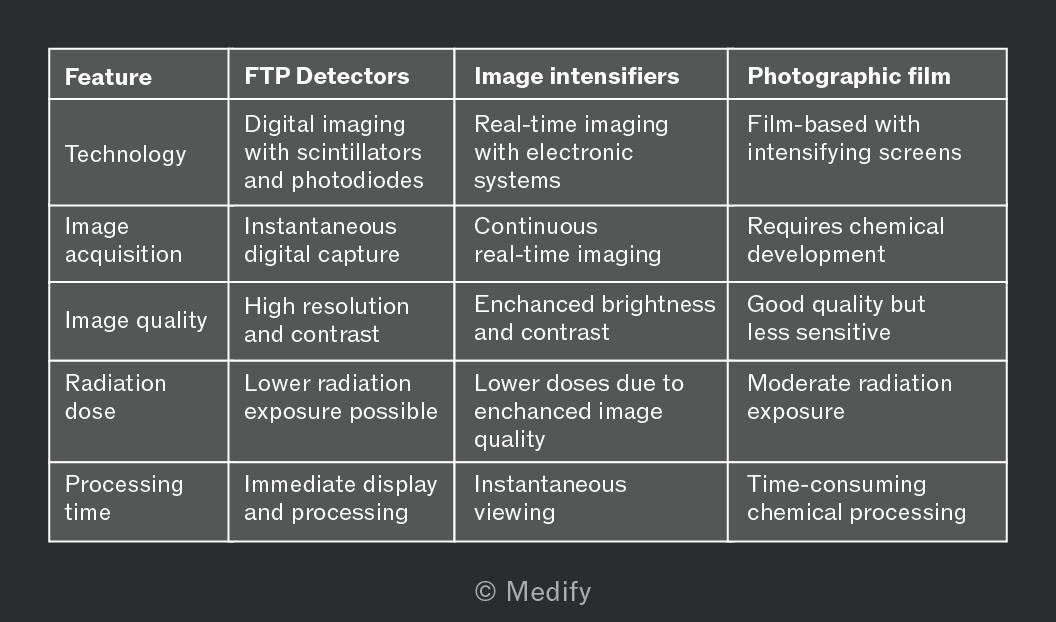
Question walkthrough
Choosing an X-ray imaging technique
Matches three clinical scenarios (a broken bone, tooth pain, and real-time blood-flow imaging) to the appropriate imaging technique — flat-panel detector, photographic film, or fluorescent image intensifier — and explains how a contrast medium improves image contrast for low-attenuation tissue.
When an X-ray beam travels through a substance, such as a patient’s body, its intensity attenuates due to absorption and scattering.
The intensity of an X-ray beam decreases exponentially with depth in a substance and the intensity is given mathematically as:
Where:
- is the intensity of the X-ray beam as it enters the substance,
- is the linear attenuation coefficient of the substance in units of and
- is the distance below the surface in
A substance with a higher attenuation coefficient absorbs X-rays more effectively, thus reducing their penetration. Generally, denser substances have higher attenuation coefficients.
It is useful to know that the energy of X-ray photons affects the linear attenuation coefficient. The higher the energy of the X-rays, the lower the linear coefficient of the substance, so higher energy X-rays can penetrate further into a surface.
An X-ray beam can be characterised by a half-value thickness (HVT) , which represents the depth required for the initial intensity of the X-ray beam to decrease by a half
Below is the intensity–depth graph of an X-ray beam penetrating a substance. The intensity decreases exponentially with depth.
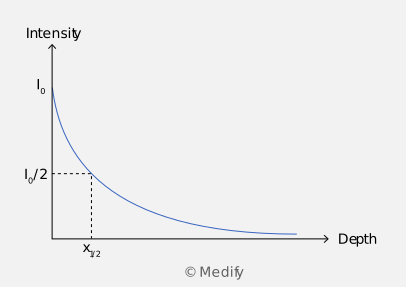
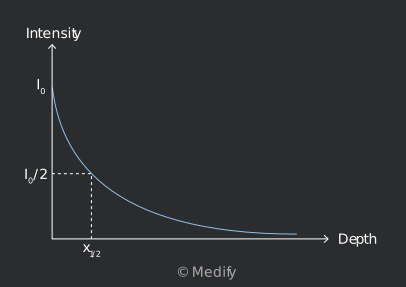
HVT is related to the linear attenuation coefficient by:
The half-value thickness is inversely proportional to the linear attenuation coefficient of the substance. Therefore, the higher the attenuation coefficient, the lower the half-value thickness.
For example, the half-value thickness of bones for high-energy X-rays is around This means that an X-ray beam halves in intensity after penetrating into bone.
It is useful to know that HVT is similar to the half-life in radioactivity, which represents the time required for a sample’s initial activity to become half.
It is useful to know how to derive the half-value thickness from the intensity equation for your understanding, even though you will not be tested on it in the exam. Starting with the intensity equation, at half-value thickness, the intensity will be equal to half of the initial intensity :
Moreover, . Therefore:
Finally, rearranging the expression to get :
The linear attenuation coefficient of an object is a measure of the X-ray affected by density Therefore, to compare the X-ray attenuation of different materials directly, the mass attenuation coefficient is used, which is a measure of X-ray attenuation per unit mass:
- A high means X-rays are strongly absorbed by the material.
- A low means X-rays are weakly absorbed by the material.
The table below shows the mass attenuation coefficient of some common materials. The units for is
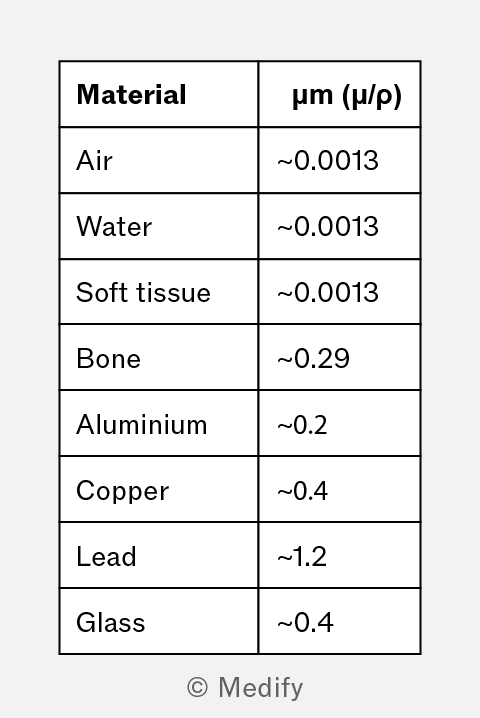
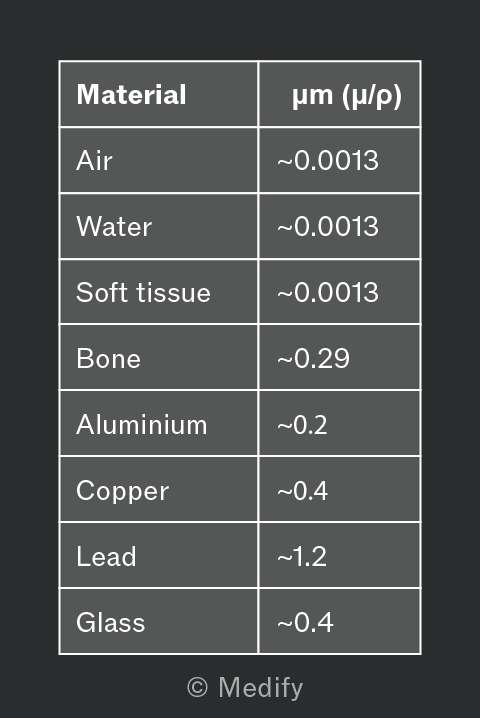
The values in the table show how different materials absorb X-rays, which directly relates to their roles in imaging and protection:
- Air has a very low absorption coefficient, so it appears dark on X-ray images.
- Soft tissue and water have similar absorption, making them harder to distinguish, which explains why CT or contrast agents are sometimes used.
- Bone has a much higher value, appearing bright and giving strong contrast against soft tissue.
- Lead is used for shielding to protect patients and medical workers from unnecessary exposure.
Question walkthrough
Attenuation of X-rays through blood
Uses the exponential attenuation law I = I₀e^(−μx) and a graph of intensity against depth to find beam intensity at 4.0 cm, the half-value thickness, and the mass attenuation coefficient (μ/ρ) of blood.
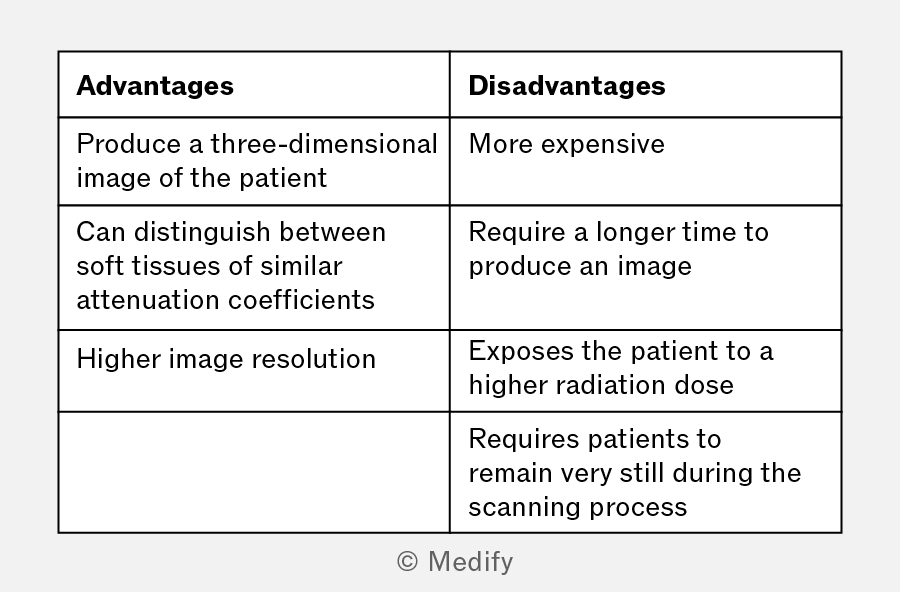
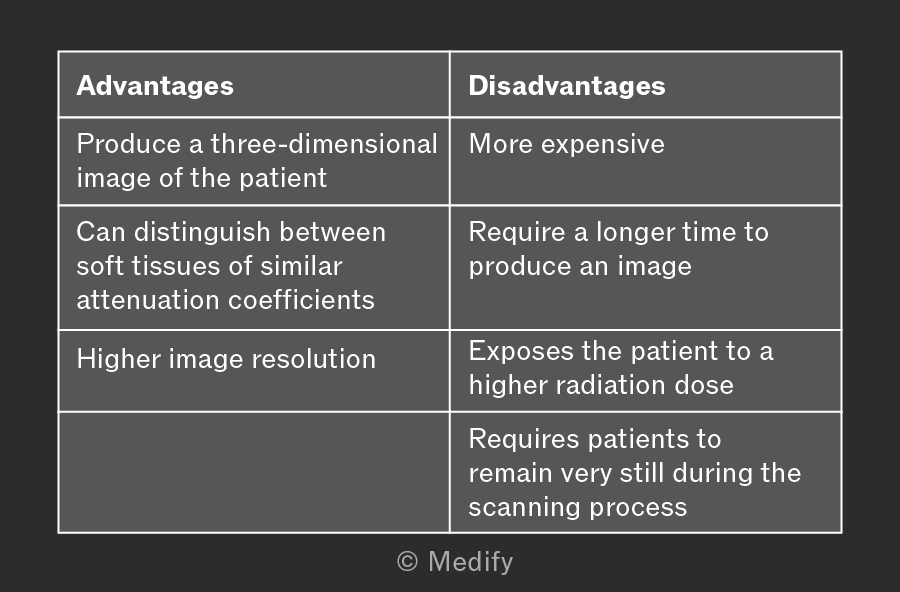
Conventional X-ray images are two-dimensional, which obscures overlapping structures. Computerised axial tomography (CT) scanners overcome this by producing three-dimensional images.
In a CT scanner, the patient lies on a slidable horizontal table inside a circular gantry containing an X-ray tube and an opposing array of detectors:
- The X-ray tube makes a full revolution around the patient, producing a fan-shaped beam.
- The opposing detector array records this radiation beam from multiple angles.
- A computer processes this data to produce a cross-sectional slice of the patient.
- The table moves horizontally by about 1 cm, and the process repeats.
- The individual slices are stacked to build a three-dimensional image.
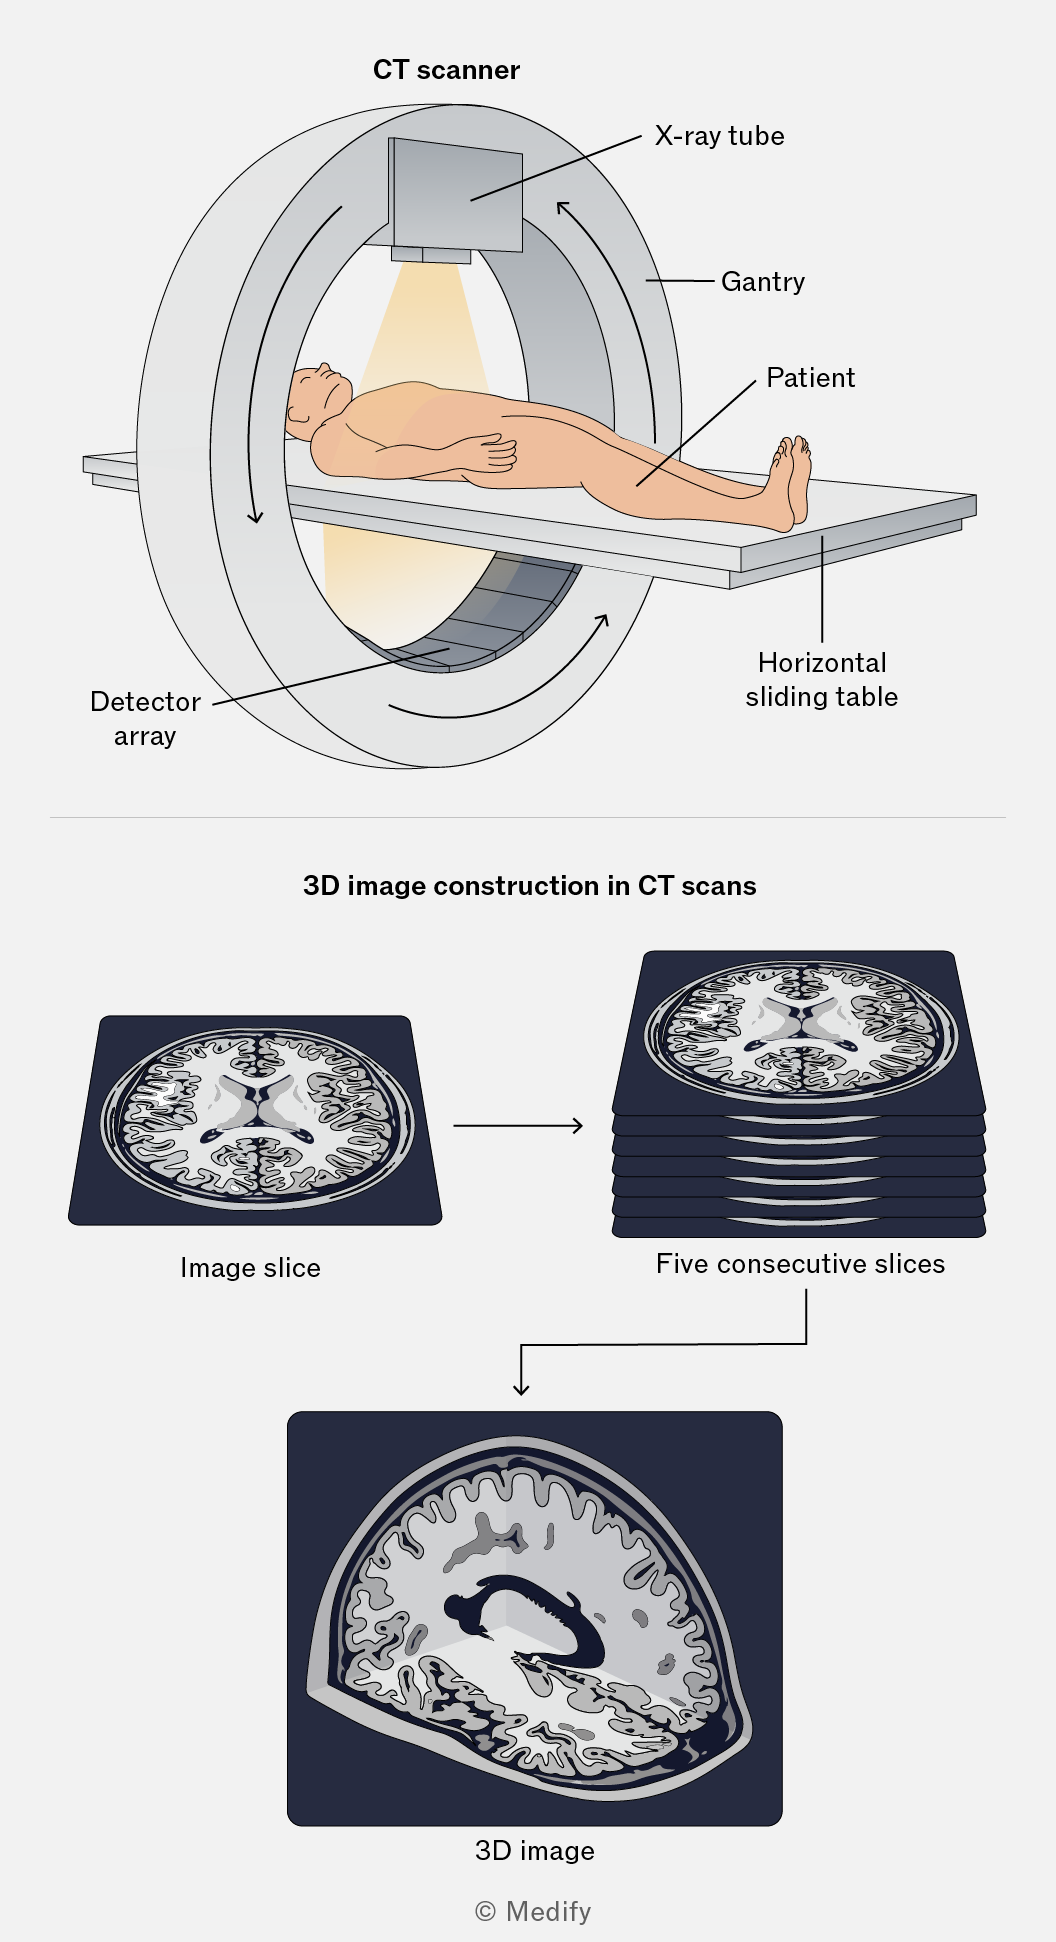
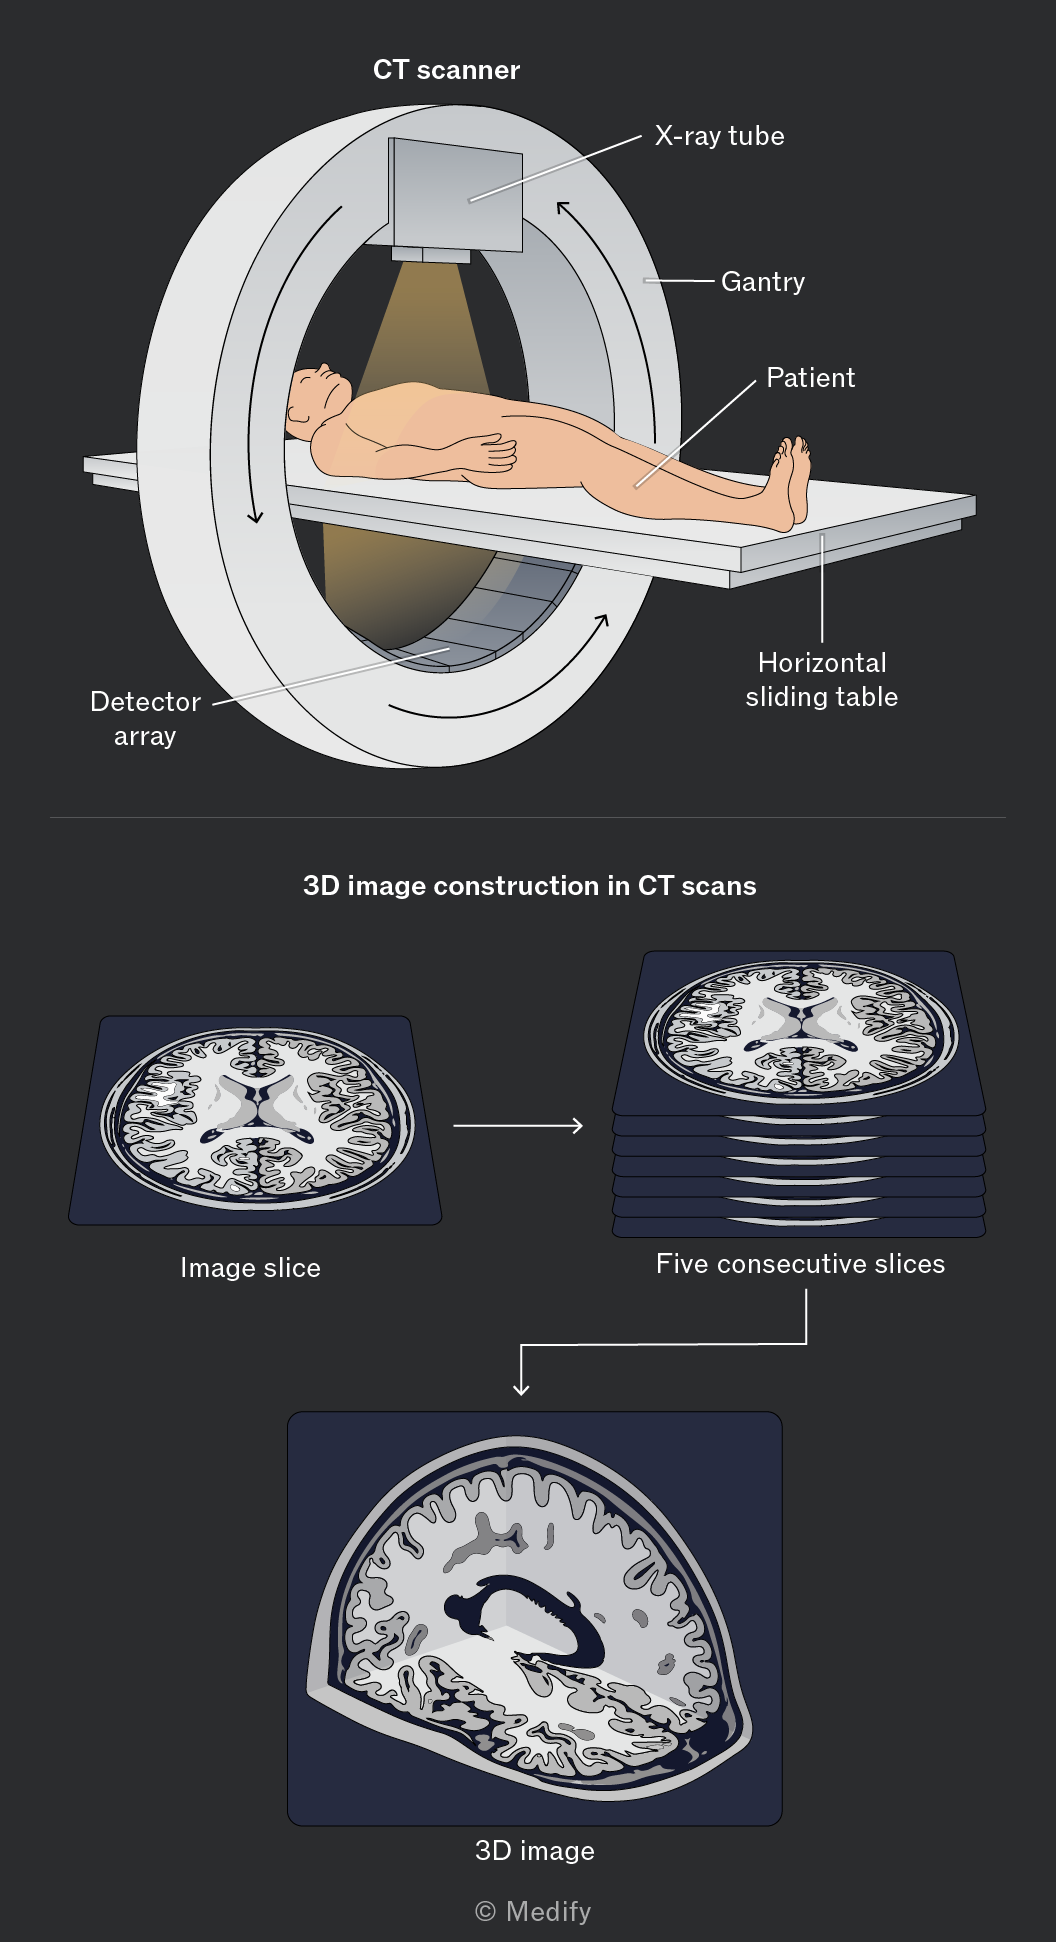
CT scans deliver a higher radiation dose than conventional X-rays because multiple exposures are taken from many angles. However, the detailed 3D images produced make them invaluable for diagnosing complex conditions involving soft tissue, bone fractures, and internal bleeding.
Using CT scanners instead of conventional X-ray imaging has advantages and disadvantages.