
Resistance (4.2.3)
On this page
Resistance is the measure of how easily current can flow through an electrical component. Resistance is the opposition to the flow of electric charge. A higher resistance means that less current can flow for a given applied voltage.
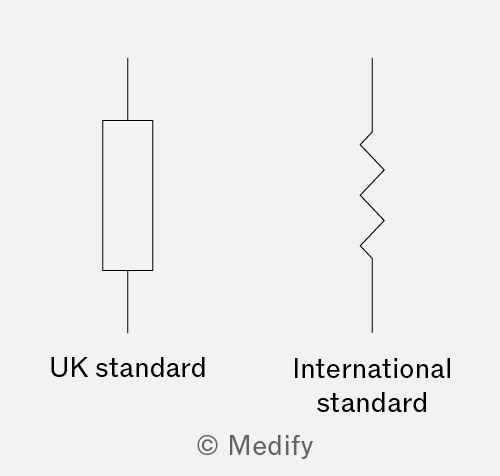
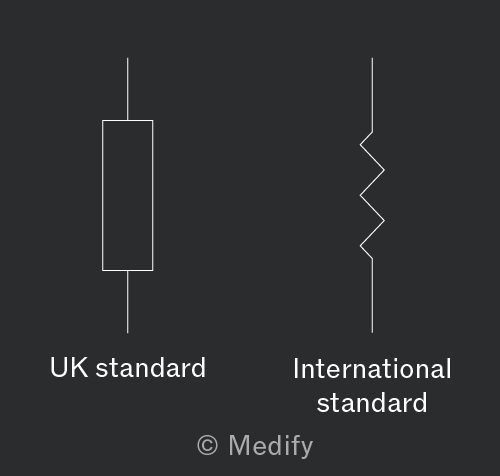
It is important to note that you will only see this symbol (the box shape for a fixed resistor) in exam questions.
It is useful to note that you may sometimes see a resistor drawn as a jagged line, shown in the diagram on the right, but the rectangular symbol is the most common.
The resistance of an electrical component is defined as:
Where:
- is the voltage across the component in volts ,
- is the current flowing through the component in amperes , and
- resistance is measured in ohms
The ohm is a derived unit and is defined as one volt per ampere:
Ohm’s law states that for a metallic conductor, kept at a constant temperature, the current flowing is directly proportional to the applied voltage:
Where:
- across the voltage of the component in volts
- is the current flowing through the component in amperes and
- is the resistance in ohms
Conductors that obey Ohm’s law are called ohmic conductors, where under constant physical conditions.
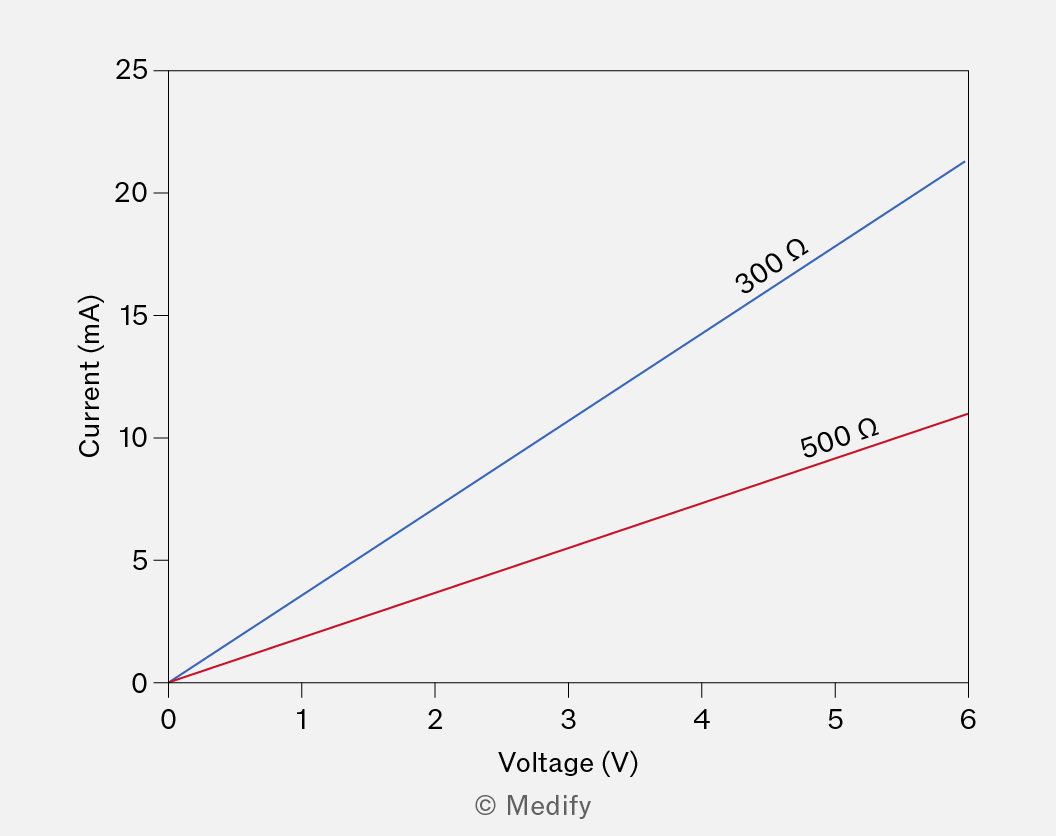
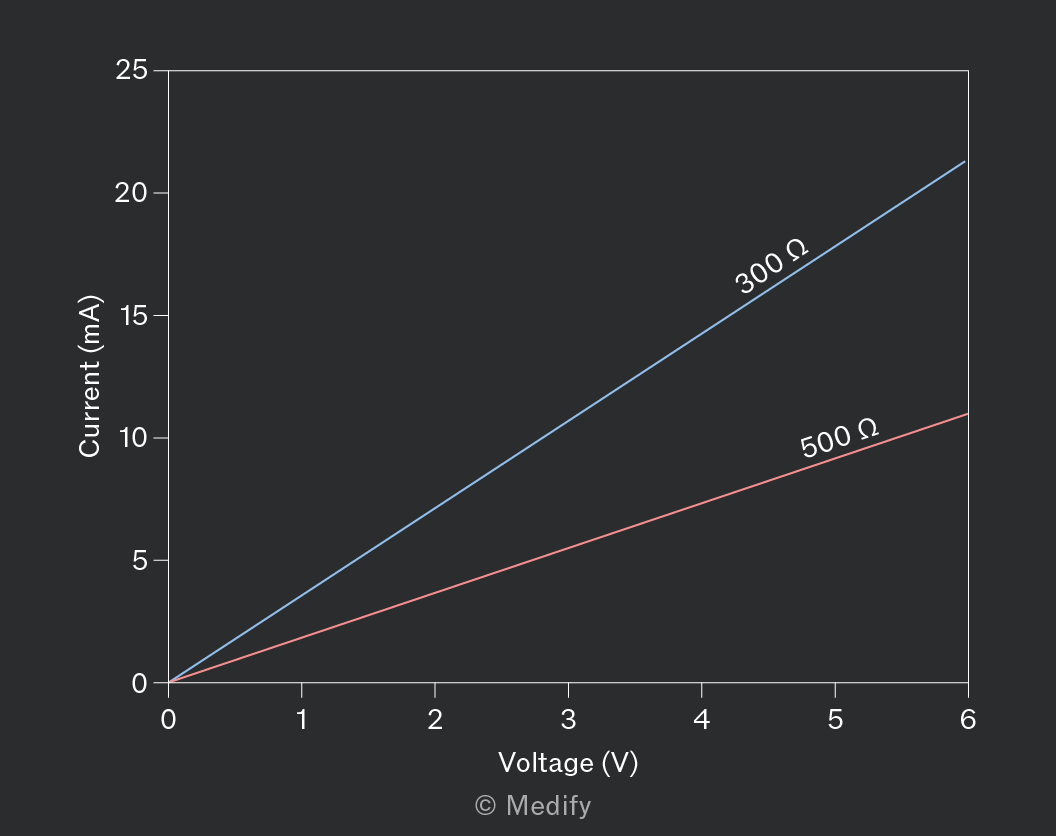
An ohmic conductor has a linear characteristic current–voltage graph. A rearranged form of Ohm’s law states that:
The left-hand side of the equation is equal to the gradient of a linear graph. Therefore, the gradient of an graph for a conductor is equal to the reciprocal of its resistance. The steeper the gradient of the graph, the lower the resistance of the conductor.
The general equation of a straight line is:
Where:
- is the gradient, and
- is the Y-intercept.
Setting and gives:
Comparing this equation to Ohm’s law confirms that , but also shows that when : the graph of an ohmic conductor passes through the origin.
It is important to note that exam questions can be set where either or is on the horizontal axis of the characteristic graph
Fixed resistors are ohmic conductors. The curve of a fixed resistor shows a linear relationship.
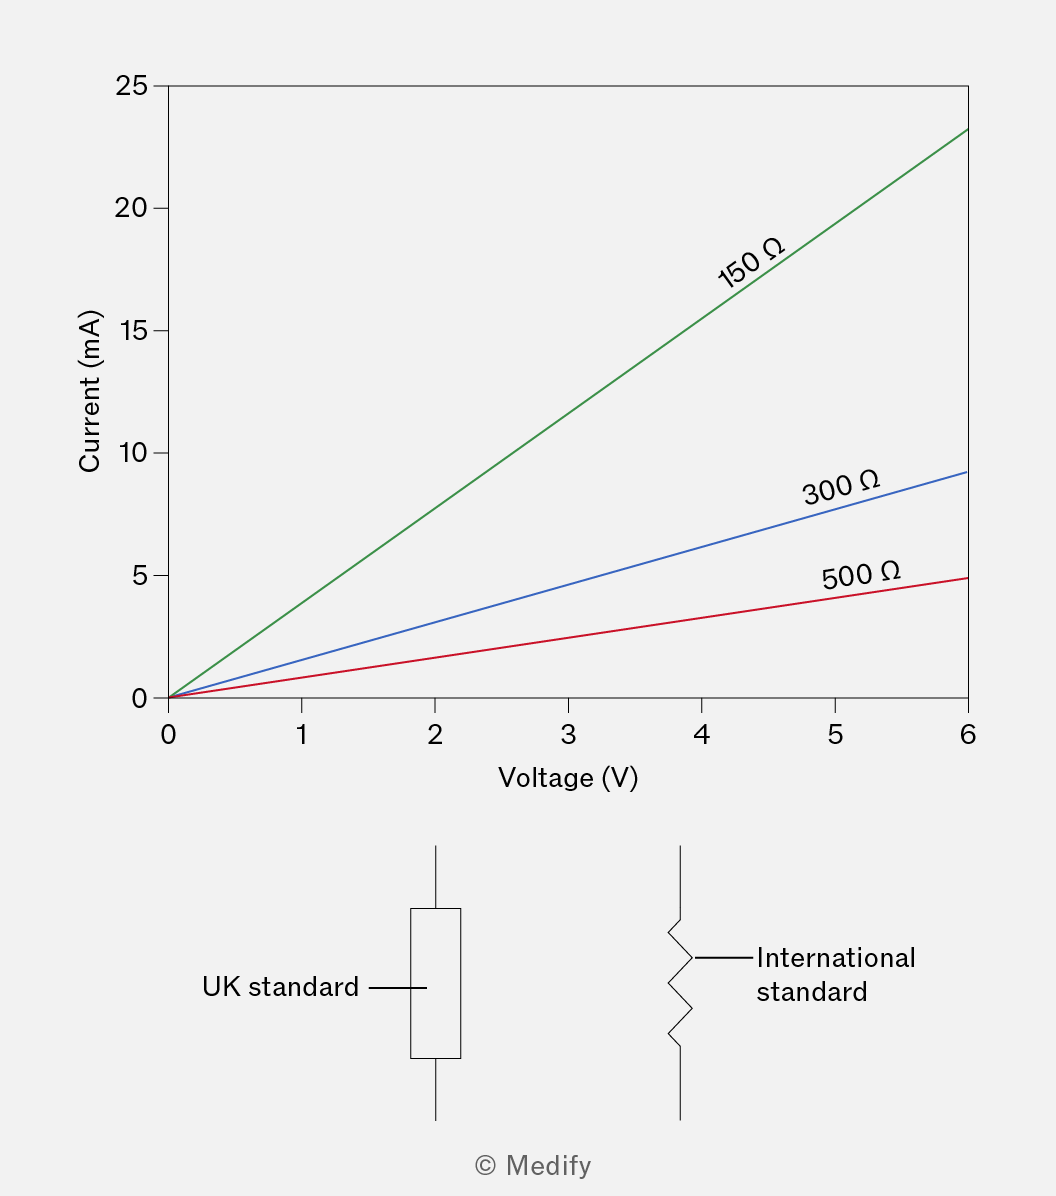
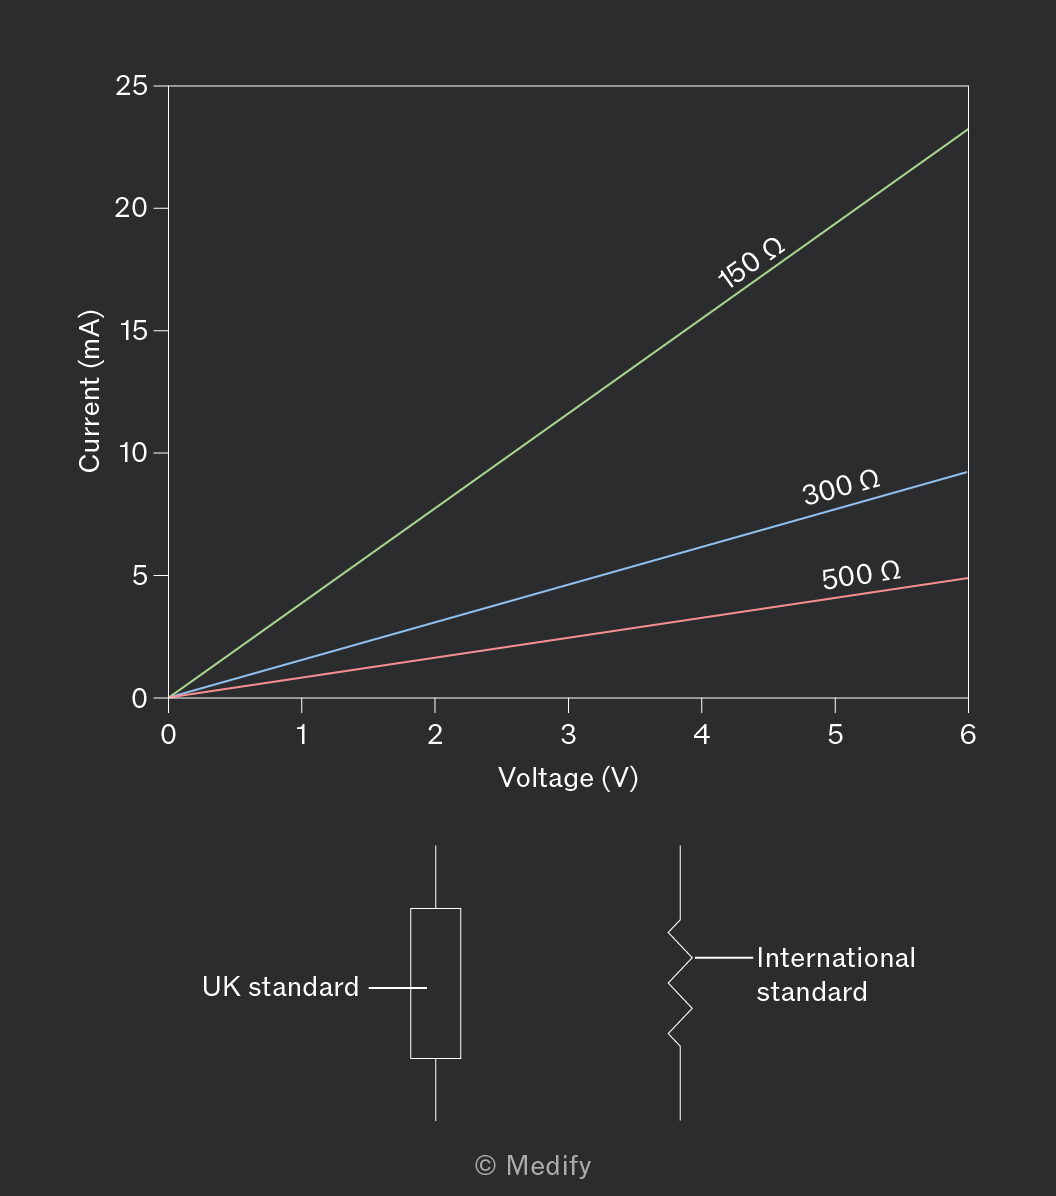
The resistance of a fixed resistor is equal to the inverse of the gradient of the curve. Therefore, a steeper graph means a lower resistance.
A filament lamp is a non-ohmic conductor:
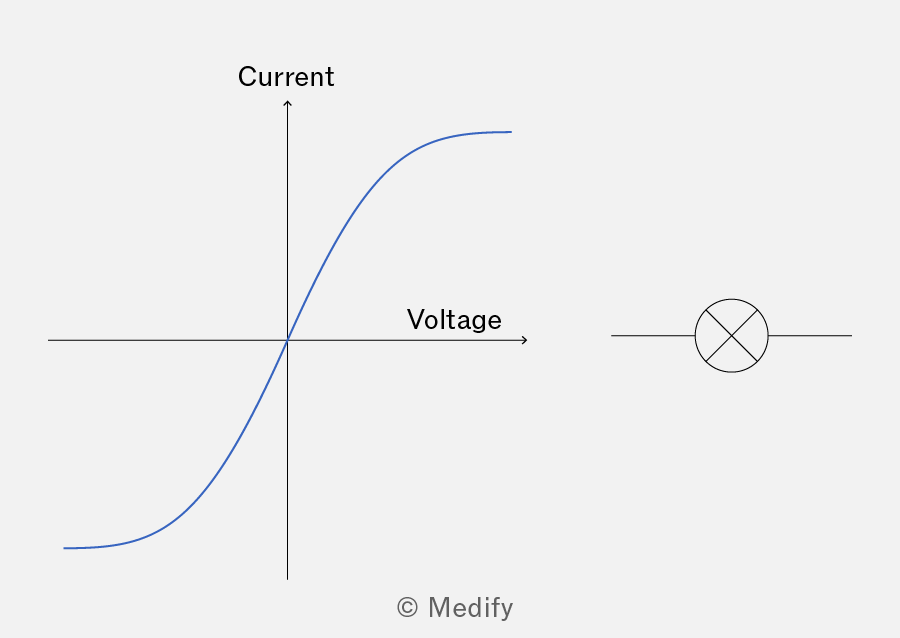
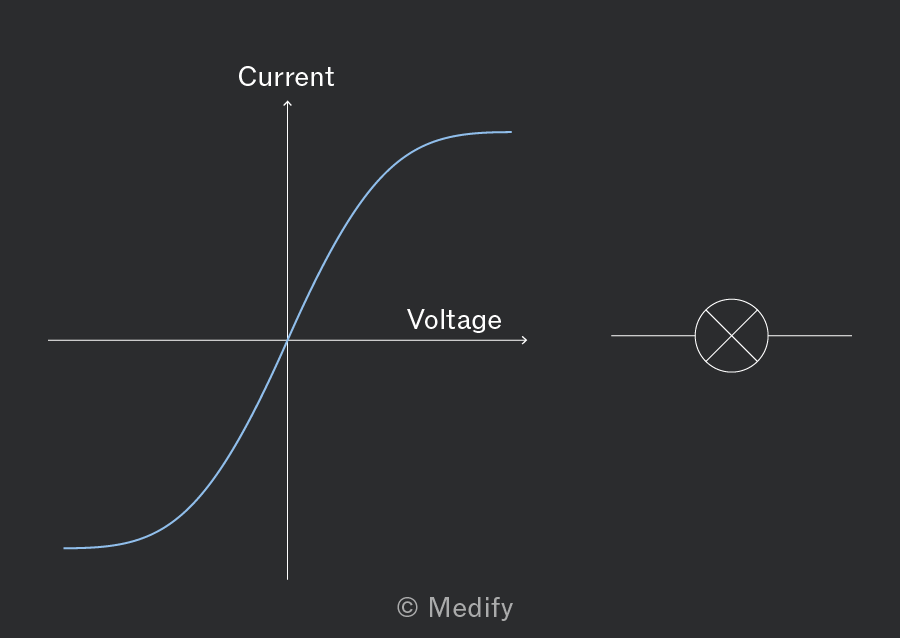
At low current, a filament lamp is an ohmic conductor and has a linear curve. However, the filament lamp becomes a non-ohmic conductor at higher current:
- The temperature of a filament lamp increases with current.
- As a filament lamp heats up, its metal ions vibrate more, which increases the resistance.
- A large resistance leads to the gradient of the curve decreasing.
A thermistor is a non-ohmic conductor. The resistance of a thermistor depends on its temperature. For a negative temperature coefficient (NTC) thermistor, the resistance decreases as the temperature increases.
When the temperature of a thermistor increases, additional charge carriers are released which can contribute to a current, decreasing the resistance (since resistance is opposition to current flow).
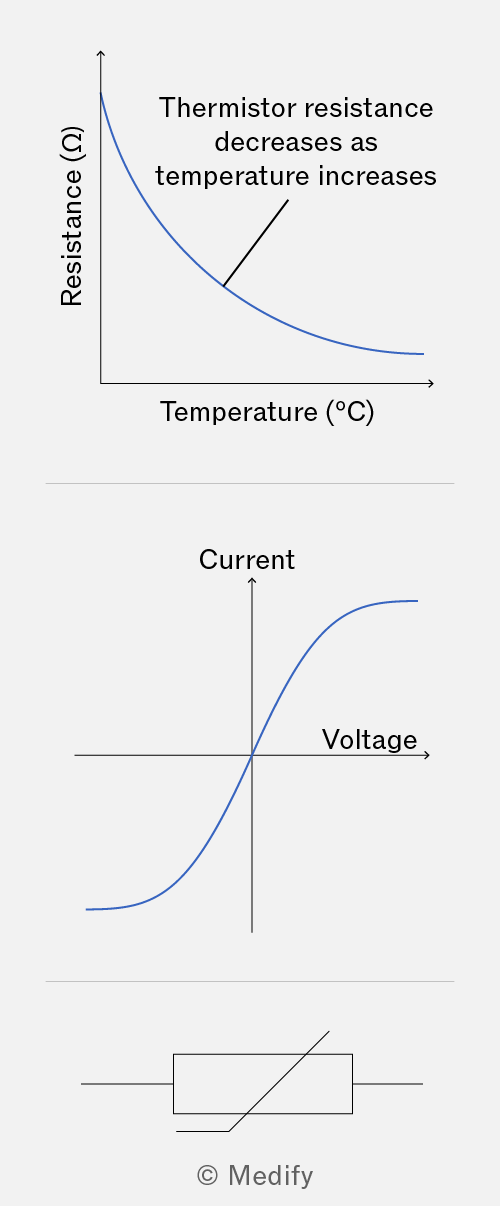
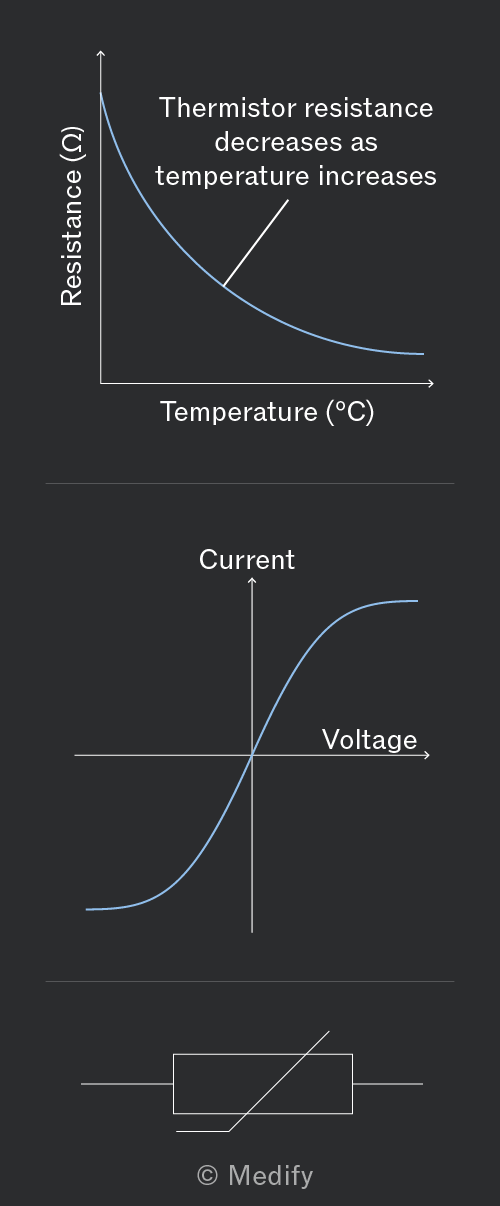
The curve for a thermistor is linear at low currents. At high current, a thermistor’s temperature increases, decreasing its resistance, causing the gradient of the curve to become steeper.
The temperature dependence of thermistors makes them useful for thermometers and thermostats.
A diode is a non-ohmic conductor. Diodes only allow current to flow in one direction.
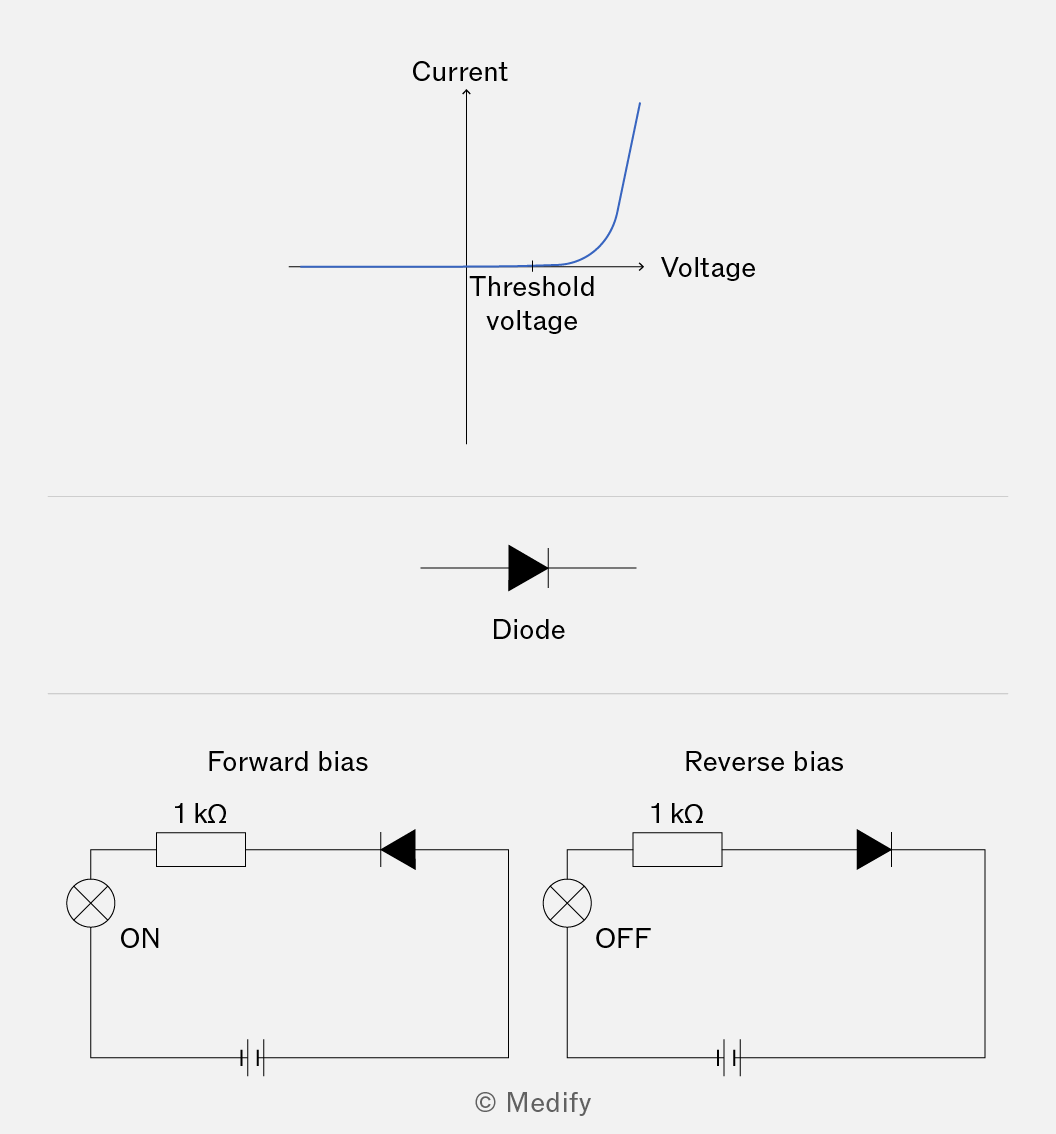
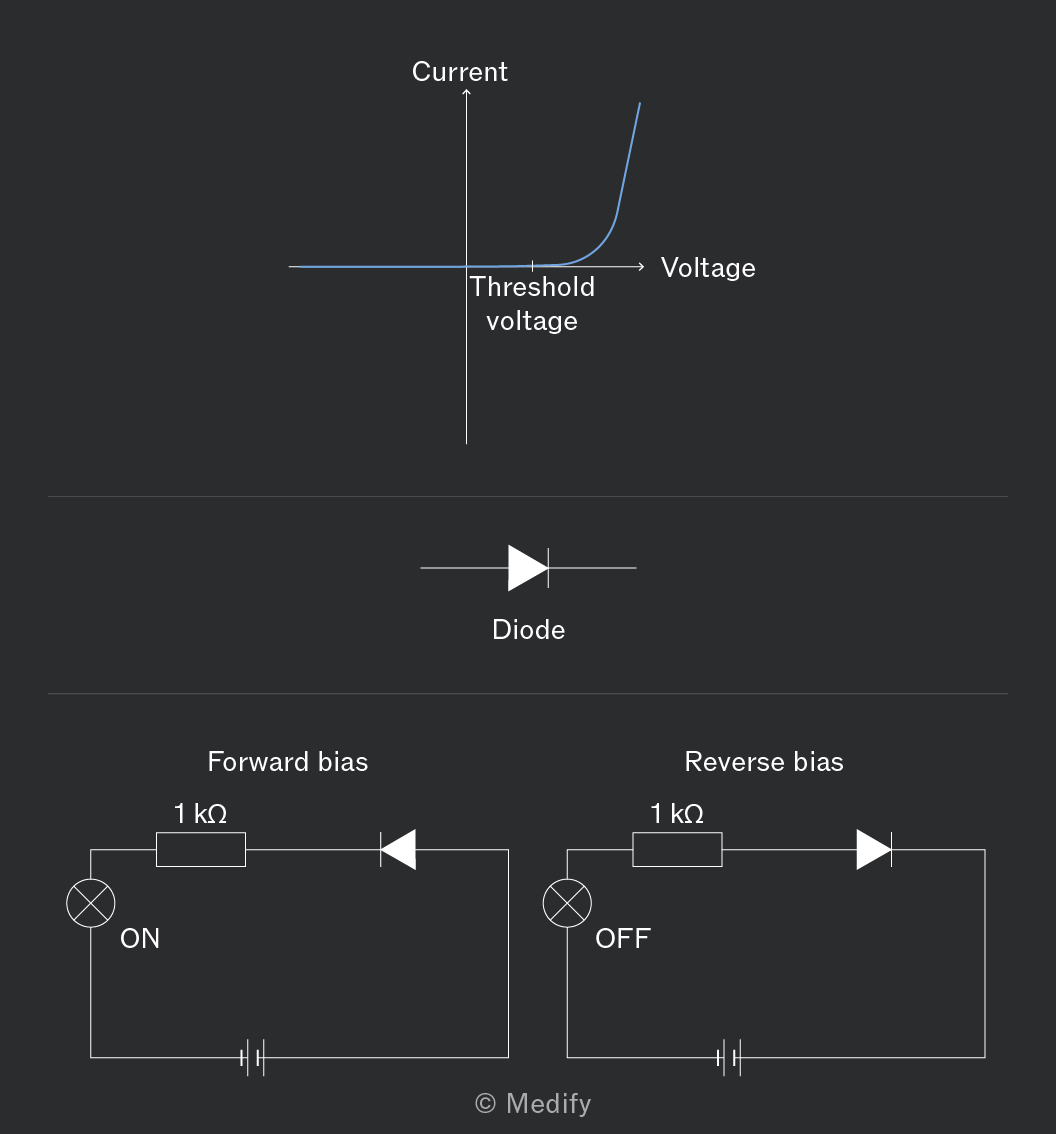
The two circuits above show how the curve for a diode relates to how it is connected in a circuit:
- Forward bias
- When the diode arrow is pointing in the direction from the positive terminal to the negative terminal, current flows through the circuit.
- For current to flow, the applied voltage must be greater than the threshold voltage, which is normally
- In the circuit diagrams above, the lamp will turn on when the diode is connected in forward bias.
- Reverse bias
- When the diode ‘arrow’ is pointing from the negative terminal to the positive terminal, no current can flow.
- The lamp does not turn on.
In forward bias, the diode has a small resistance, which can lead to very large currents flowing through the circuit. To prevent damage to the circuit components, a fixed resistor is included to reduce the current.
A light-emitting diode (LED) emits monochromatic light in forward bias. They are made from semiconducting materials.
In forward bias, a current flows through the LED and electrical energy is converted to light energy.
The threshold voltage is the minimum forward voltage required for the LED to start conducting. It corresponds to the energy needed for electrons to cross the energy band gap in the semiconductor material and emit photons. Different LED materials have different band gap energies, which determine both the colour of light emitted and the threshold voltage. LEDs that emit shorter-wavelength light have larger band gaps and therefore higher threshold voltages.
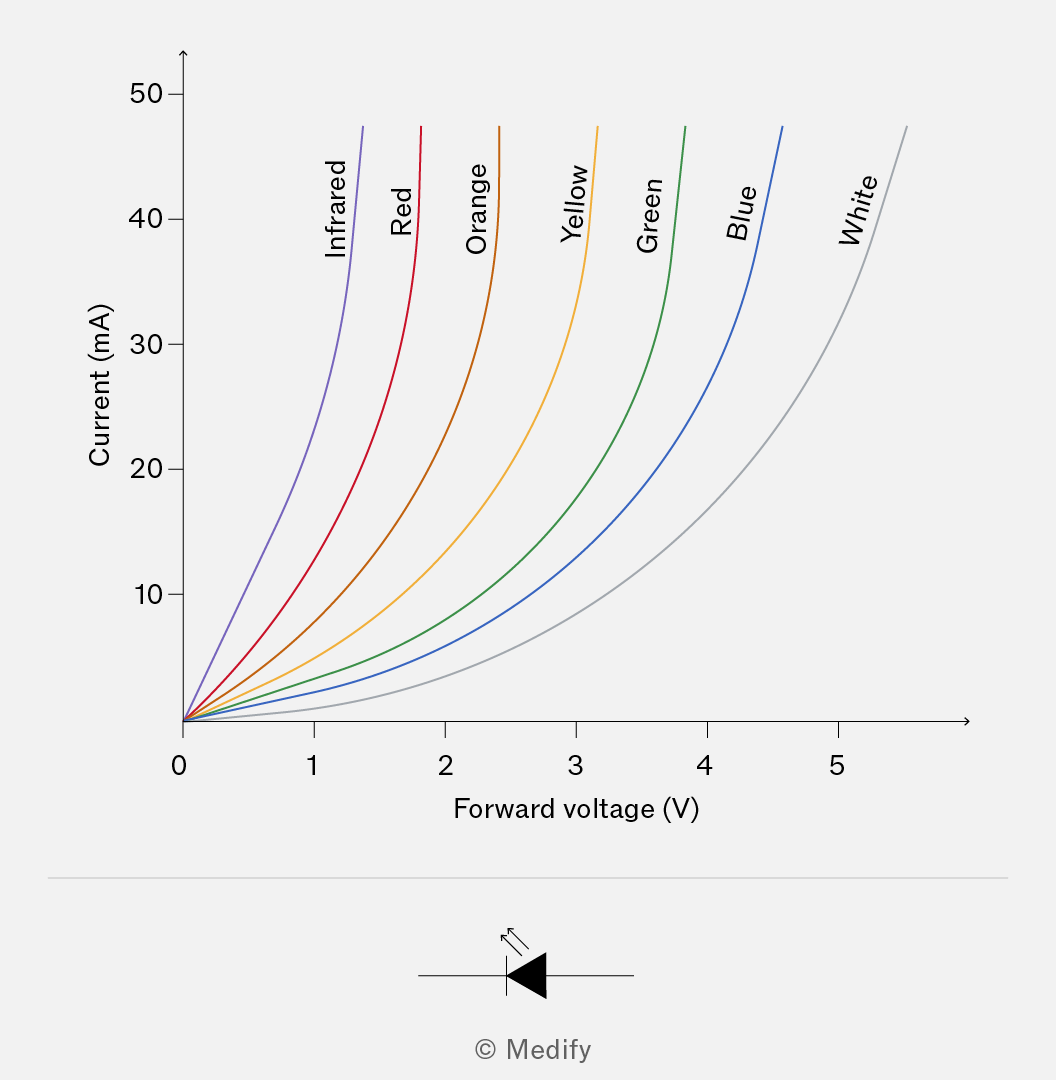
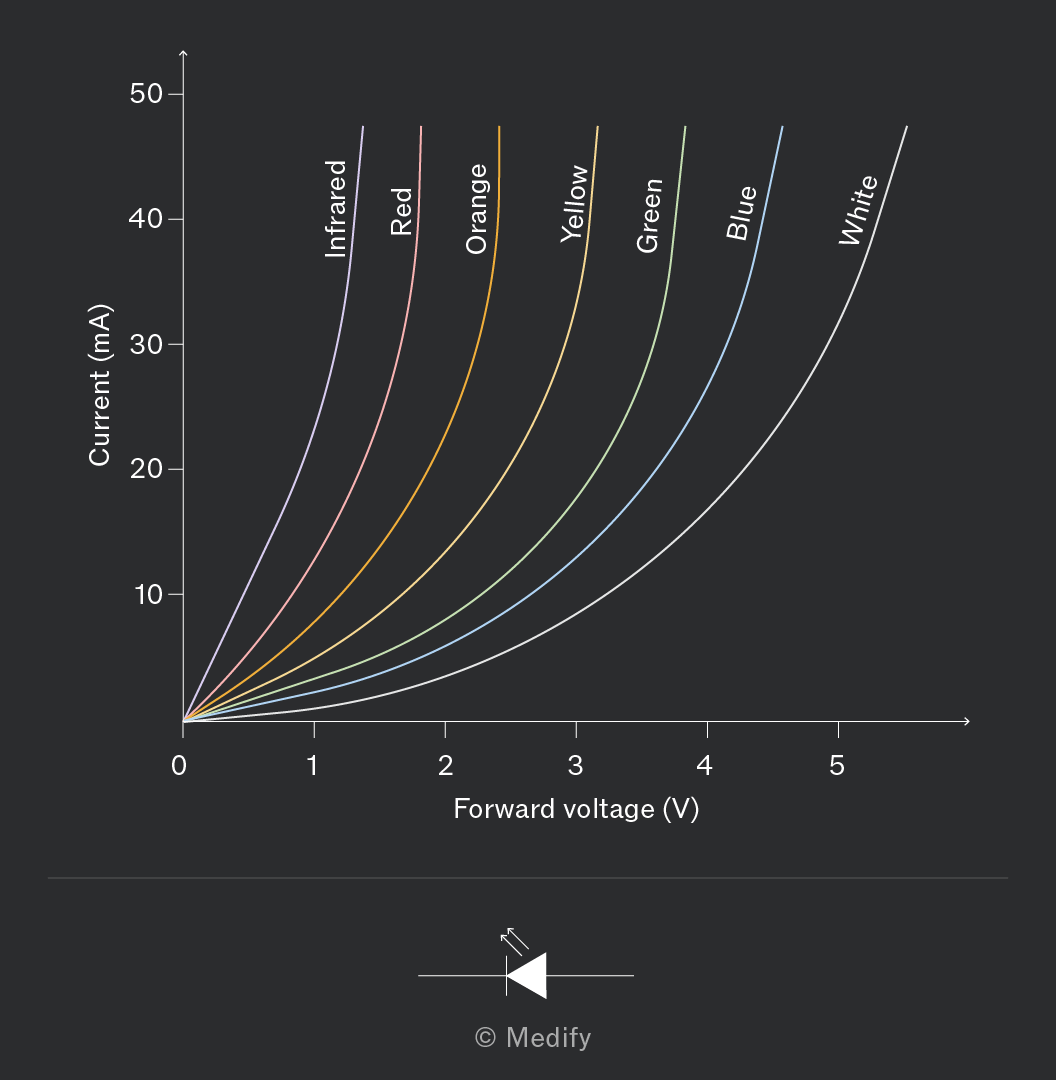
It is useful to note that white LEDs often use a blue LED coated with a phosphor that converts some of the blue light into other wavelengths, resulting in white light. Because of the large energy gap involved, white LEDs typically have the highest threshold voltage among visible LEDs.
Question walkthrough
Comparing Filament Lamp and Thermistor Resistance
Explain how resistance changes with increasing current for a filament lamp and an NTC thermistor, linking each to the effect of temperature on charge carriers.
Question walkthrough
Designing an Experiment to Test Ohm's Law
Design a circuit and method to test whether a fixed resistor is ohmic, then adapt the method to investigate non-ohmic components like a lamp, diode, or thermistor.
Question walkthrough
Identifying a Non-Ohmic Component from Data
Identify a filament lamp as a non-ohmic conductor from current-voltage data and recognise its characteristic curved I-V graph shape.
A light-dependent resistor (LDR) is a non-ohmic conductor.
The resistance of an LDR is inversely proportional to the amount of incident light.
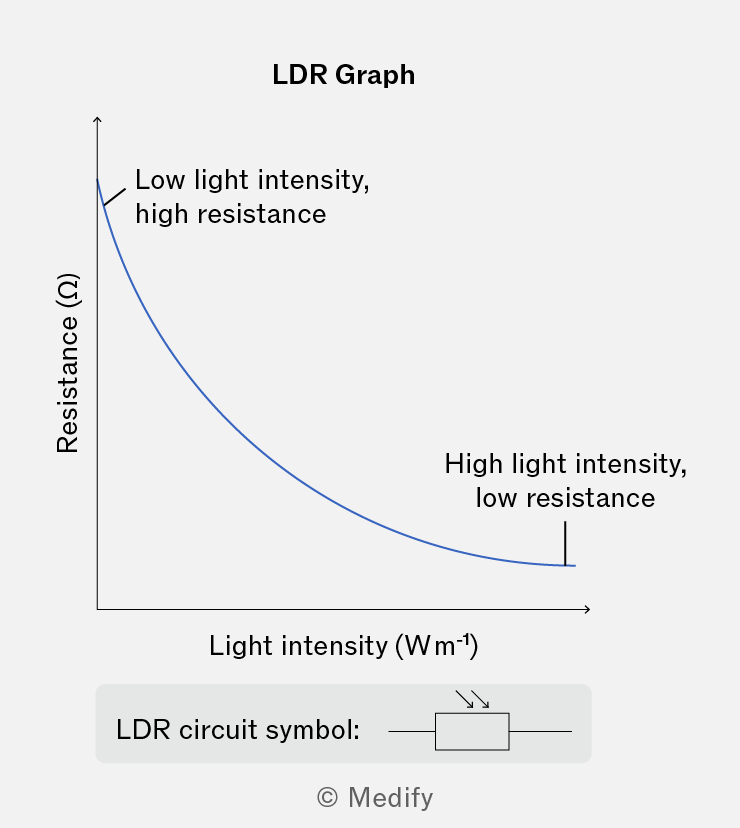
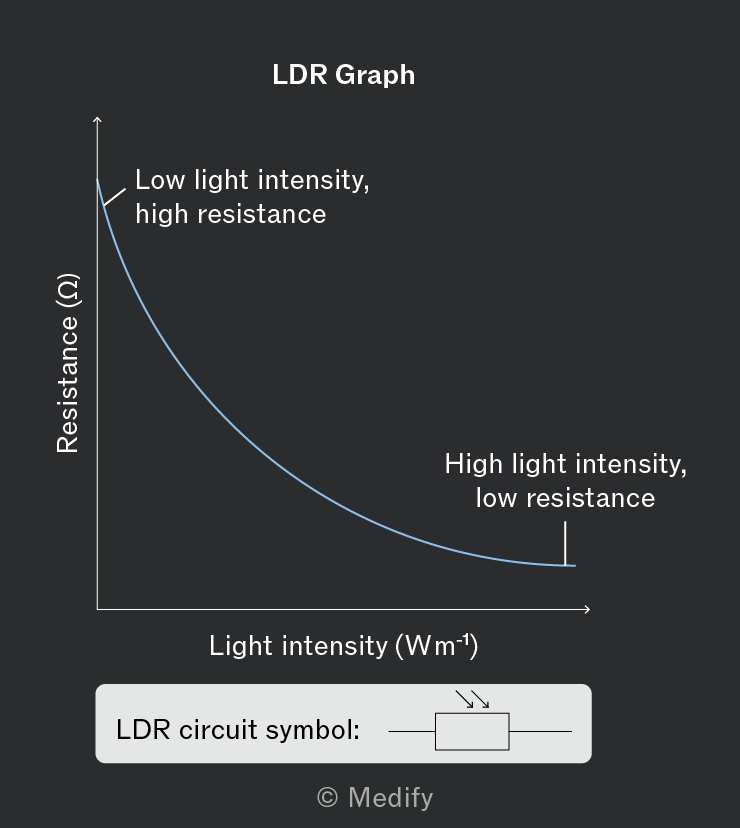
An LDR is made of a material such that when light shines on it, more charge carriers are made available to carry current, decreasing the resistance.
LDRs have applications in light-sensing circuits. For example, LDRs are used in street lights, which only turn on when the background light level is low.
Question walkthrough
Explaining Meter Readings in an LDR Circuit
Explain how ammeter and voltmeter readings change in a series LDR circuit as light intensity and a variable resistor's resistance are altered.