
Wave motion (4.4.1)
On this page
Mechanical waves require a medium through which to travel, such as air, water, or a solid. When a wave travels, the medium through which it moves is disturbed.
The particles of the medium oscillate about fixed points and return to their original position after the wave has passed. They are not transported with the wave.
Electromagnetic waves (such as radio waves, visible light, and X-rays) are not mechanical; they do not require a medium to travel through.
A progressive wave is a type of oscillation that transfers energy from one point to another, through the substance it travels in. They are also called travelling waves.
Examples of progressive waves include:
- sound waves
- water waves
- electromagnetic waves (light).
There are two types of mechanical waves:
- transverse waves
- longitudinal waves.
The type of wave depends on the direction of the particle oscillations in relation to the direction of the wave propagation:
- Transverse: oscillations are perpendicular to the wave propagation.
- Longitudinal: oscillations are parallel to the wave propagation.
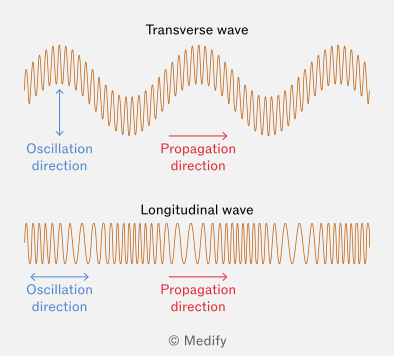
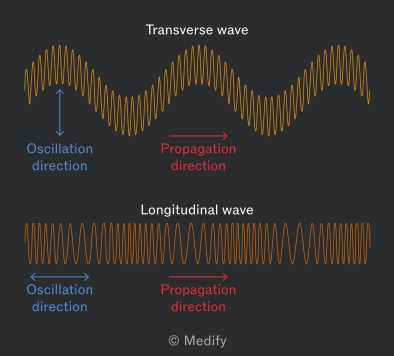
In a transverse wave, the particles of the medium oscillate perpendicular to the direction of wave propagation and energy transfer.
It is useful to know that trans means across – the oscillations cross the wave motion at right angles.
Examples of transverse waves:
- Electromagnetic waves – consist of perpendicular oscillating electric and magnetic fields.
- Vibrations on a guitar string – when you pluck a guitar string, it vibrates up and down, perpendicular to the length of the string.
- Waves on a rope – shaking one end of a rope will send transverse waves along its length.
In a longitudinal wave, the particles of the medium oscillate parallel to the direction of wave propagation and energy transfer.
It is useful to think long for a longitudinal wave, where the oscillations stretch along the same path as the wave.
Examples of longitudinal waves:
- Sound waves – particles of air (or another medium) oscillate back and forth in the same direction that the sound wave is travelling.
- Ultrasound waves – the same as sound waves, but at higher frequencies. Ultrasound waves are used in medical imaging.
- Springs – when a spring is compressed and released, longitudinal waves are seen as compressions and rarefactions travelling along the spring.
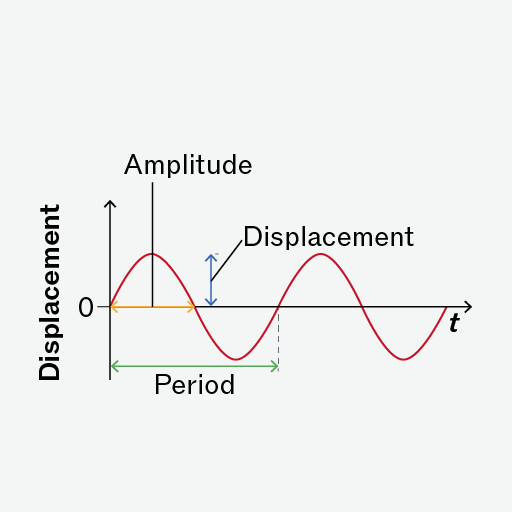
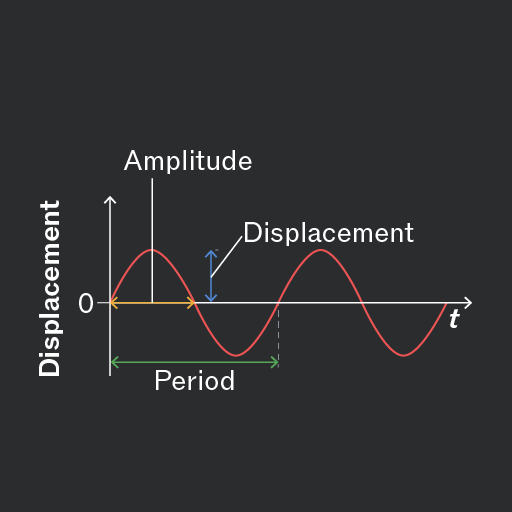
The displacement of a point on a wave is its distance from the equilibrium (resting) position.
Displacement is a vector quantity, meaning it has both magnitude and direction. It can be positive or negative, depending on whether the point is above or below the equilibrium position.
Displacement is measured in metres ().
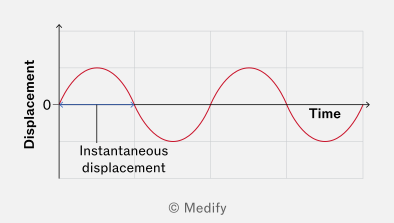
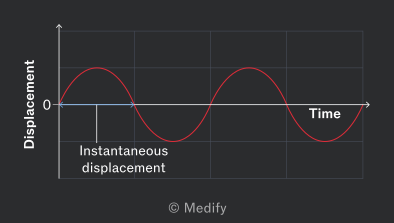
The amplitude is the maximum displacement of a point on a wave from its equilibrium position.
The amplitude indicates the energy of the wave; higher amplitudes correspond to waves carrying more energy.
Amplitude is measured in metres ().
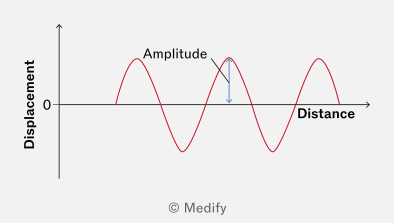
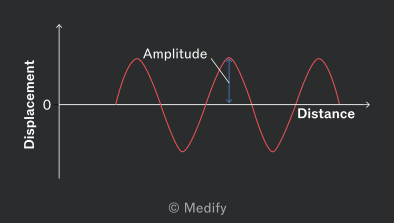
Throughout the wave cycle, each particle’s displacement changes continuously, but the wave’s amplitude remains constant.
Displacement is a vector quantity, whereas amplitude is a scalar quantity.
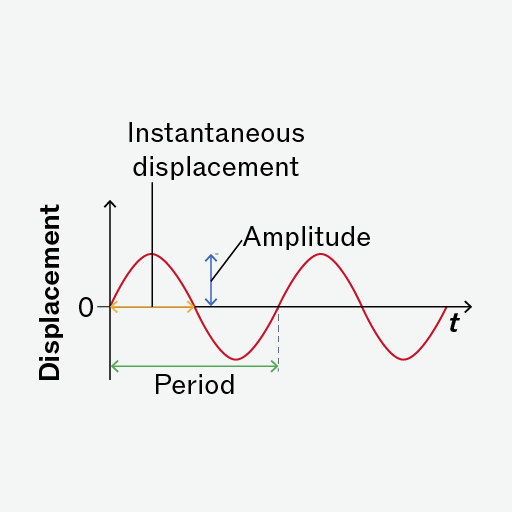
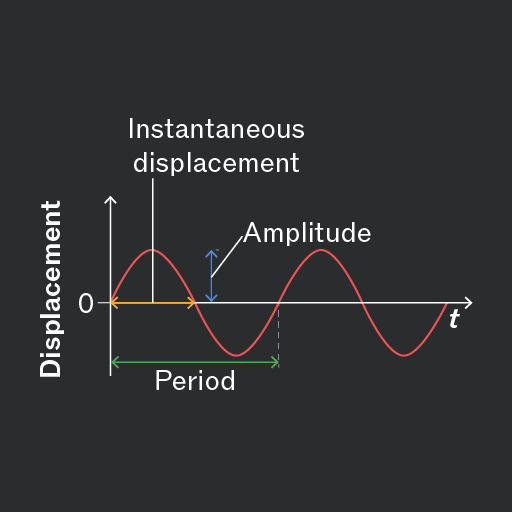
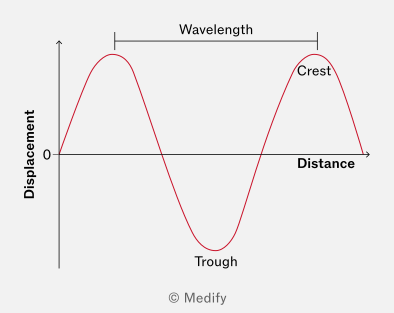
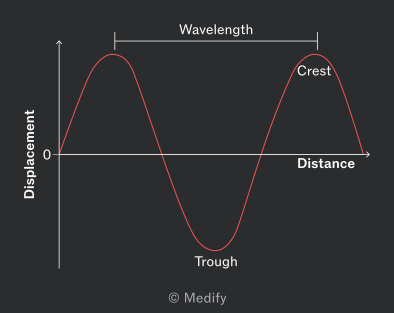
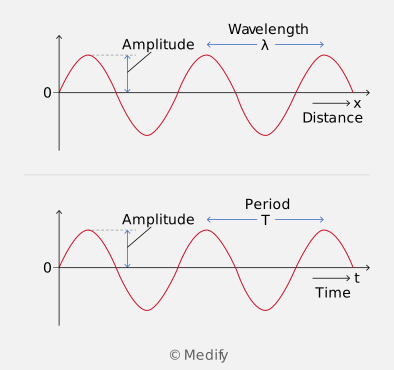
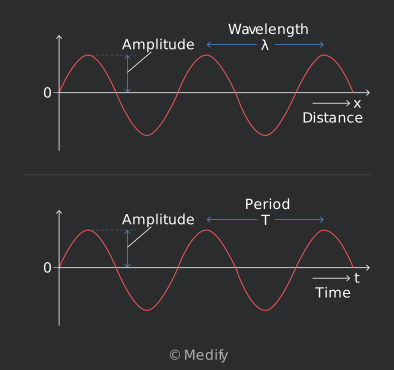
The wavelength is the distance between two similar points on successive oscillations of a wave.
These points can be peak to peak, trough to trough, or any other point as long as the distance is measured from one point to the same part of the next wave. It is essentially the length of one full wave cycle.
Wavelength is measured in metres ().
The period of a wave is the time taken for one complete oscillation (or cycle). Time period is measured in seconds ().
The frequency of a wave is the number of complete oscillations or wavelengths that pass a point per unit time. Frequency is measured in Hertz (), which are equivalent to ().
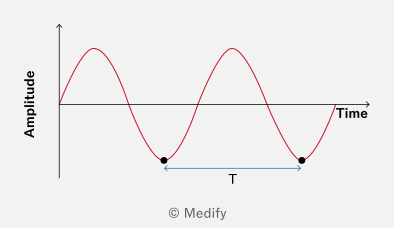
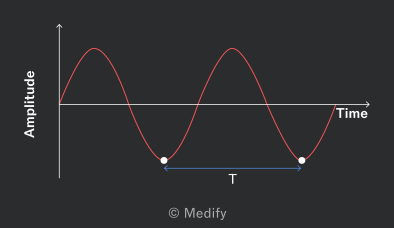
Frequency and time period are reciprocals of each other. They are related by:
The wave speed is the distance travelled by a wave per unit time. It is defined by the wave equation:
where:
- is wave speed
- is wave frequency
- is wavelength.
Wave speed is measured in metres per second ().
It is useful to know that the terms wave speed and wave velocity are often used interchangeably, but there is a subtle difference:
- Wave speed refers to the rate at which a wave travels through a medium. It is a scalar quantity; it has only magnitude.
- Wave velocity includes both speed and direction. It is a vector quantity; it has magnitude and direction.
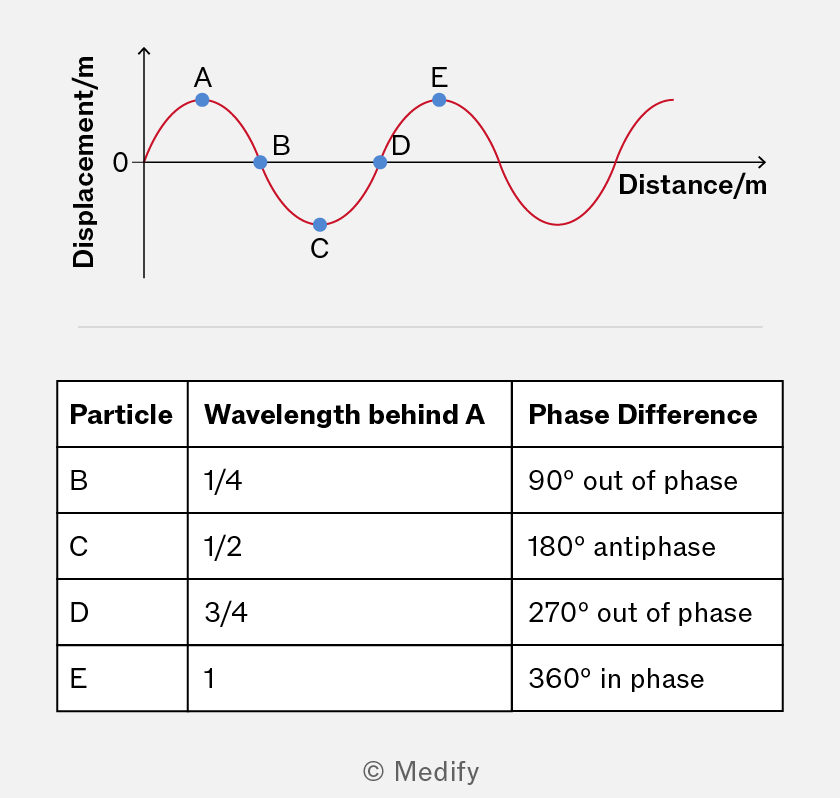
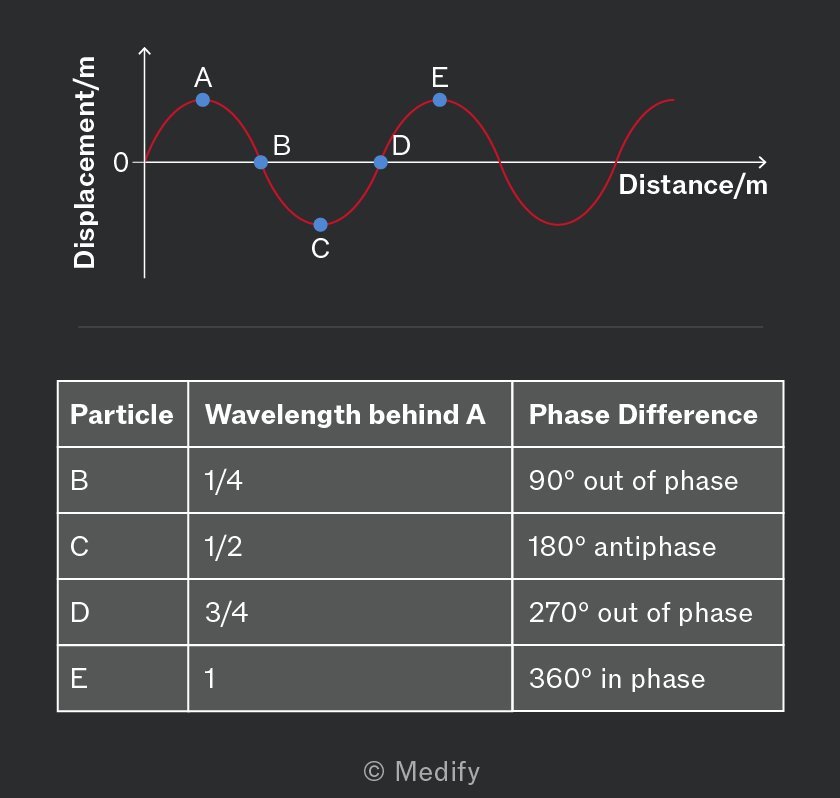
Phase difference is the difference in displacement of particles in the same wave or between particles in two different waves.
It is measured in degrees or radians (rad), where one complete cycle of a wave corresponds to or radians. It can also be expressed in terms of fractions of the wavelength, such as
The phase difference between particles oscillating in the same wave or between two particles in different waves can be described in one of three ways:
- Particles oscillating perfectly in sync (reaching maximum positive displacement simultaneously) are in phase, with a zero phase difference. Separated by one wavelength, the phase difference is radians); two wavelengths, radians), and so on.
- Particles oscillating oppositely (one at max positive, the other at max negative) are in antiphase, with a phase difference of ( radians).
- If the phase difference is any angle other than the waves are considered out of phase.
An oscilloscope is an instrument used to display and analyse the waveforms of electrical signals. It can be used as a DC or AC voltmeter.
An oscilloscope will typically show:
- Time on the X axis (called the time-base), usually in units of milliseconds per division (ms div−1), where each line corresponds to a millisecond.
- Voltage on the Y axis, representing the amplitude of the wave.
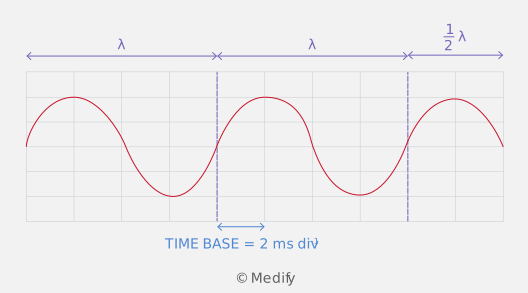
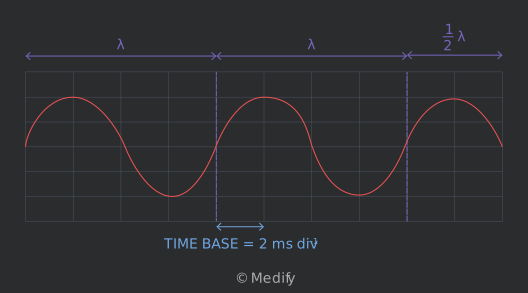
Oscilloscope readings are often used to calculate the frequency of a wave. To do this:
- Determine the period by reading the time for one complete wave cycle from the time-base setting.
- Convert the period into seconds.
- Use the relationship to calculate the frequency.
When dealing with wave graphs, be careful to read the axes labels, as the type of axis (time or distance) will determine what parameters can be interpreted from the graph.
A wave on a string might be represented by a distance–time graph, whereas oscilloscopes plot the voltage of an electrical signal against time.
Question walkthrough
Finding Frequency from an Oscilloscope Trace
Use an oscilloscope trace and its time-base setting to determine the period of a wave, then calculate its frequency.
Frequency and time period are reciprocals of each other.
Frequency is the number of complete oscillations or cycles that pass a point per second, measured in Hertz (Hz), where 1 Hz = 1 cycle per second.
The time period is the time taken for one complete oscillation or cycle of a wave, measured in seconds (s).
If more cycles occur per second (a higher frequency), each cycle must take less time (a lower time period), hence the inverse relationship.
This is expressed mathematically as:
Question walkthrough
Comparing Ocean and Sound Wave Frequencies
Calculate the frequency of an ocean wave from its period, then compare it with a sound wave's frequency to find how many times faster one oscillation is than the other.
The wave equation connects three fundamental properties of waves:
- Wave speed the speed at which the wave travels through a medium (measured in ).
- Frequency the number of complete wave cycles that pass a point in one second (measured in ).
- Wavelength the distance between successive points of similar phase in the wave, such as crest to crest (measured in ).
This relationship between these properties is written mathematically as:
The wave equation applies to all waves, whether they are transverse or longitudinal.
For a constant wave speed, wavelength and frequency have an inversely proportional relationship:
Therefore (for a constant wave speed):
- Longer wavelengths: fewer wave cycles pass a point per second, resulting in a lower frequency.
- Shorter wavelengths: more wave cycles pass a point per second, resulting in a higher frequency.
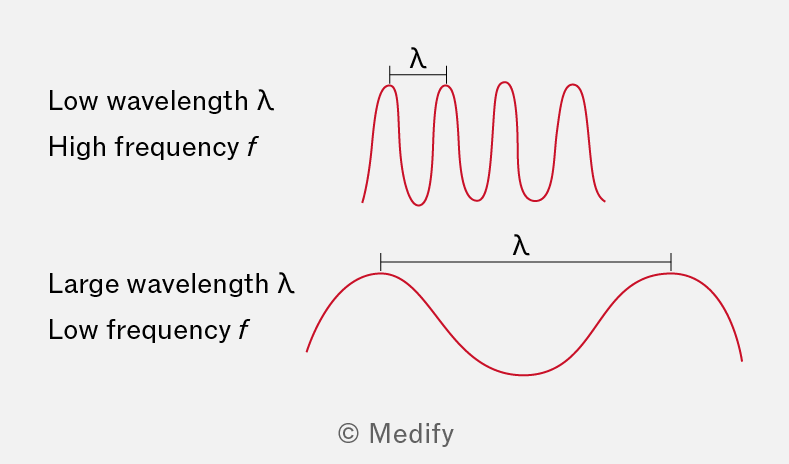
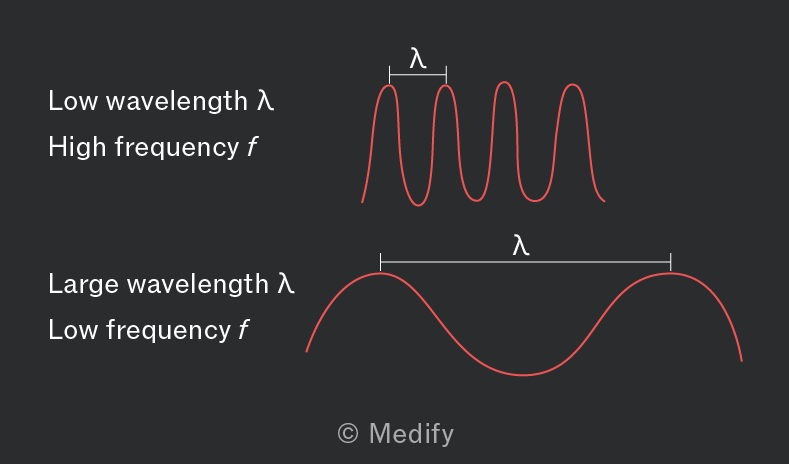
For electromagnetic waves in a vacuum, the wave equation is:
Where:
- represents the speed of light in a vacuum (approximately ,
- is the frequency (),
- is the wavelength ().
In a given medium, the speed of electromagnetic waves is constant, unlike mechanical waves.
Note the following conventions:
- Use for electromagnetic waves (such as light and radio waves) propagating in a vacuum.
- Use for mechanical waves (such as sound and water waves) or electromagnetic waves propagating through a medium.
To remember the form of the wave equation, look at the units of the components and ensure you are combining them in a coherent manner.
- Wave speed measured in
- Frequency measured in , which is equivalent to cycles per second or
- Wavelength measured in .
By rearranging the units, you can confirm the correct form of the equation. For instance, multiplying frequency () by wavelength () yields the unit of wave speed (), which shows that the equation below has consistent units and so must be the correct form:
Checking units can also prevent errors, especially when converting between metric units (such as centimetres to metres) or applying the equation in unfamiliar contexts.
Question walkthrough
Wavelength of a Sound Wave
Rearrange the wave equation v = fλ to calculate the wavelength of a sound wave, given its frequency and speed of propagation through air.
To represent transverse waves on a graph, we need two axes: one for the wave direction (X axis) and one for the displacement of the particles (Y axis). This is because transverse waves involve vibrations of particles that are perpendicular to the direction of energy transfer.
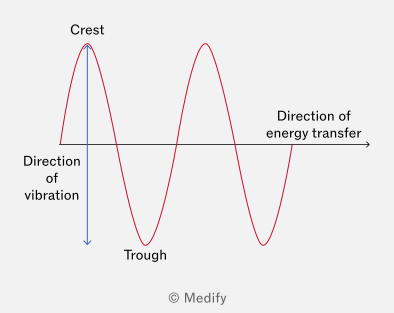
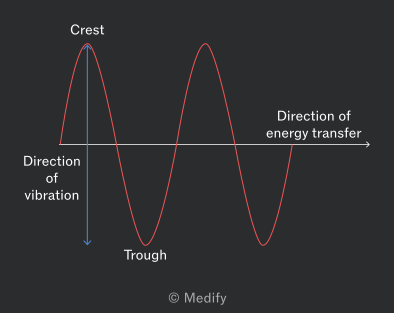
You should be able to label the significant features of the transverse wave:
- Peaks/crests: the points of maximum positive displacement
- Troughs: the points of maximum negative displacement
- Amplitude: the maximum displacement from the undisturbed state (zero on the Y axis).
Longitudinal waves have particle displacement in the same direction as wave travel.
A longitudinal wave can be plotted graphically. The Y axis can represent longitudinal particle displacement. The displacement of a particle at each position along the X axis from its equilibrium position.
This will produce a graph that looks like a transverse wave. However, as the axis explicitly states that it represents longitudinal displacement, the particles are still vibrating parallel to the direction of the wave.
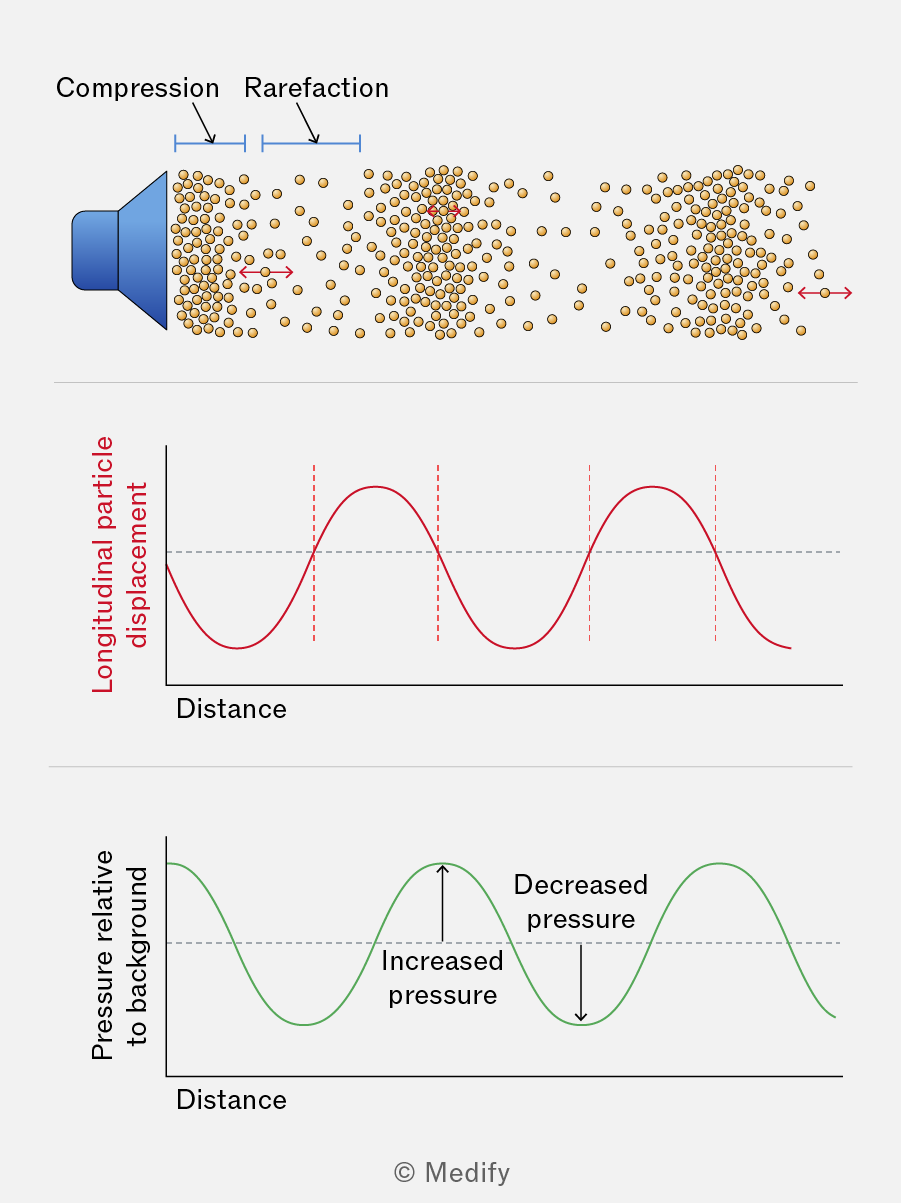
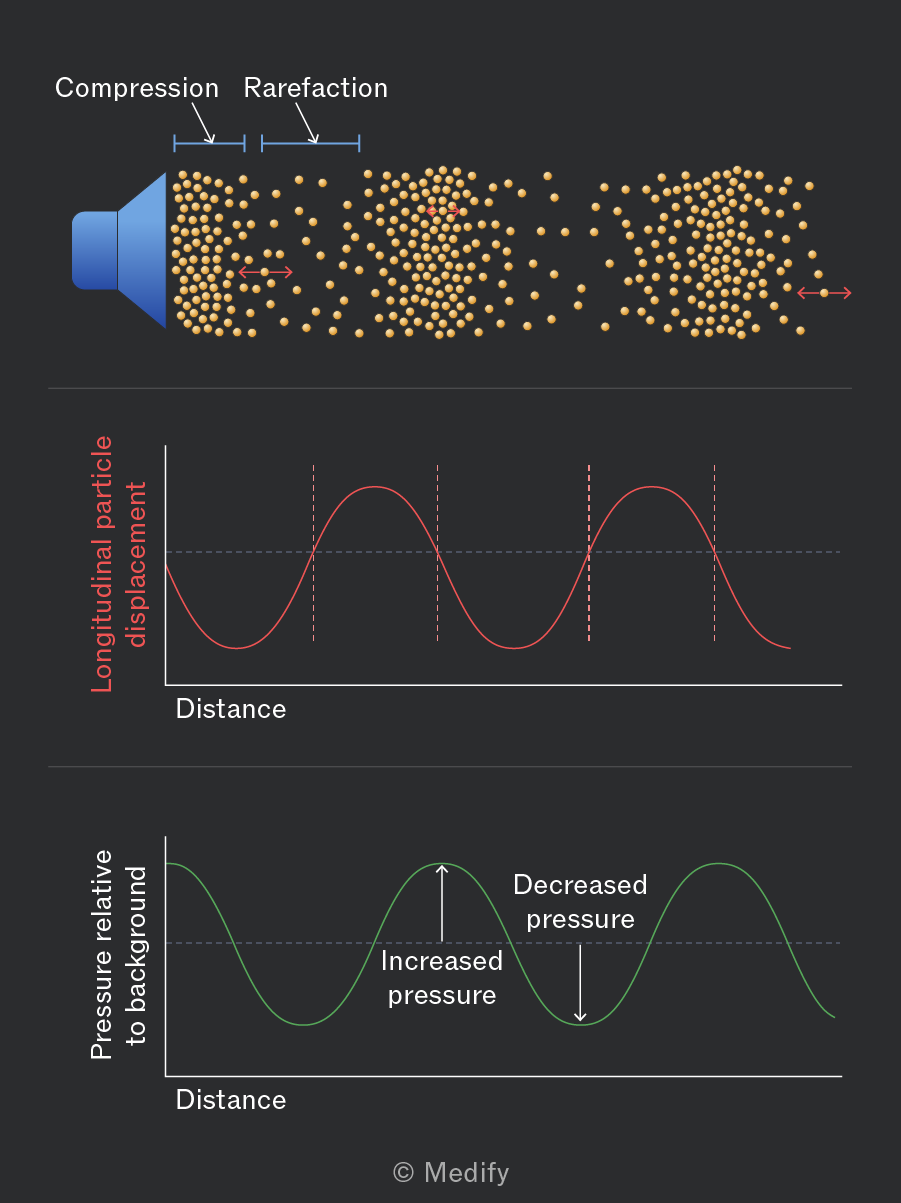
The Y axis may also represent another parameter describing the wave, such as pressure for a sound wave.
You should be able to label the significant features of the longitudinal wave:
- Compressions: areas of high pressure where the particles are clustered closer together (think: the particles are compressed)
- Rarefactions: areas of low pressure where the particles are spread further apart (think: the particles are rarer in this area).
Question walkthrough
Wave Type and Frequency from Oscilloscope
Identify the type of wave shown on an oscilloscope trace and calculate its frequency from the time base setting, in the context of measuring the speed of sound.
Refraction occurs when a wave passes from one medium to another, changing its speed. Refraction is best understood by considering light passing from one medium to another, such as from air to glass.
At the boundary between the two media, the light rays experience a change in direction, caused by a change in the light’s speed.
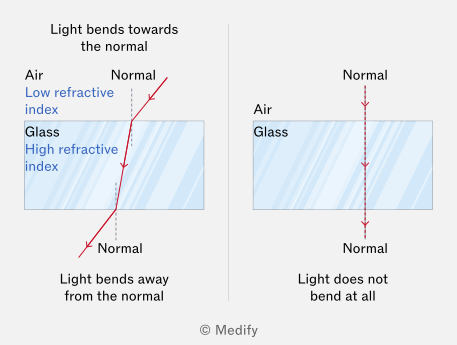
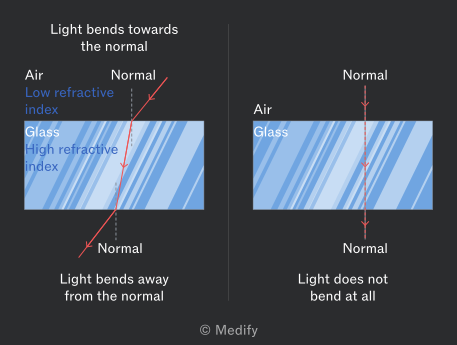
To understand how light bends, use the normal. An imaginary line perpendicular to the surface where the two media meet.
The angle of incidence (the angle of incoming light) and the angle of refraction (the angle of refracted light) are measured relative to this line, which is typically represented by a dotted line in diagrams.
When light passes from a medium with a lower refractive index to one with a higher refractive index, it slows down and bends toward the normal. This happens because wave fronts hitting the denser material slow down first on the side closest to the boundary.
Conversely, when light moves from a region of higher refractive index to one of lower refractive index, it speeds up and bends away from the normal. This is because the wave fronts speed up, beginning with the part farthest from the boundary.
If light travels along the normal, all wave fronts reach the new medium at the same time and maintain their straight path.
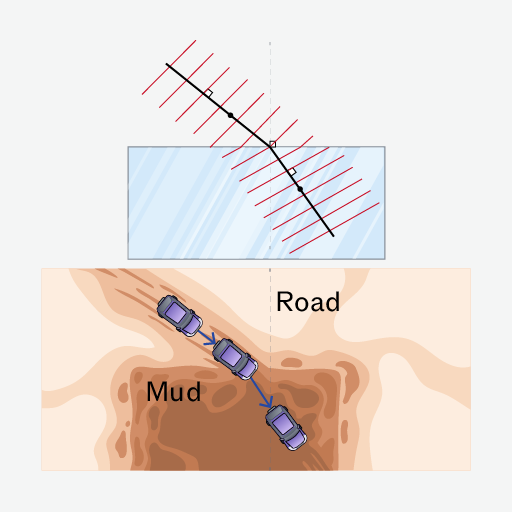
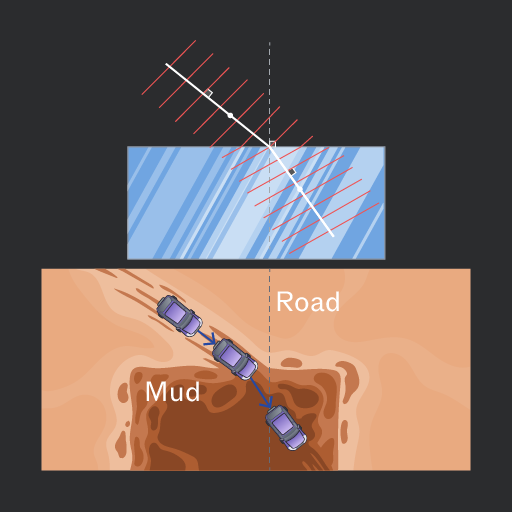
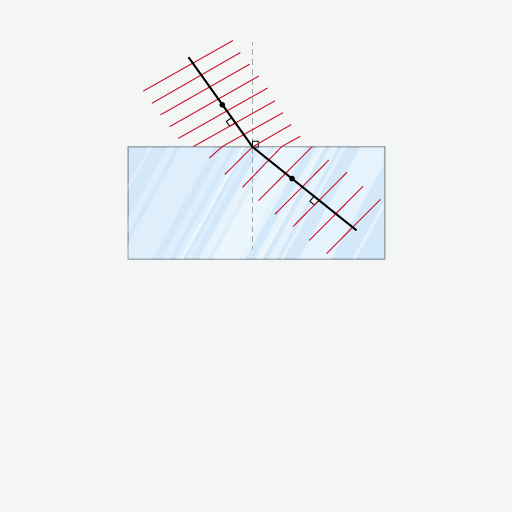
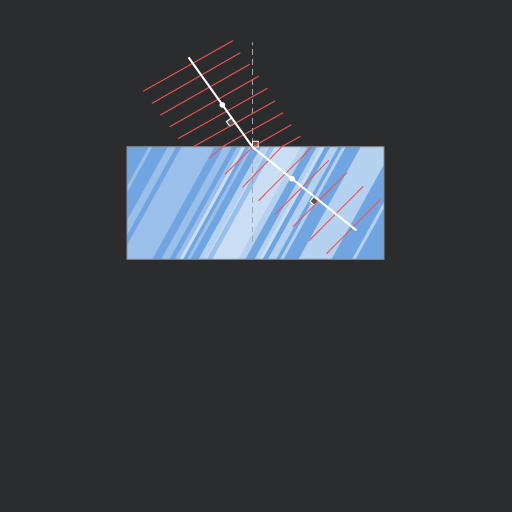
When light refracts, its speed and wavelength change to match the properties of the new medium, but its frequency remains constant. This is a consequence of the conservation of energy.


A straw in a glass of water illustrates that frequency remains constant when it passes between two media. The appearance of the shape changes (the straw looks bent), but the colour of the straw remains the same in both air and water.
The frequency of light determines its colour (for example, red light has a wavelength of . Therefore, if the colour is the same, the frequency is the same.
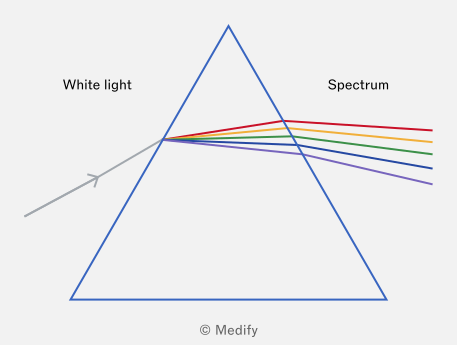
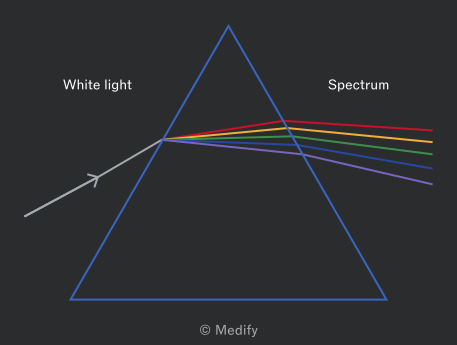
When white light enters a prism, it refracts and splits into its component colours – the visible spectrum. This is called dispersion. Dispersion occurs because each colour in the spectrum has a slightly different wavelength and, therefore, refracts by a different amount.
Violet and red are at opposite ends of the visible spectrum. Violet light has a shorter wavelength than red light, so it refracts more strongly.
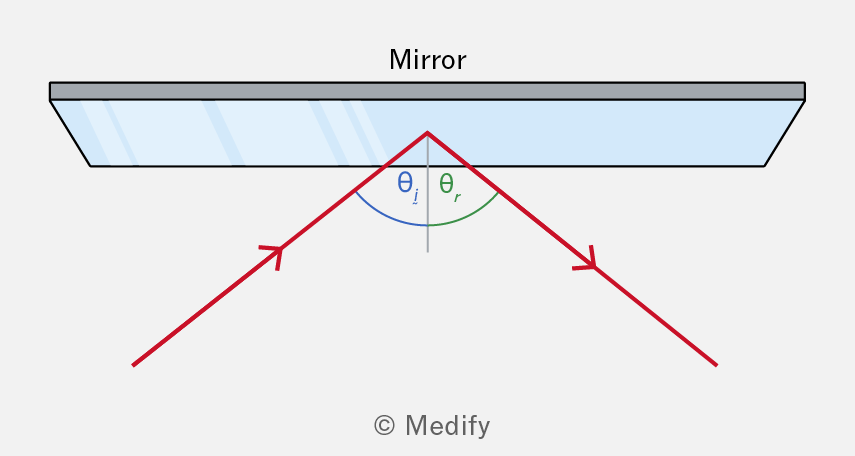
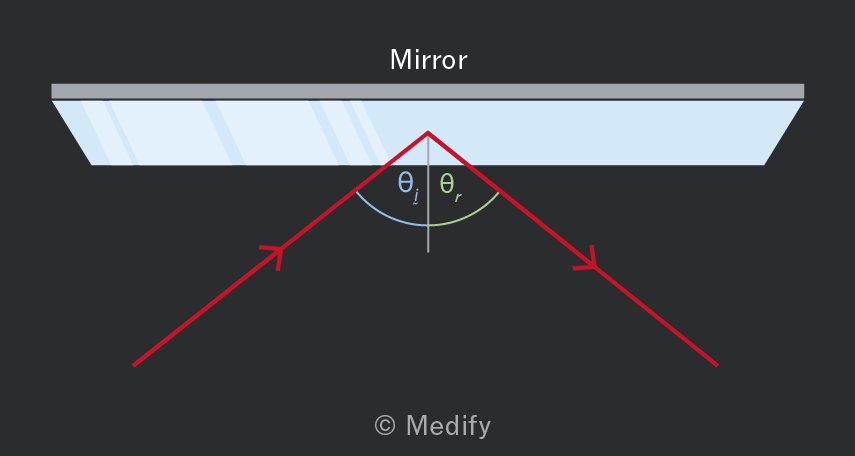
When light waves encounter a surface, they bounce off, creating a reflection. The law of reflection applies to waves reflected at a boundary – the angle of incidence is always equal to the angle of reflection :
- The angle of incidence is the angle between the incoming wave and the normal to the surface, and
- The angle of reflection is defined as the angle between the reflected wave and the normal.
Light reflecting off a mirror demonstrates the law of reflection:
Diffraction occurs when waves pass through a narrow gap (aperture) or around an obstacle, causing them to spread out as they pass through. Diffraction is a property of all types of waves, including sound, light, and water waves.
Waves are usually represented in diagrams as wavefronts, where each front shows a line of constant phase.
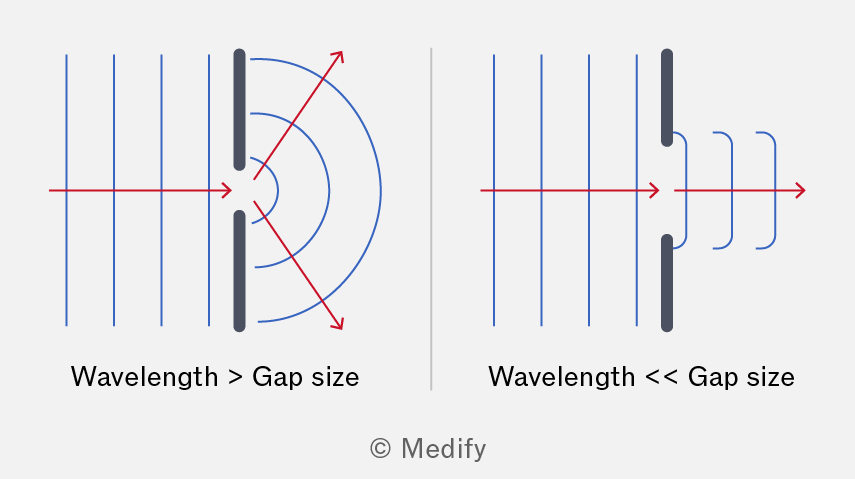
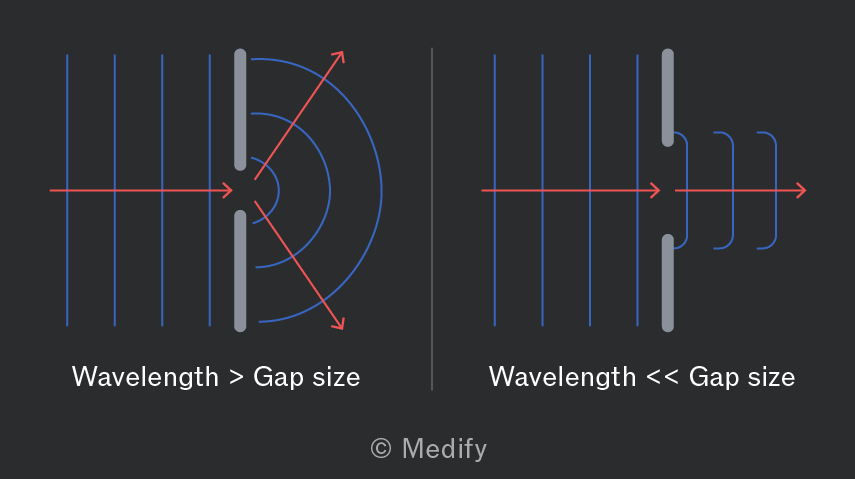
Diffraction is most pronounced when the gap size is comparable to or smaller than the wave’s wavelength. If the gap is much larger than the wavelength, the wave continues with minimal diffraction.
Wavelength, frequency, and wave speed remain unchanged during diffraction.
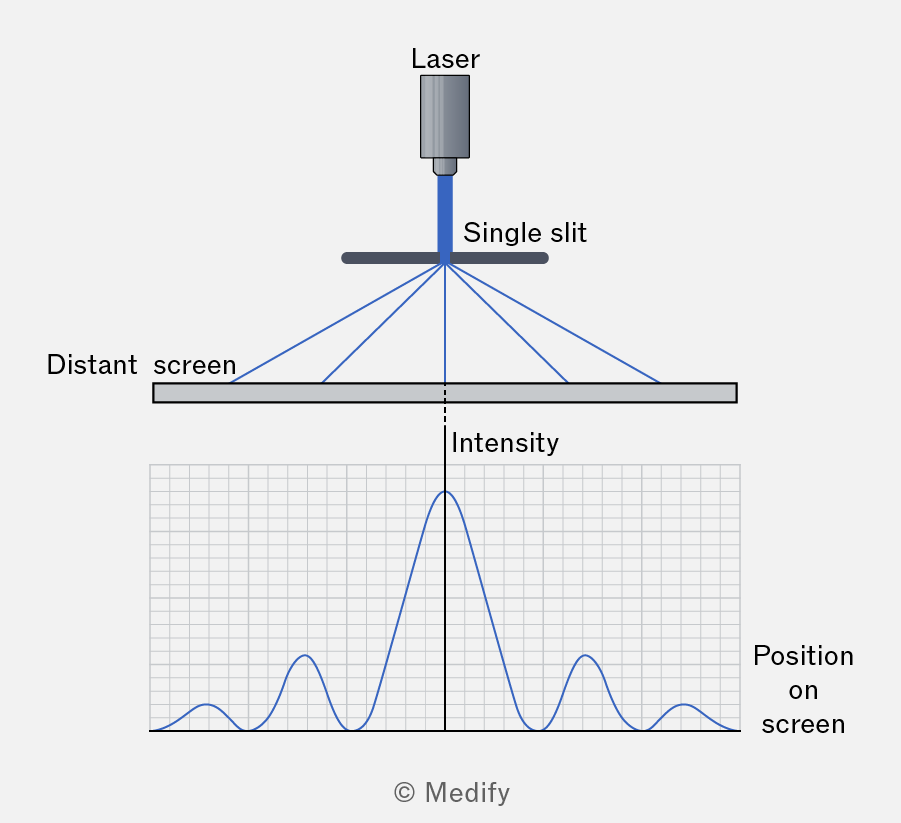
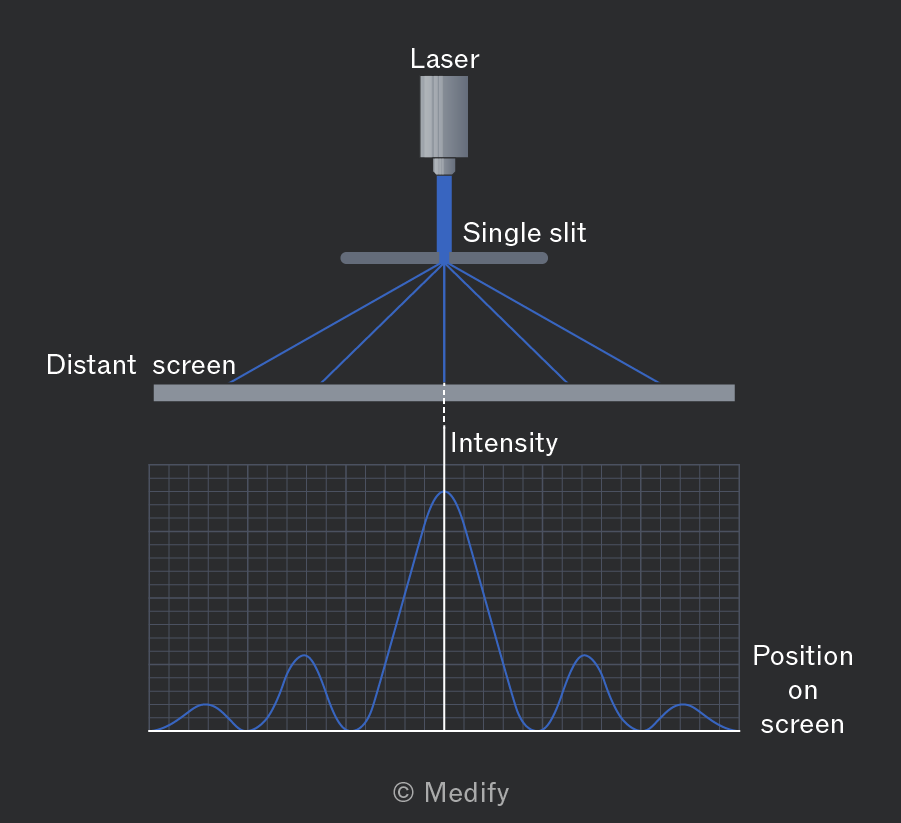
Diffraction of a wave leads to a diffraction pattern, which consists of maxima and minima intensity points.
For light waves, this corresponds to a series of dark and light fringes.
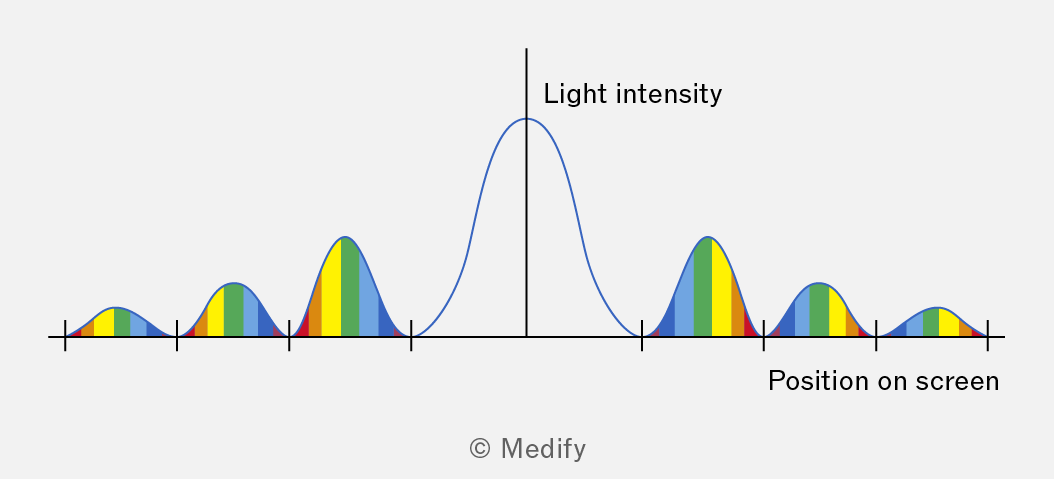
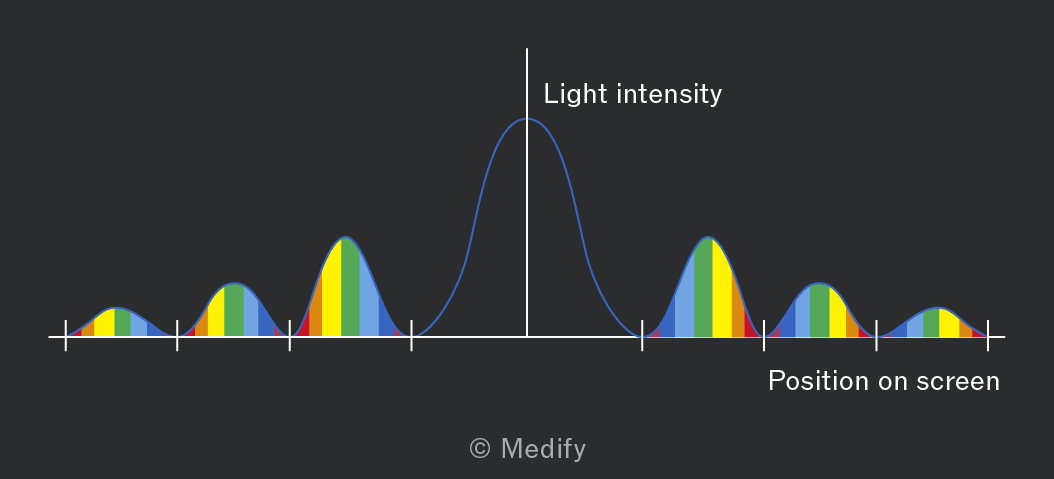
A diffraction pattern is visible when a laser is directed at a narrow slit where the slit width is larger than, but comparable to, the wavelength of the laser light. For laser light, a bright central fringe appears, surrounded by smaller fringes of decreasing brightness on either side.
If polychromatic white light is directed at a single slit (which is larger than visible light wavelengths), the central maximum will be white, and each fringe beyond it will show a spectrum of colours:
- Violet and blue light (shorter wavelengths) appear closest to the central maximum since they diffract the least.
- Red light (longer wavelengths) appears further out since it diffracts the most.
A ripple tank is used to model wave effects: reflection, refraction, interference, and diffraction.
The tank setup includes a motorised bar or small dipper placed above the water surface:
- The straight-edged bar produces plane waves (parallel wavefronts).
- The dipper generates circular waves (expanding wavefronts), which is useful for observing wave spreading.
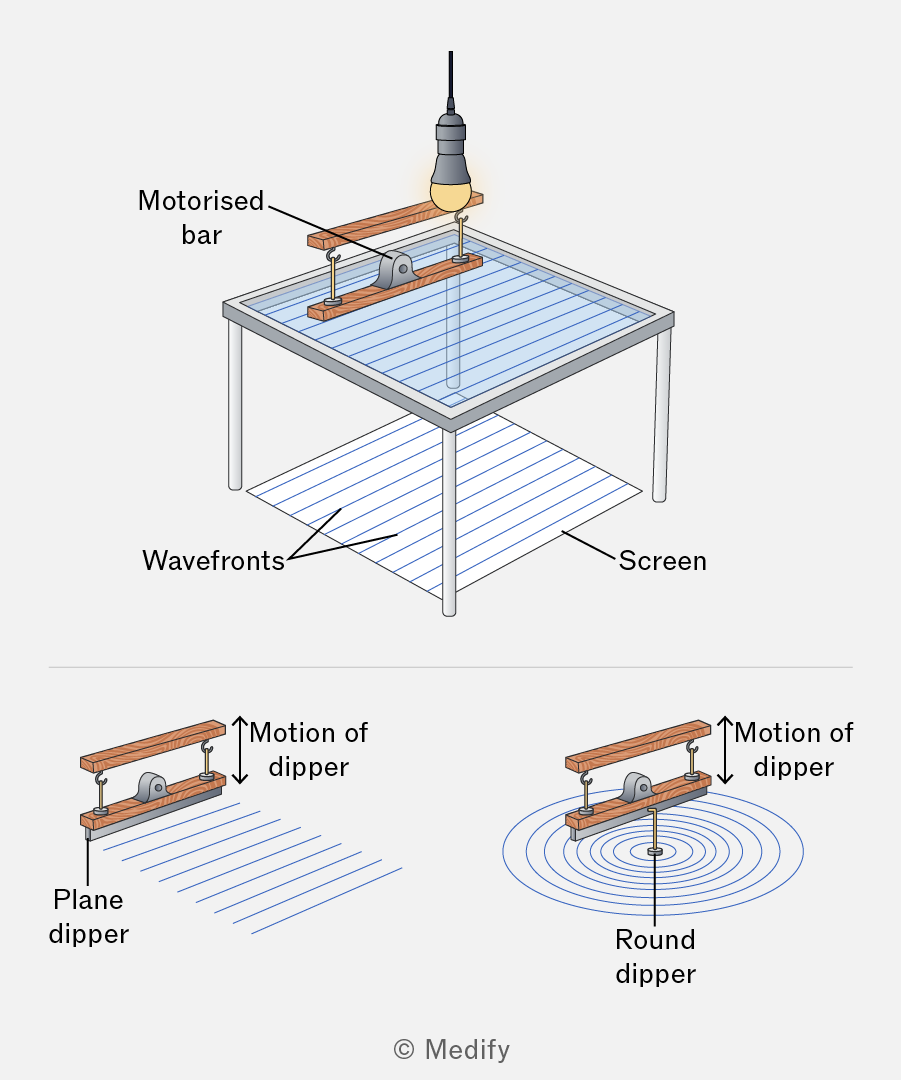
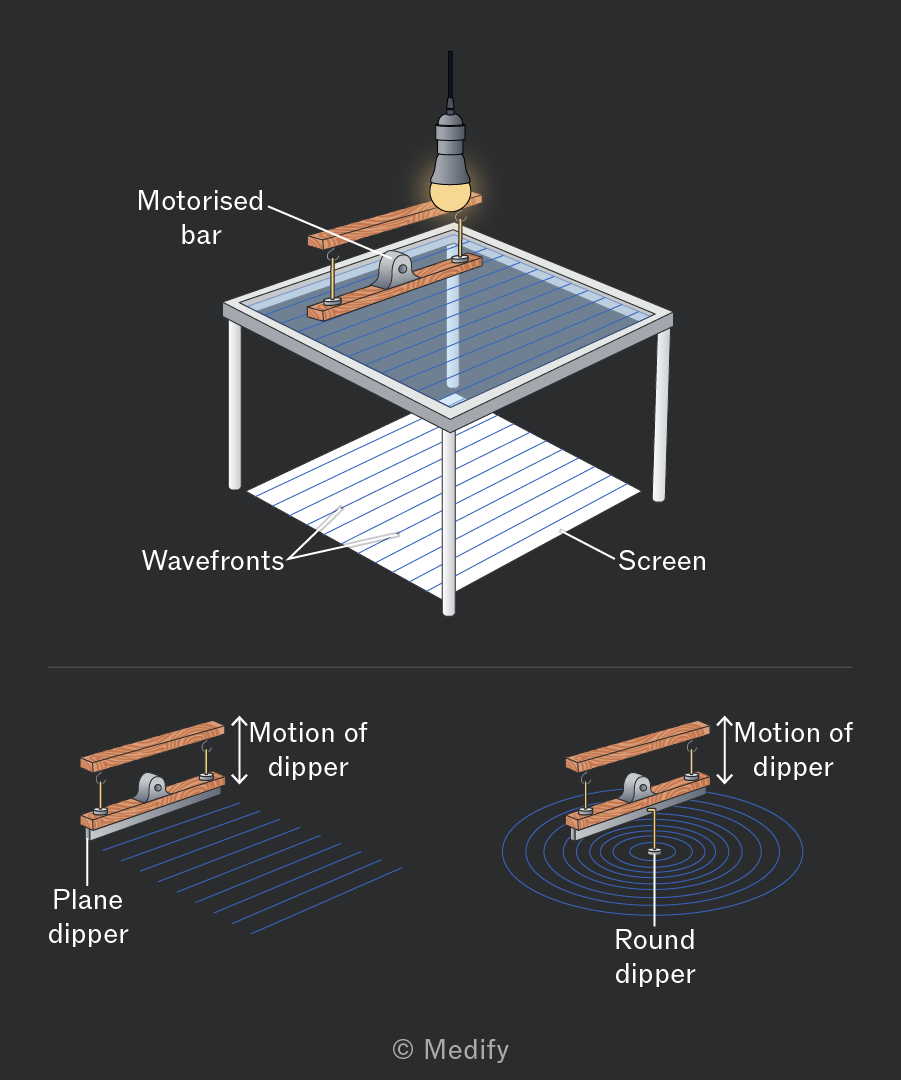
A light source positioned above the tank projects shadows of the wave crests and troughs onto a screen below. The distance between crests (or troughs) represents the wavelength.
The wave speed can be determined by timing how long it takes the waves to move across the tank, which enables the calculation of their frequency using the wave equation.
A ripple tank is used to model wave effects: reflection, refraction, interference, and diffraction. Waves are created in a shallow tank of water using a motorised bar or dipper.
- To study reflection, obstacles can be placed in the tank, such as flat or curved surfaces, creating scenarios where the angles of incidence and reflection can be measured relative to the normal.
- For refraction experiments, a glass sheet can be placed in the tank to create a shallower region, where the wave speed is slower. Waves passing into the shallower region change direction, bending toward the normal.
- Diffraction can be demonstrated by placing an obstacle with a small gap in the tank. The gap can be varied to observe how the diffraction effect changes.
- Interference can be observed by creating overlapping waves from two dippers. When water waves meet, they interfere constructively at crests and destructively at troughs.
Polarisation occurs only in transverse waves, with vibrations perpendicular to the direction of propagation.
When a wave is polarised, its vibrations are restricted to one plane perpendicular to its direction of travel.
Longitudinal waves cannot be polarised because their vibrations occur parallel to the direction of propagation – they are already oscillating in one plane.
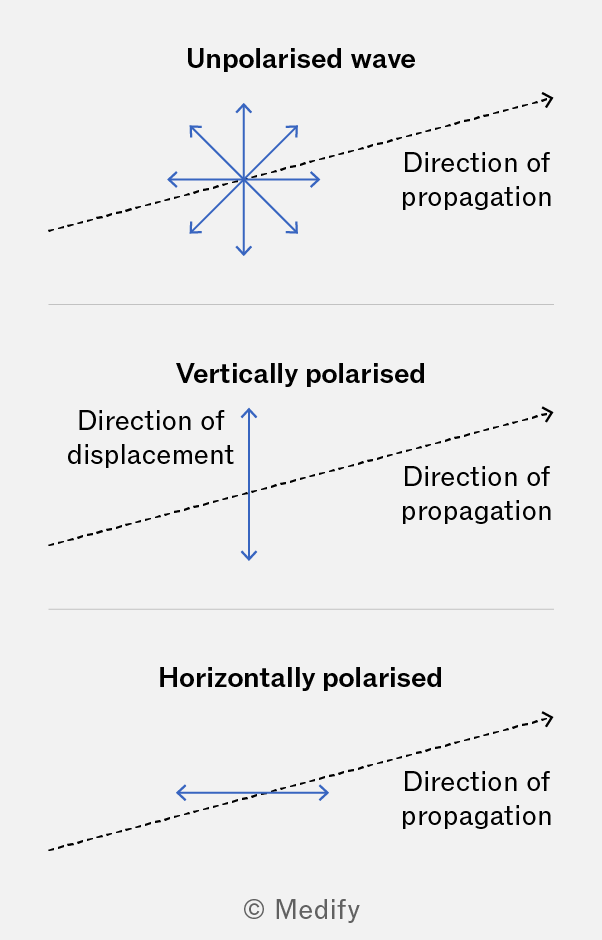
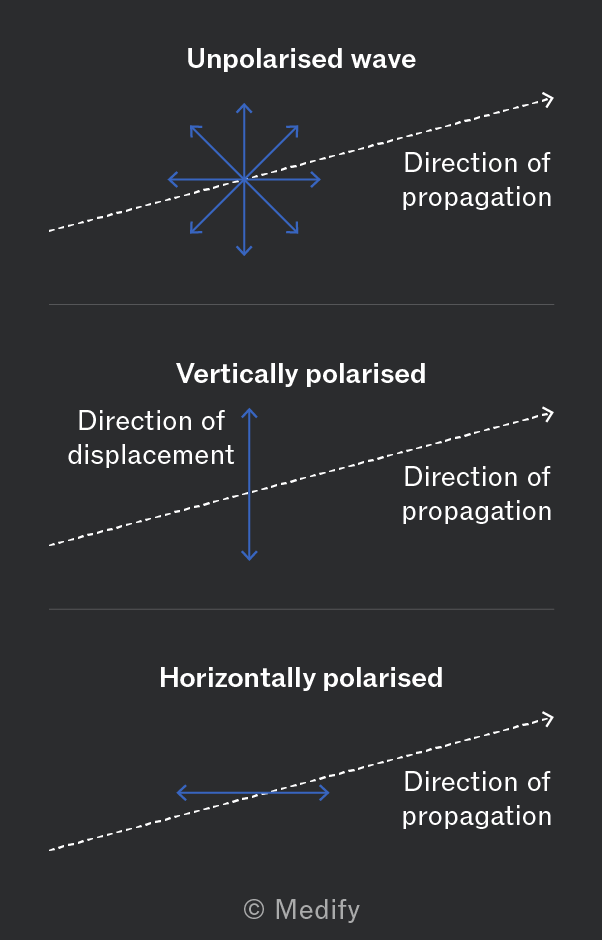
In electromagnetic waves, by convention, polarisation refers to the direction of the electric field oscillation rather than the magnetic field.
For example, if an electromagnetic wave is vertically polarised, its electric field oscillates in the vertical plane, even if the magnetic field oscillates horizontally.
Unpolarised light, like that from the sun or a lightbulb, has vibrations that occur in all directions perpendicular to the direction of wave travel.
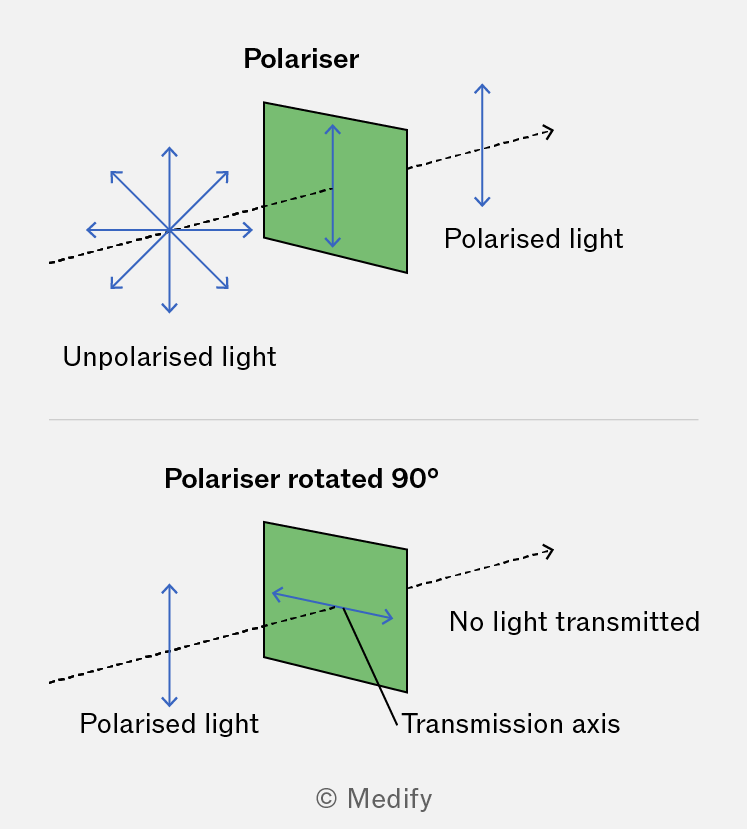
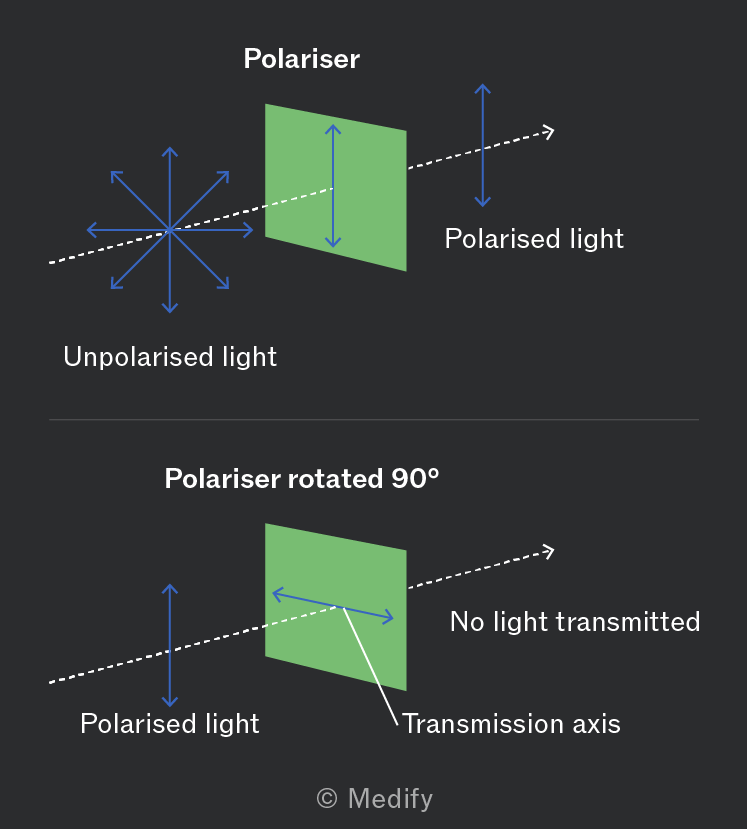
To convert unpolarised light into polarised light, it must pass through a polarising filter, which restricts oscillations to a single plane, creating plane-polarised waves.
- If unpolarised light passes through a filter, only the component aligned with the filter’s transmission axis will pass through, blocking all other directions.
- If polarised light encounters a filter with a perpendicular transmission axis, no light passes through because the filter blocks the aligned oscillations.
Polarisation can also occur through reflection, refraction, and scattering.
Microwaves are polarised using a metal grille instead of a filter. A metal grille polariser works differently from a polarising filter:
- The free electrons in the metal bars of the grille align and move to block any electric field component parallel to the grille bars. This only allows the perpendicular electric field component to pass through.
- This is opposite to the way a polarising filter works: A polarising filter restricts waves from oscillating in the direction aligned with its transmission axis.
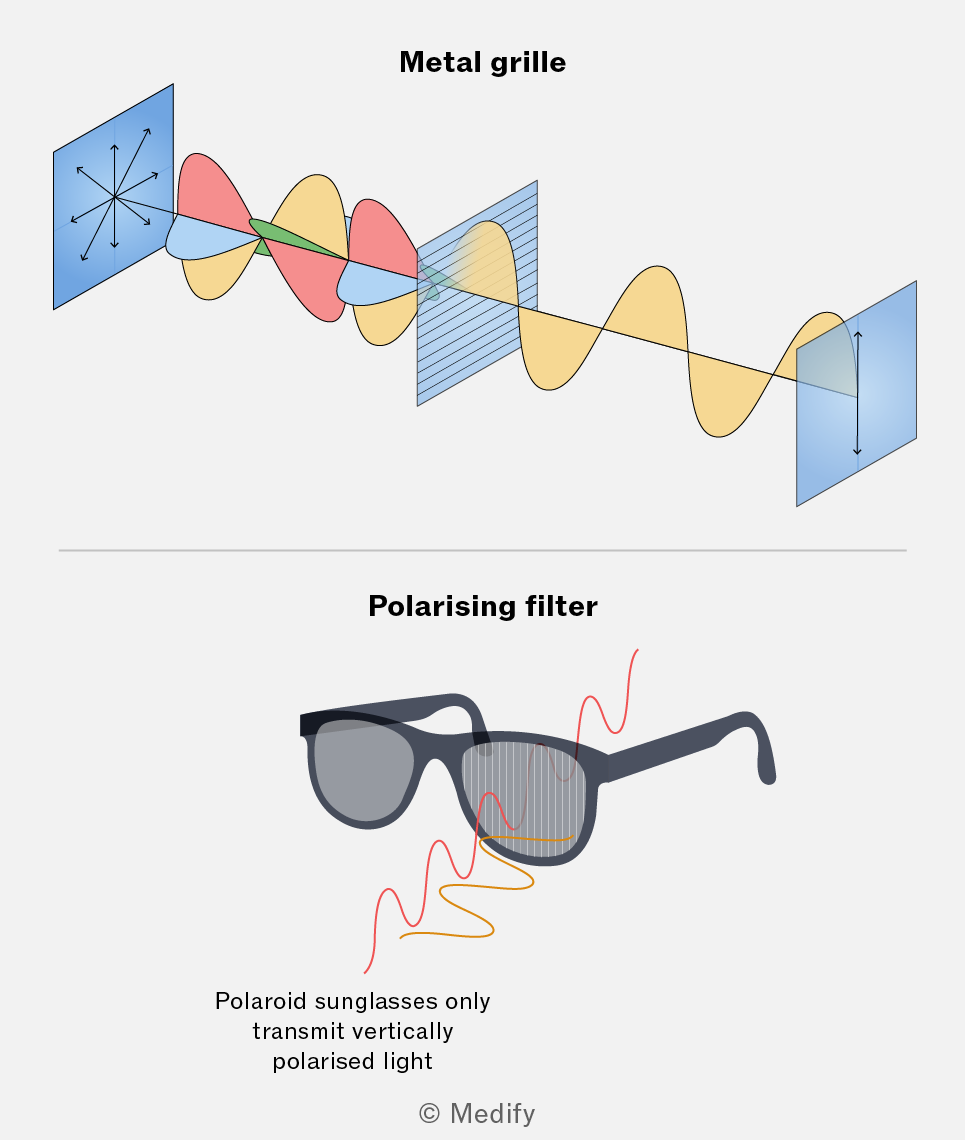
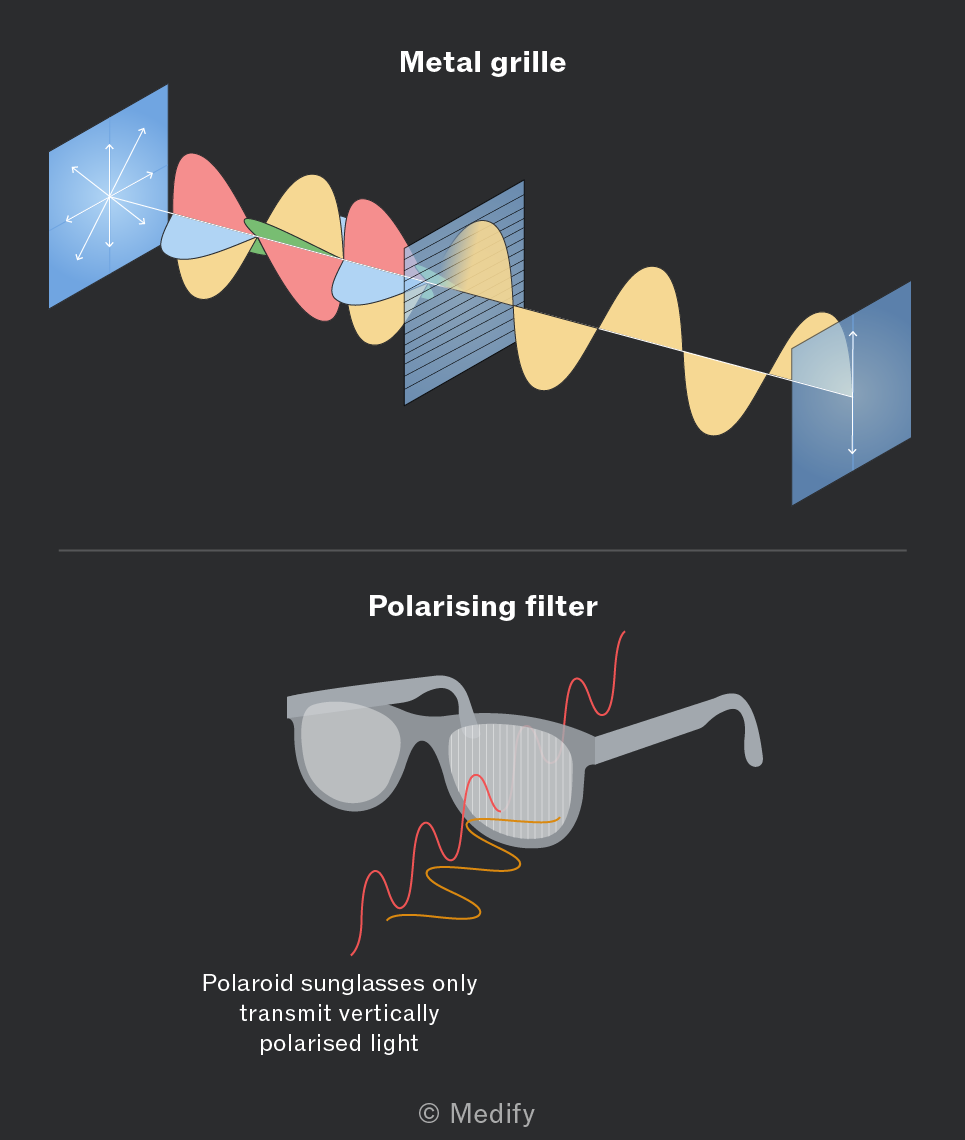
This setup is particularly useful in physics labs to study polarisation principles since microwaves have longer wavelengths compared to visible light , so high precision equipment is not required – the metal grilles have large gaps and are easily constructed.
The effect of polarisation on light intensity can be investigated by placing two polarising filters, A and B, one after the other:
Filter A polarises the initially unpolarised light in a specific direction, allowing only the light oscillations along its transmission axis to pass:
- If Filter B has its transmission axis aligned parallel to Filter A, it will allow all the polarised light from A to pass through.
- In this parallel arrangement, the transmitted polarised light is as at its maximum intensity.
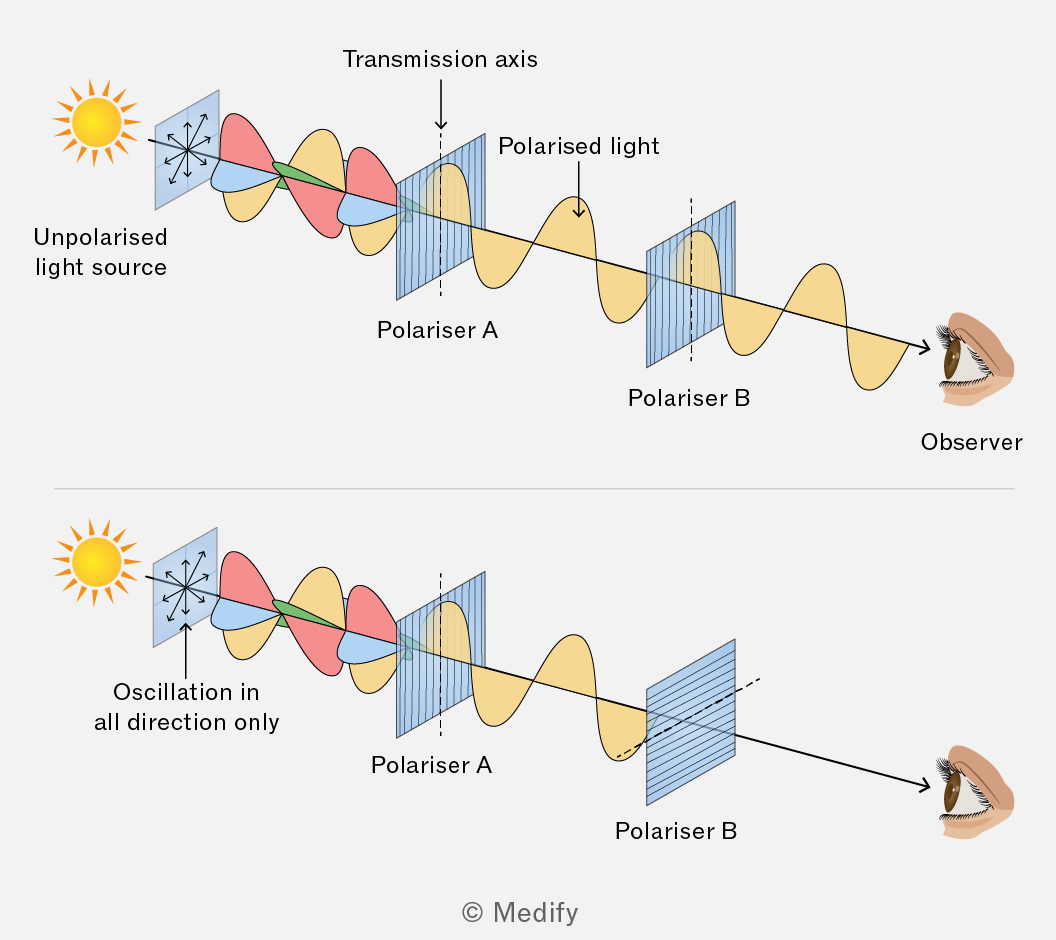
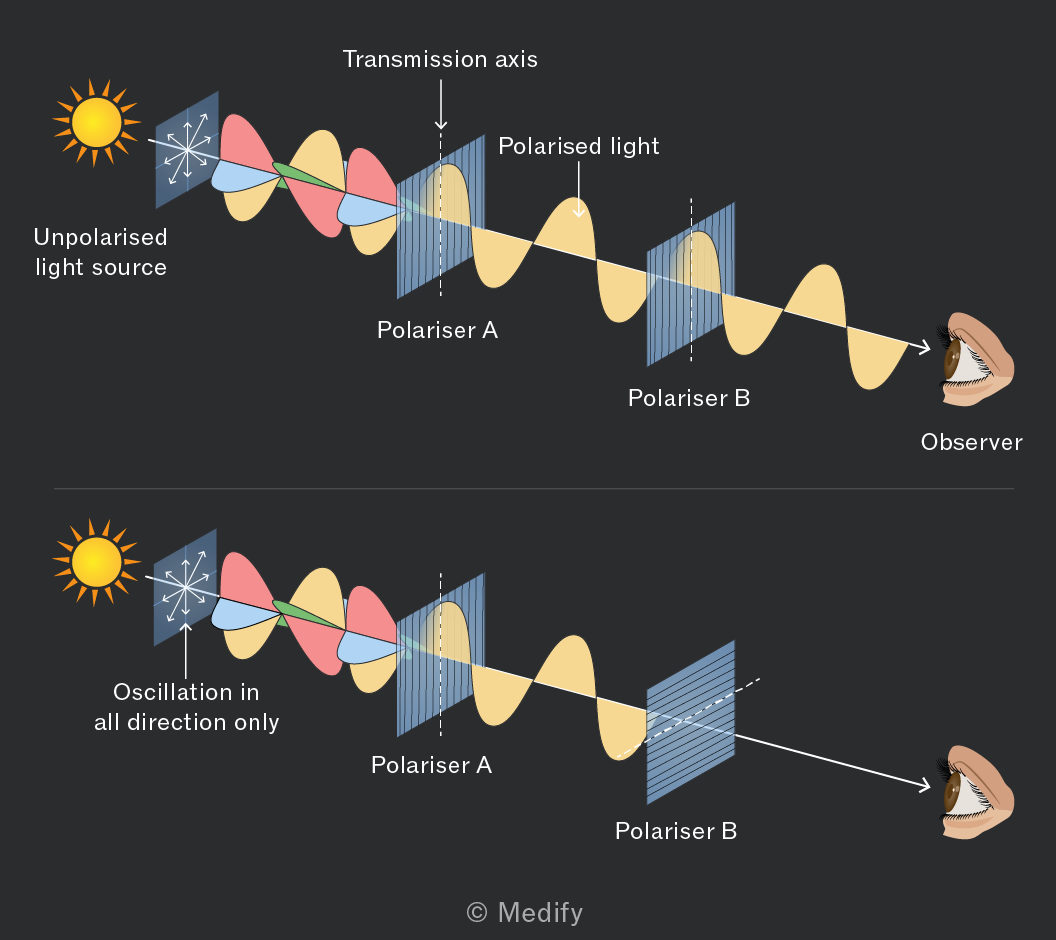
Rotating Filter B gradually reduces the amount of light that can pass through, lowering the intensity:
- When the transmission axes are perpendicular, Filter B blocks all the light polarised by Filter A, resulting in zero transmitted intensity.
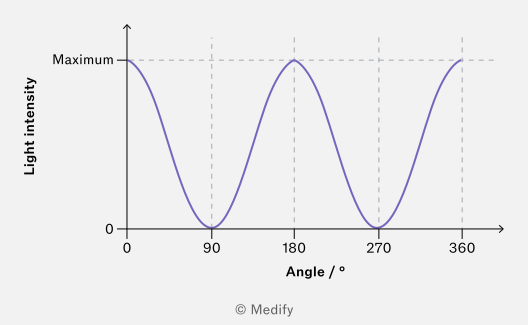
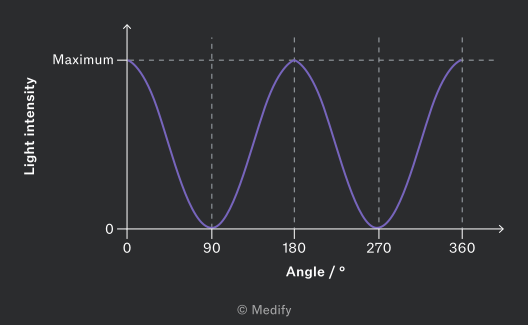
- This changing alignment means the intensity varies periodically based on the rotation angle of B.
The intensity of light shining through two polarisers shows a sinusoidal pattern. The graph below shows the transmitted light intensity as a function of the rotation angle of the second filter, assuming the first filter is held at a fixed angle.
Intensity is maximum when the filters are aligned or and minimum when they are perpendicular or
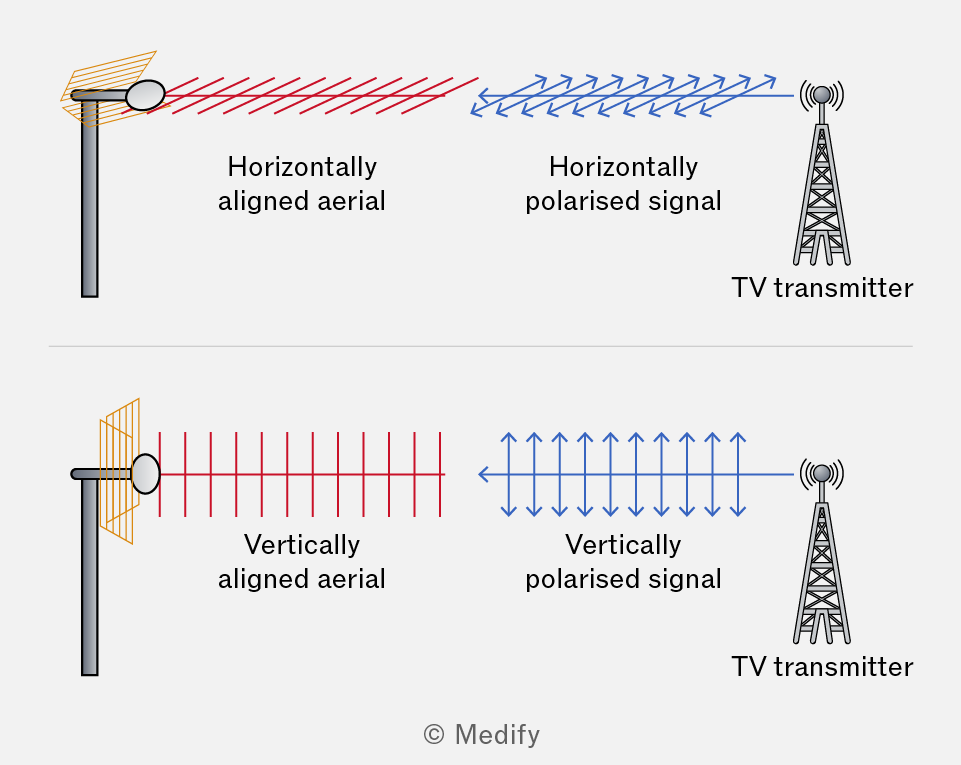
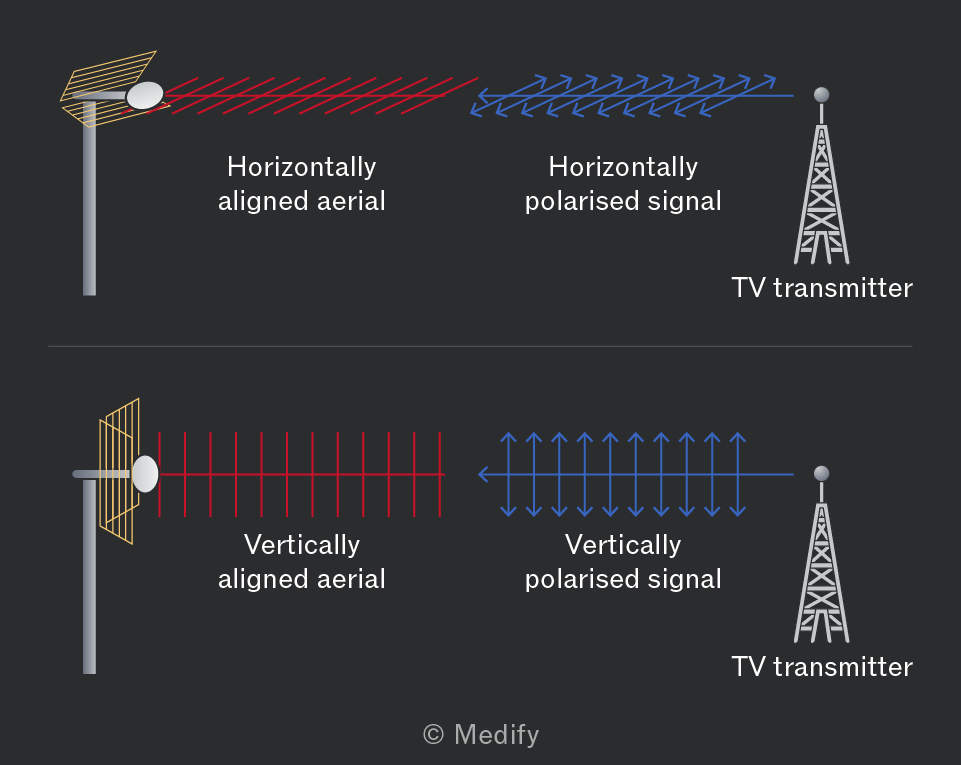
Radio and television services are transmitted using either horizontally polarised or vertically polarised signals.
The orientation of the reception aerial is crucial for optimal signal reception:
- Flat (horizontal) mounting is used for receiving horizontally-polarised signals.
- Vertical mounting is required for vertically-polarised signals.
The correct orientation of the aerial ensures that it is aligned with the plane of polarisation of the incoming waves, allowing for maximum signal strength.
Question walkthrough
Determining Microwave Polarisation Direction
Describe an experimental method using a rotatable metal grille to determine the direction of polarisation of microwaves emitted by a transmitter.
Progressive waves transfer energy without permanently moving the particles in the medium or transferring matter. The intensity of a wave is defined as the amount of energy passing through a unit area perpendicular to the wave’s direction of travel:
Where:
- is wave intensity, measured in
- is the power (energy per unit time), measured in
- is the surface area in .
Amplitude is the maximum displacement from the wave’s equilibrium position. The energy carried by a wave is directly related to its amplitude. Specifically, intensity is proportional to the square of the amplitude:
This means that doubling the amplitude leads to a fourfold increase in intensity.
Therefore, a wave with double the amplitude carries four times the energy per unit area and time.
Frequency is the number of wave cycles that pass a point per second, measured in Hz.
Since a larger number of wave cycles passing a point per second leads to a greater energy transfer, intensity increases with frequency. In fact, intensity is directly proportional to frequency squared:
If the frequency of a wave doubles, its intensity quadruples, meaning the wave is transferring four times as much energy per unit area and time.
Spherical waves are waves originating from a point source that spread equally in all directions, forming spherical wavefronts.
As a spherical wave moves further from the source, it covers a larger area. This area expands according to the surface area of a sphere:
where:
- is the distance from the source in metres.
By substituting this formula for area into the equation for intensity, we can see that intensity is inversely proportional to the distance from the spherical wave source:
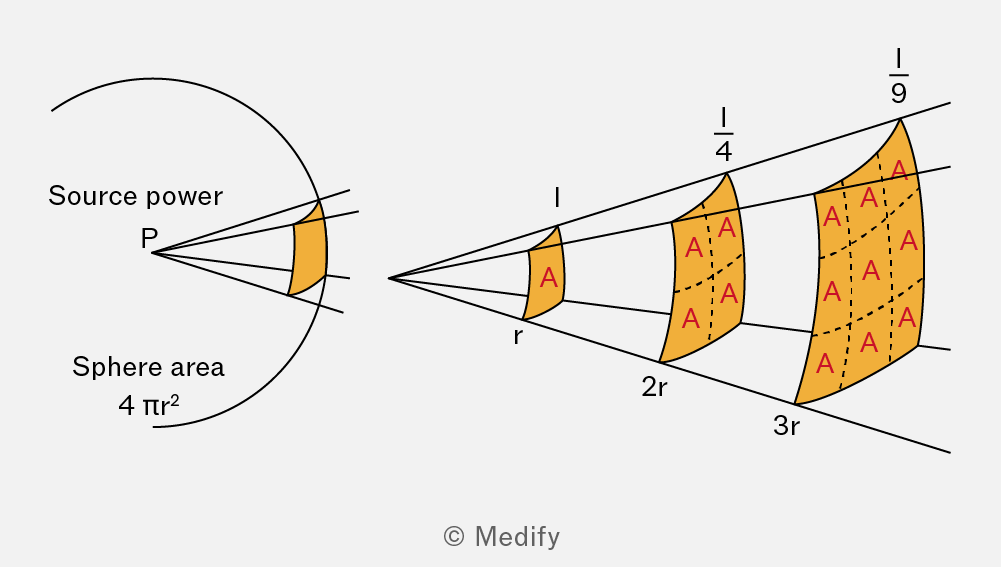
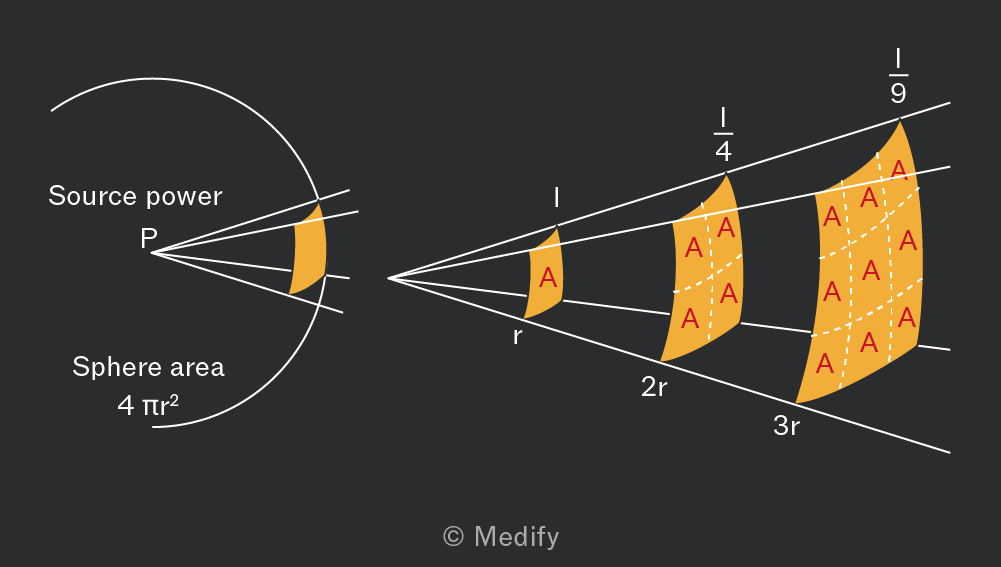
When the distance from a point source doubles, the intensity reduces to a quarter of its original value.
Question walkthrough
Star Intensity After Wavelength Shift
Combine the inverse square law with a given proportionality between intensity and frequency to find the intensity of light reaching Earth from a star whose peak emission wavelength has changed.