Topic 2: Genes and health›Enzymes (2.10)

Enzymes (2.10)

An overview of enzymes (2.10) from Edexcel A level Biology A including: the mechanism of enzyme action, measuring the rate of reaction and factors affecting enzyme activity
7 min

Enzymes are a type of globular protein. They have a specific 3-dimensional shape as a result of their primary structure (sequence of amino acids).

Add to favourites

Activation energy is the energy needed to start a reaction.

Add to favourites

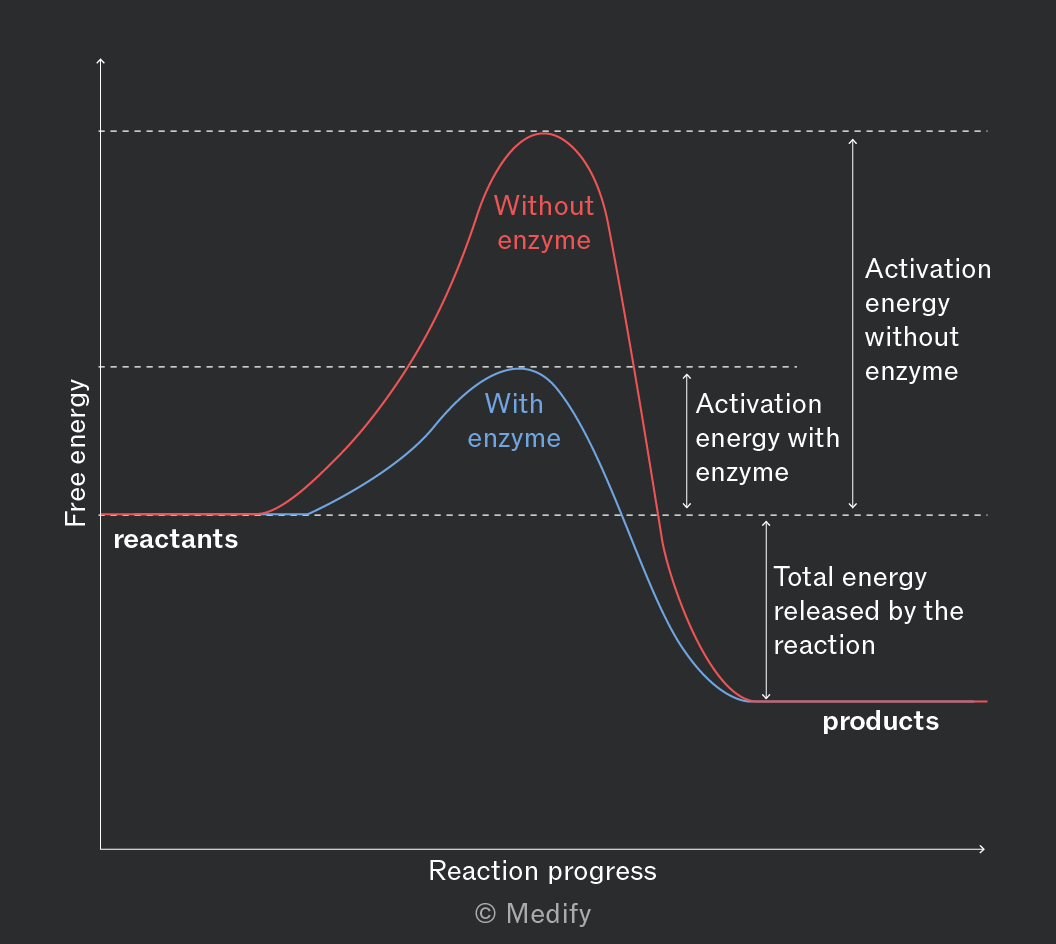
Enzymes act as biological catalysts, lowering the activation energy required for a reaction to occur by forming weak interactions with the substrate. These interactions can strain the bonds in the substrate, making them more likely to break or form.

Enzymes are not altered or used up during a reaction; they can be reused.
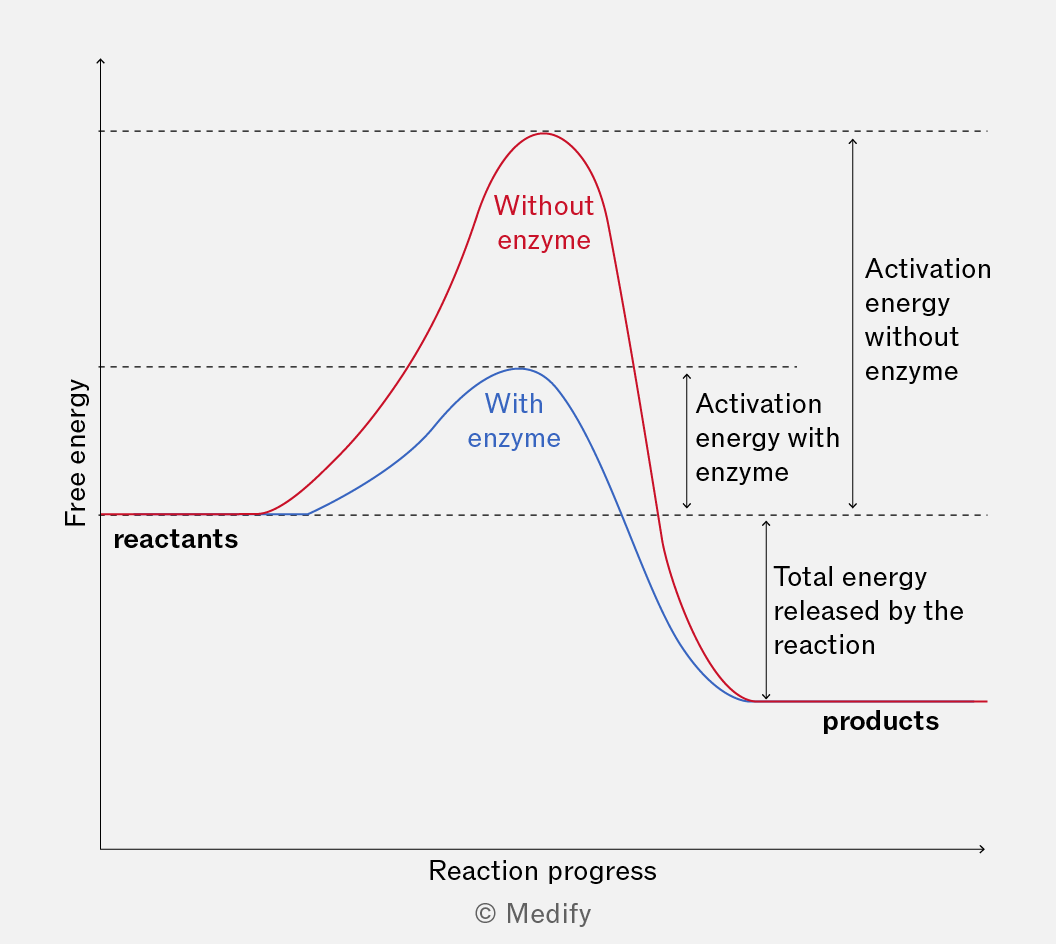
The graph shows free energy on the y-axis and reaction progress on the x-axis. Two curves are depicted: a red curve labeled 'Without enzyme' and a blue curve labeled 'With enzyme'. Both curves start from a similar energy level labeled 'reactants'. The red curve reaches a higher peak compared to the blue curve, indicating higher activation energy. Annotations indicate 'Activation energy without enzyme' for the red curve and 'Activation energy with enzyme' for the blue curve. Both curves decline to a lower energy level labeled 'products', with an annotation 'Total energy released by the reaction'.
Add to favourites

In cells, many metabolic reactions have high activation energies and would occur too slowly at normal biological temperatures. Enzymes lower the activation energy, allowing reactions to proceed quickly and efficiently, supporting life without raising the cell’s temperature.

Enzymes play a crucial role in regulating metabolism, determining structures and functions from the cellular to the whole organism level.

Add to favourites

Enzymes catalyse anabolic reactions where large molecules are synthesised from their component parts.

For example, fatty acids are synthesised in cells by the fatty acid synthetase enzyme complex.

Add to favourites

Enzymes catalyse catabolic reactions where large molecules are broken down into smaller molecules. These reactions usually release energy (and the end-products can be used in respiration to produce ATP).

For example, the enzyme amylase catalyses the hydrolysis (breakdown) of starch into maltose.
Without enzymes catalysing catabolic reactions, large molecules in our food would not be broken down or energy released at a rate fast enough to support life.
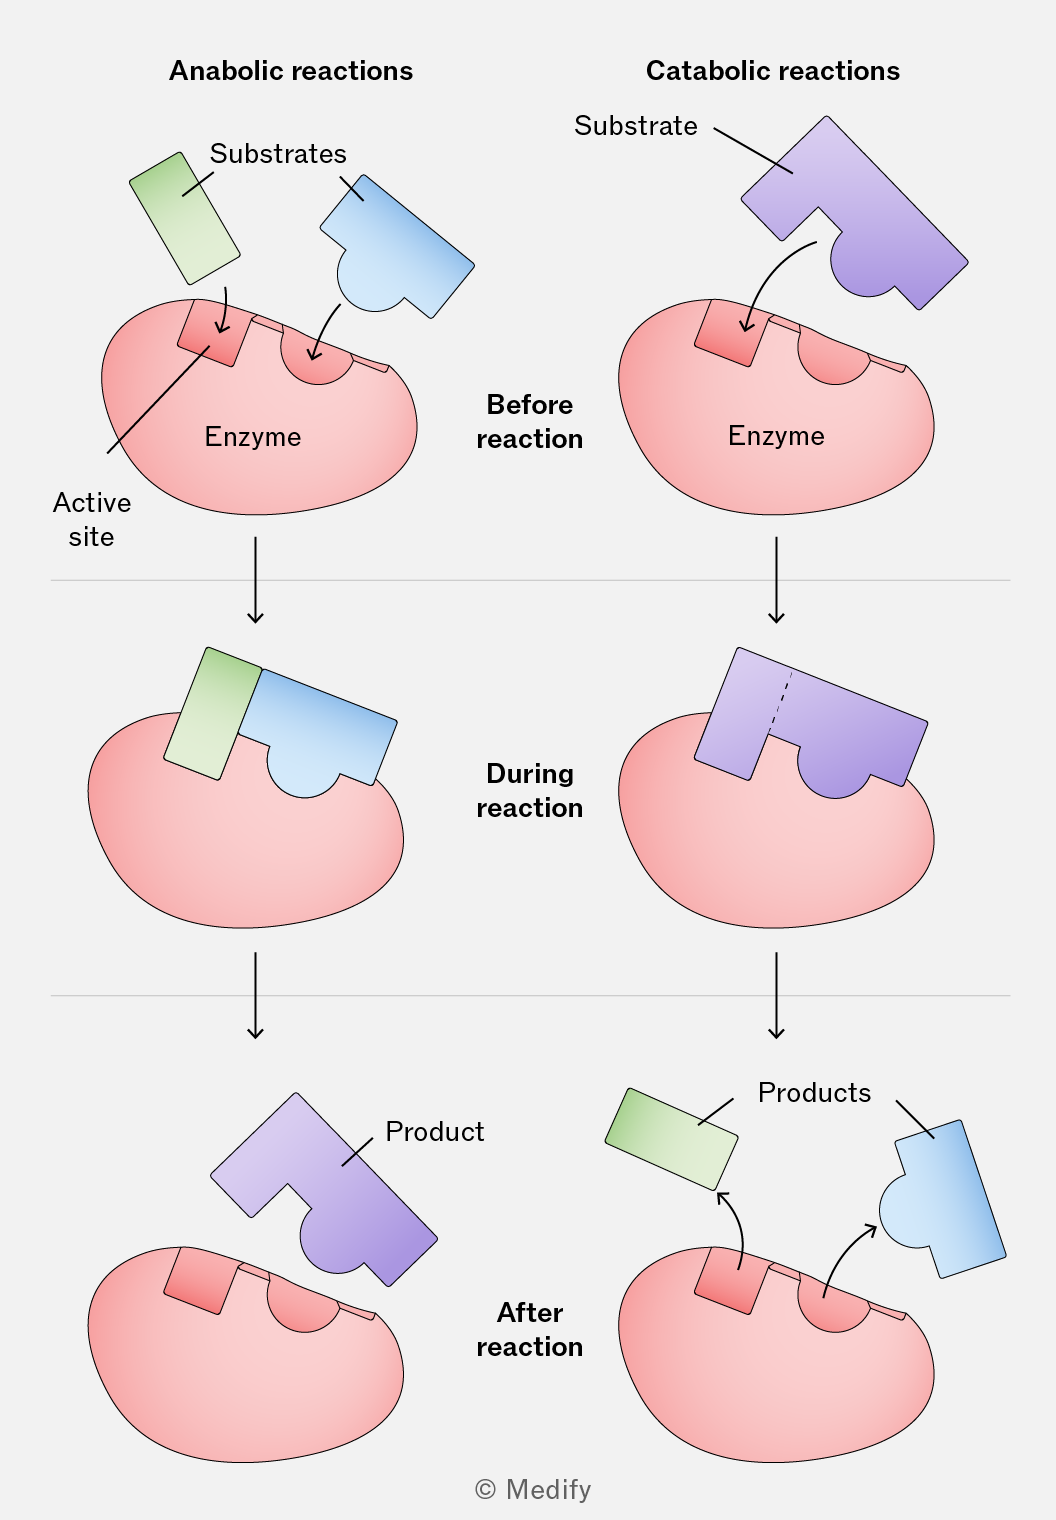
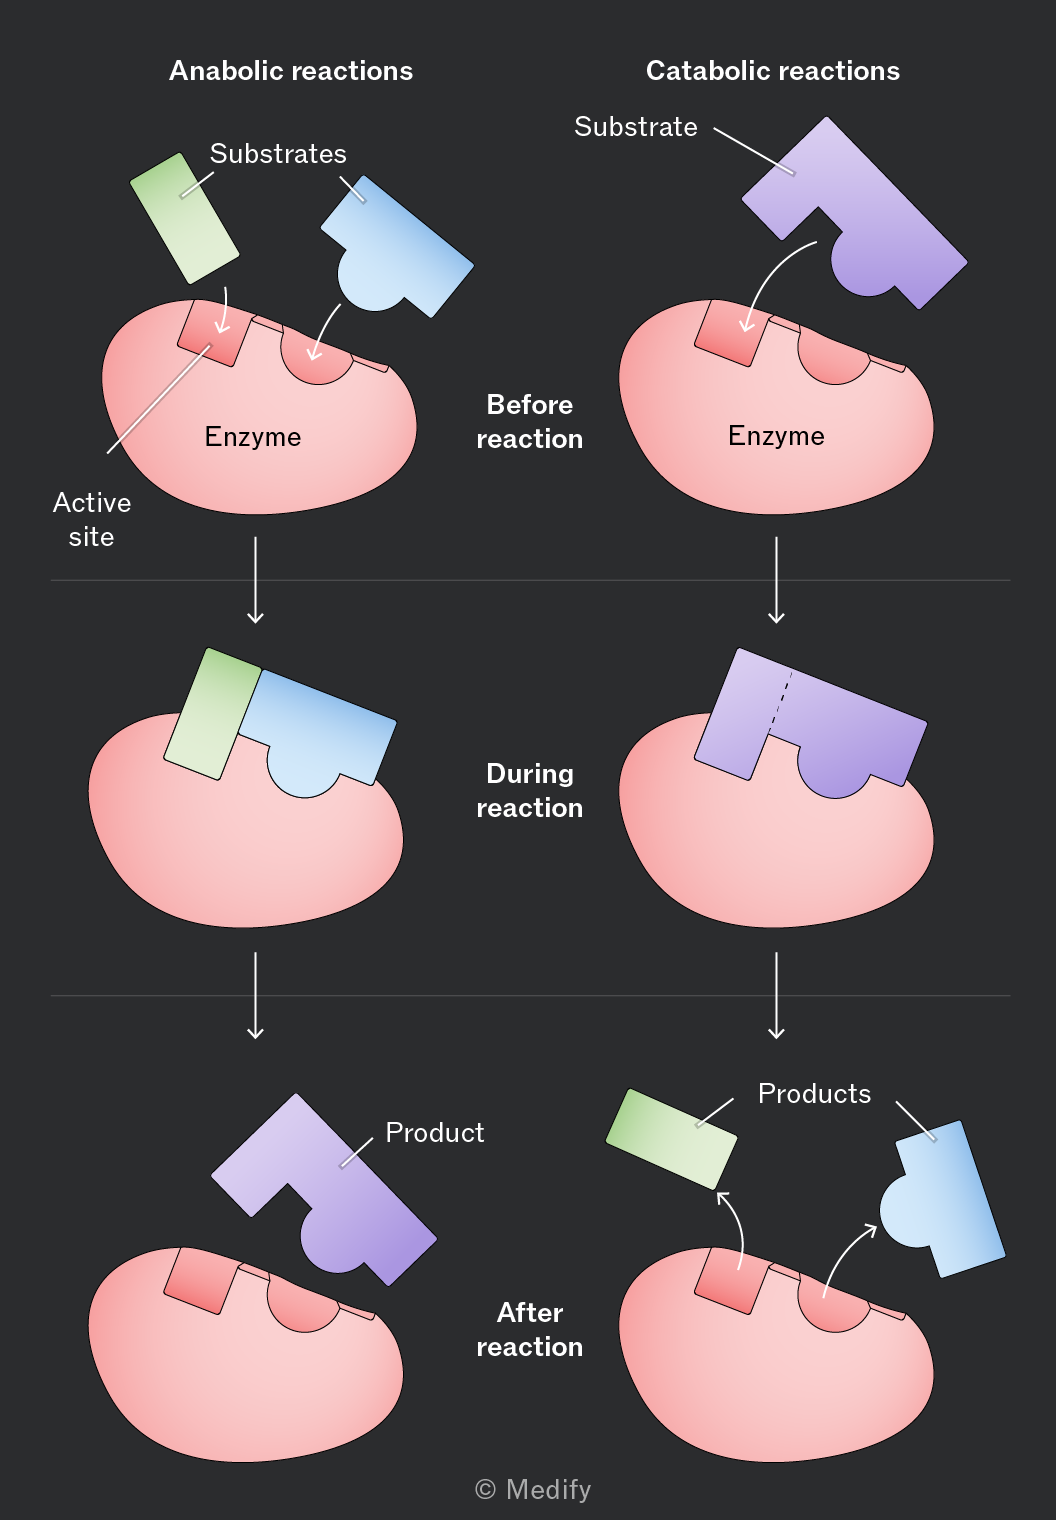
The image is a diagram showing the process of anabolic and catabolic reactions involving enzymes. It is divided into two columns. The left column depicts anabolic reactions, and the right column depicts catabolic reactions. Each column is divided into three stages: Before reaction, During reaction, and After reaction. In the anabolic reactions column, 'Before reaction' shows a green and blue substrate approaching an enzyme with an active site labeled. 'During reaction' shows the substrates bound to the enzyme. 'After reaction' shows a single product released from the enzyme. In the catabolic reactions column, 'Before reaction' shows a purple substrate approaching an enzyme. 'During reaction' shows the substrate bound to the enzyme. 'After reaction' shows the substrate split into two products, one green and one blue, released from the enzyme. Both enzymes are illustrated in pink, and the substrates and products are in green, blue, and purple. Each stage is connected by downward arrows indicating progression.
Add to favourites

Enzymes are essential for various biochemical processes and can function both inside cells (intracellular) and outside cells (extracellular).

Intracellular enzymes function within cells, catalysing numerous metabolic processes essential for cell survival and function.

Catalase is an example of an intracellular enzyme and is found in nearly all living organisms that respire aerobically. It decomposes hydrogen peroxide, a harmful byproduct of aerobic metabolism, into water and oxygen:

Add to favourites

Extracellular enzymes are secreted by cells to function outside of the cell. They play crucial roles in digestion, where large nutrient molecules need to be broken down or modified outside the cell.

For example, amylase is an enzyme produced by cells in the salivary glands and pancreas. When released into saliva, it catalyses the hydrolysis of starch (a polysaccharide) into maltose (a disaccharide).
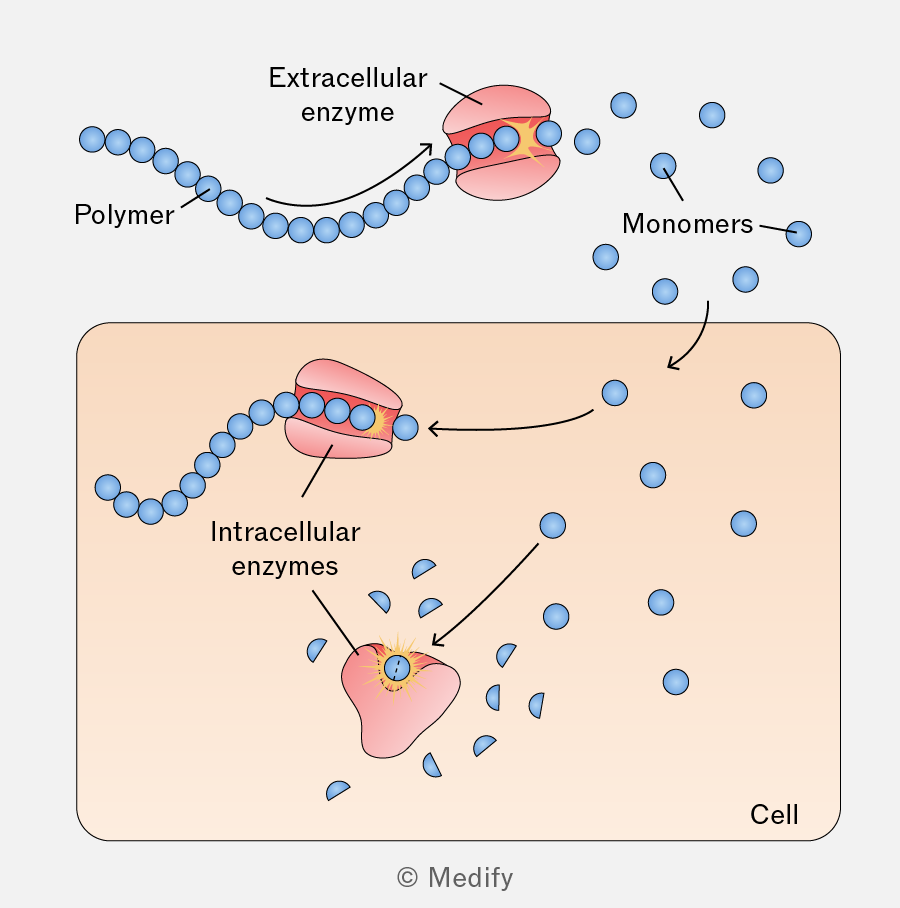
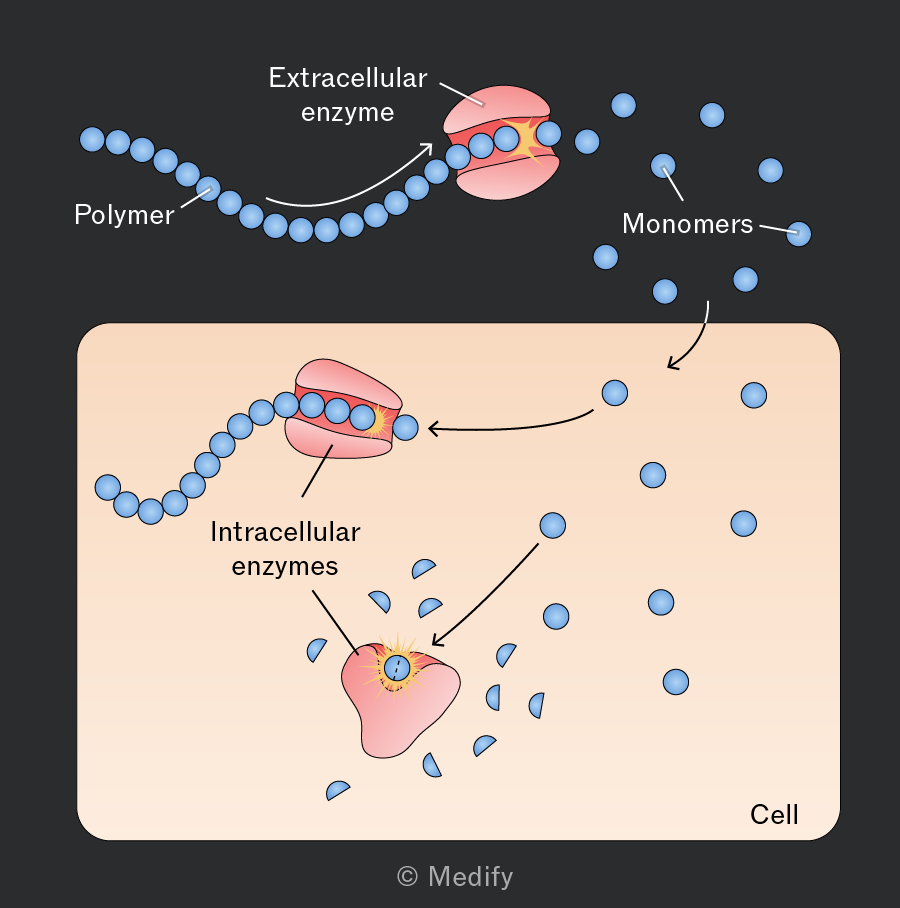
Diagram illustrating the breakdown of polymers by enzymes. At the top, a polymer, depicted as a chain of blue spheres, is being broken down by an extracellular enzyme, shown as a pink oval surrounding part of the polymer chain. Arrows indicate the direction of the breakdown, resulting in separate blue spheres labeled 'Monomers.' Below, inside a shaded rectangular area labeled 'Cell,' intracellular enzymes, represented as a pink shape, continue to break down the polymer into smaller pieces. Arrows point to a separate enzyme depicted as a pink shape with a glowing center, further processing these pieces. The diagram is labeled with 'Polymer,' 'Extracellular enzyme,' 'Monomers,' 'Intracellular enzymes,' and 'Cell.'
Add to favourites

Enzymes are globular proteins with a specific tertiary (3-dimensional) structure. An area within this structure, called the enzyme’s active site, is where substrates bind, forming an enzyme–substrate complex.

The shape of an enzyme’s active site is complementary to the substrate(s) involved in the specific reaction it catalyses.
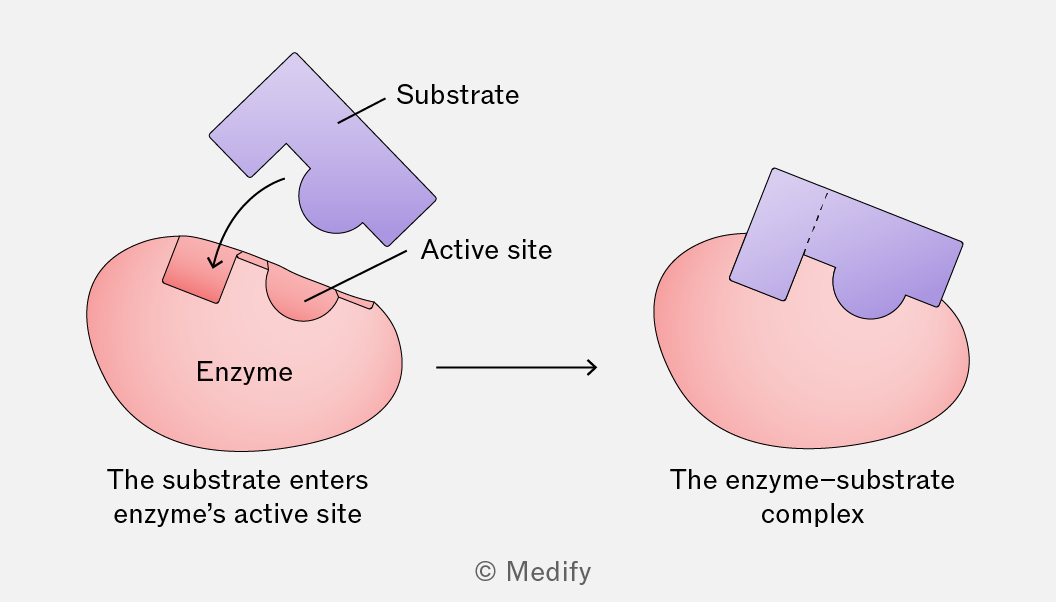
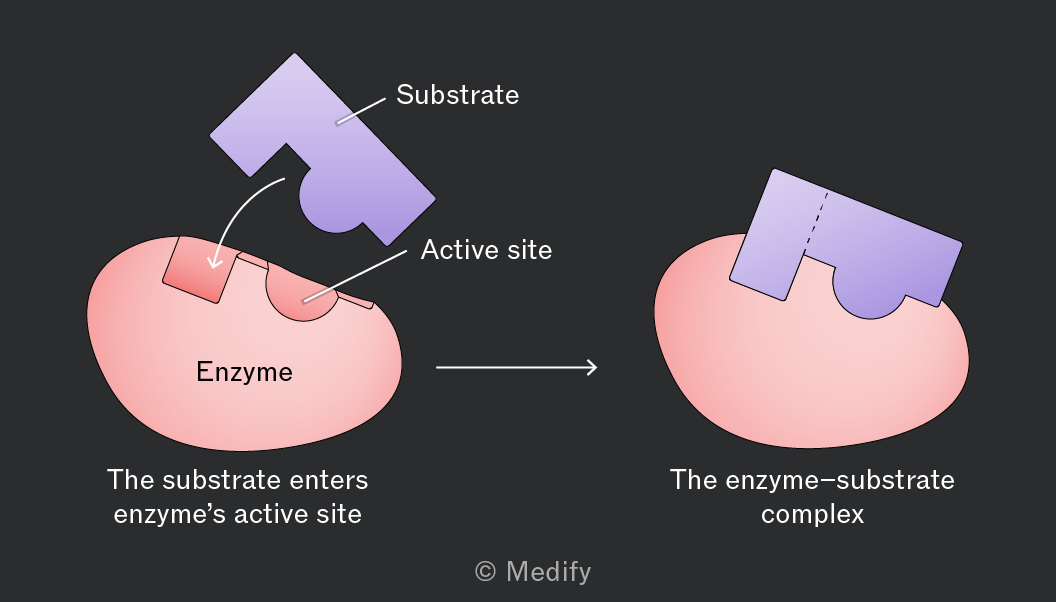
Diagram showing an enzyme-substrate interaction process. On the left, a pink shape labeled 'Enzyme' with a groove labeled 'Active site' is shown. A purple puzzle-piece-like shape labeled 'Substrate' is positioned above the active site with an arrow pointing towards it, indicating that the substrate enters the enzyme's active site. Below this, the text reads 'The substrate enters enzyme’s active site'. On the right, the substrate is shown fitting into the enzyme, forming what is labeled as 'The enzyme-substrate complex'. An arrow points from the left diagram to the right, indicating the progression of the interaction.
Add to favourites

The lock-and-key hypothesis of enzyme action suggests that a substrate fits into the rigid structure of an enzyme’s active site precisely, in the same way a specific key fits into its corresponding lock.

When an enzyme and its substrate collide, the side chains of amino acids (R groups) within the enzyme’s active site form temporary bonds with the substrate. This results in the formation of an enzyme–substrate complex.

The enzyme catalyses the reaction, and the products are formed in an enzyme–product complex. The enzyme then releases the products and is left unchanged, ready to be reused.
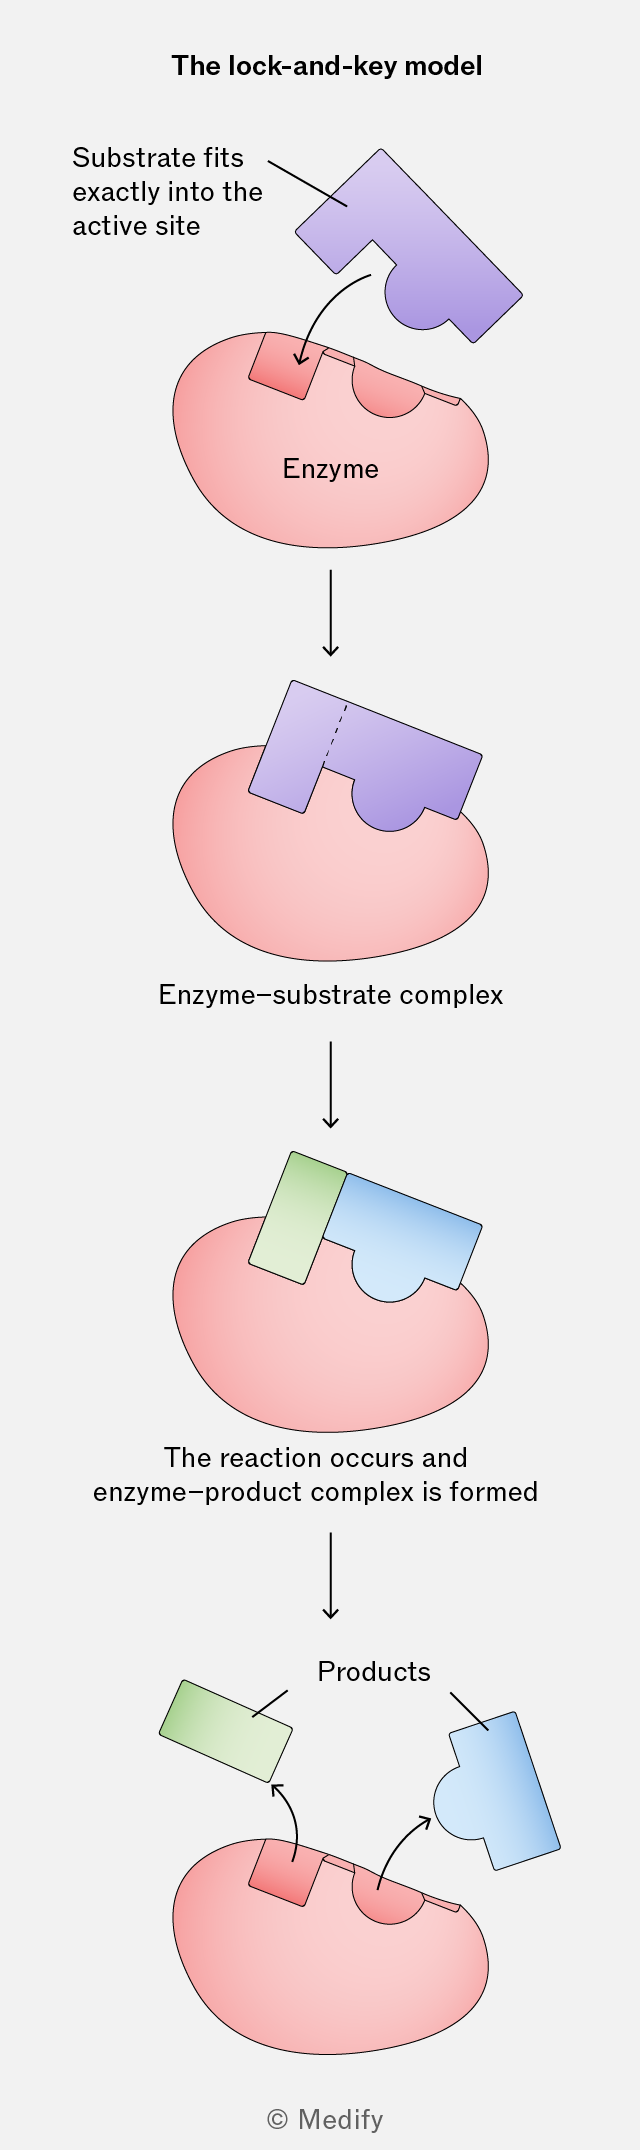
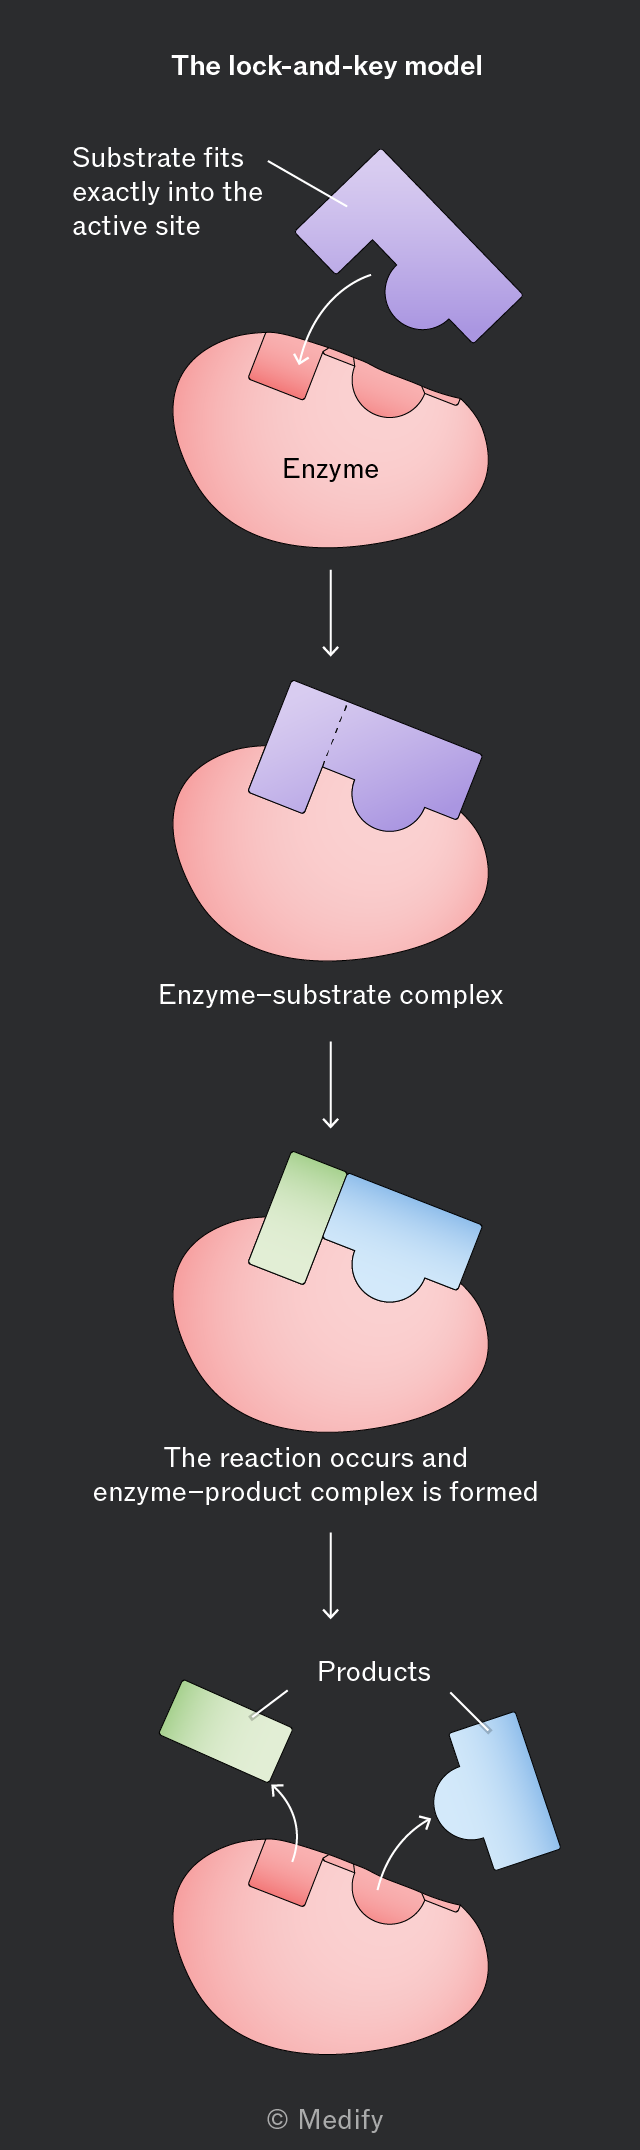
The image illustrates the lock-and-key model of enzyme activity. At the top, the title 'The lock-and-key model' is shown. Below this, a purple substrate shape is labeled 'Substrate fits exactly into the active site' and is pointing to a pink shape labeled 'Enzyme'. The substrate fits into an indented area on the enzyme. An arrow points down to the next stage labeled 'Enzyme-substrate complex', where the substrate is shown fitting perfectly into the enzyme. Another arrow points down to the next stage labeled 'The reaction occurs and enzyme-product complex is formed', where the substrate has changed colors, with a new green section. Finally, an arrow points down to the last stage where the enzyme is unchanged, but the substrate has split into two products: a green rectangle and a blue shape, labeled 'Products'. The enzyme retains its original shape. © Medify is noted at the bottom.
Add to favourites

The induced fit model of enzyme action suggests that enzymes are flexible and can change shape in the presence of a substrate. These changes in shape are known as conformational changes.

As an enzyme and substrate collide, the side chains of amino acids (R groups) within the enzyme’s active site form temporary bonds with the substrate. These weak interactions induce a change in the enzyme’s tertiary structure, strengthening the binding in the enzyme–substrate complex. This strains the bonds in the substrate making them easier to break (lowering the activation energy required for the reaction).

The products are formed within an enzyme–product complex and are then released. The enzyme returns to its original shape, ready to be reused.
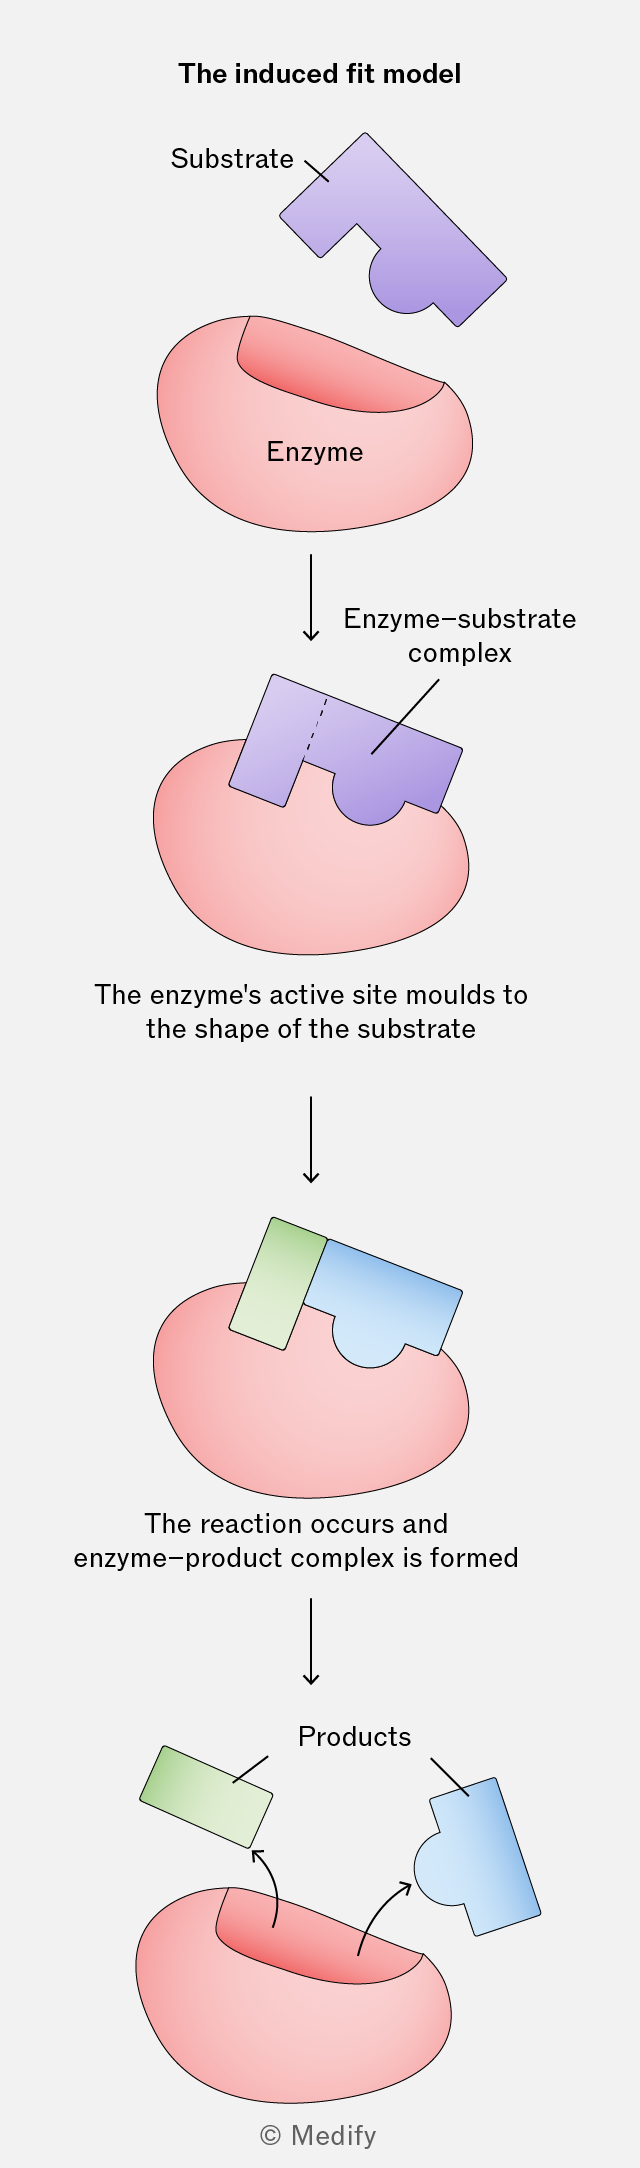
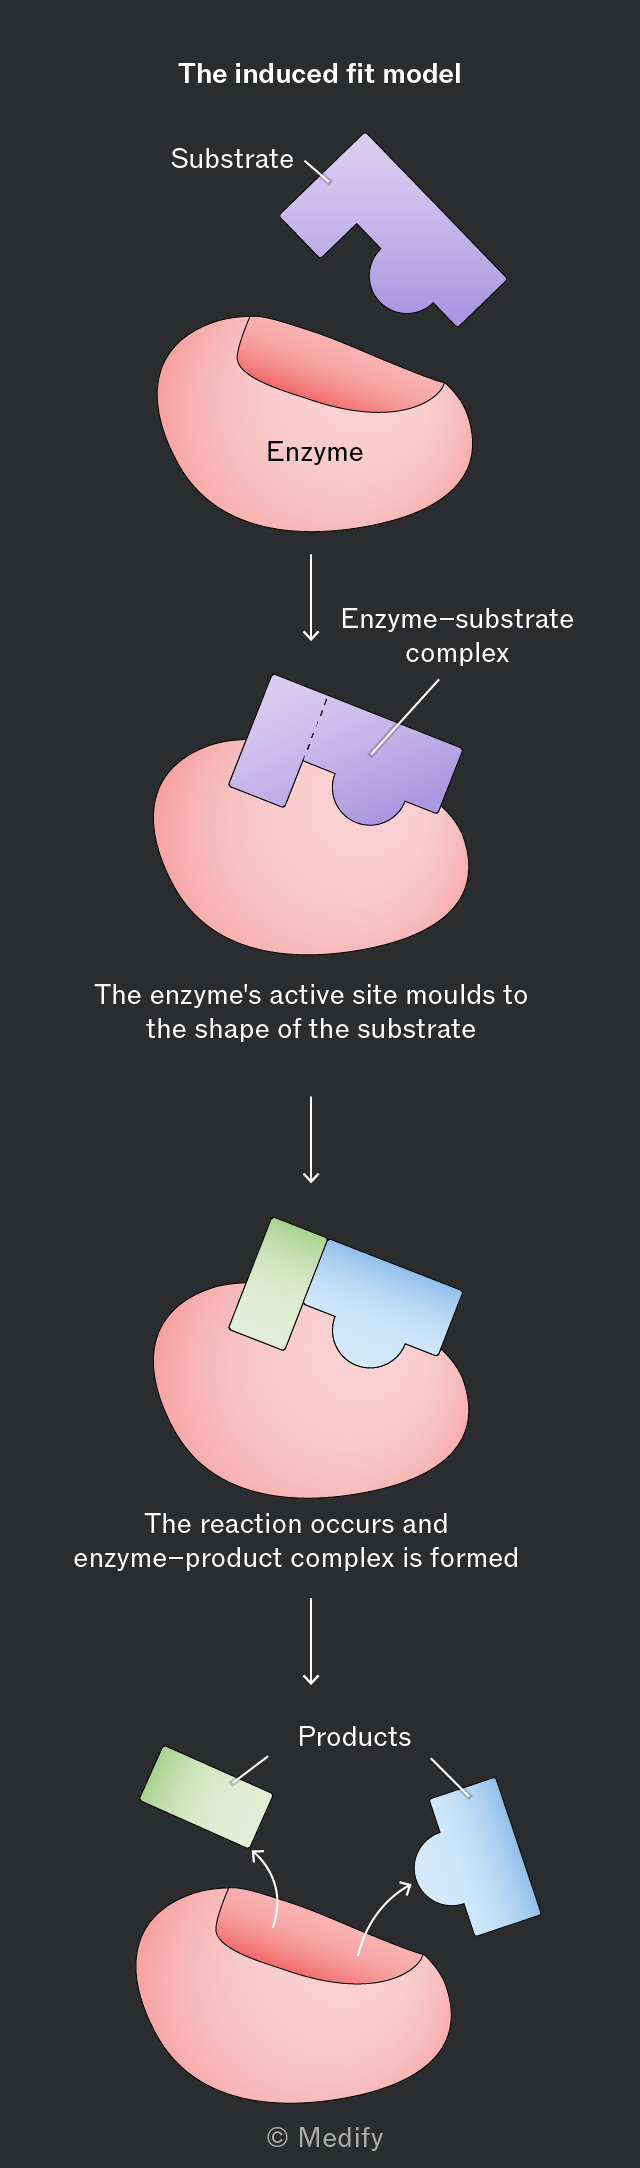
The image illustrates the induced fit model of enzyme action in four stages. At the top, the label reads 'The induced fit model'. The first stage shows a pink, irregularly shaped enzyme with a concave opening, and a purple substrate with a complementary shape labeled 'Substrate'. An arrow points to the second stage, where the substrate fits into the enzyme, forming the 'Enzyme-substrate complex'. The third stage shows the enzyme changing shape to fit the substrate, labeled 'The enzyme's active site moulds to the shape of the substrate'. The final stage shows the enzyme-product complex, with the enzyme returning to its original shape as the products, a green and a blue section, are released. This stage is labeled 'The reaction occurs and enzyme-product complex is formed'. Arrows indicate the release of 'Products'. At the bottom, the copyright note © Medify is visible.
Add to favourites

The progress of enzyme-catalysed reactions can be investigated by:

  • Measuring the rate of product formation
  • Measuring the rate of substrate disappearance.
Add to favourites

The rate of an enzyme-catalysed reaction can be measured from a graph of the amount of product formed or substrate used through time.

The gradient of the curve at any given point is equal to the rate of the reaction (units are always ‘per unit time’). This changes over time if the relationship is curved.
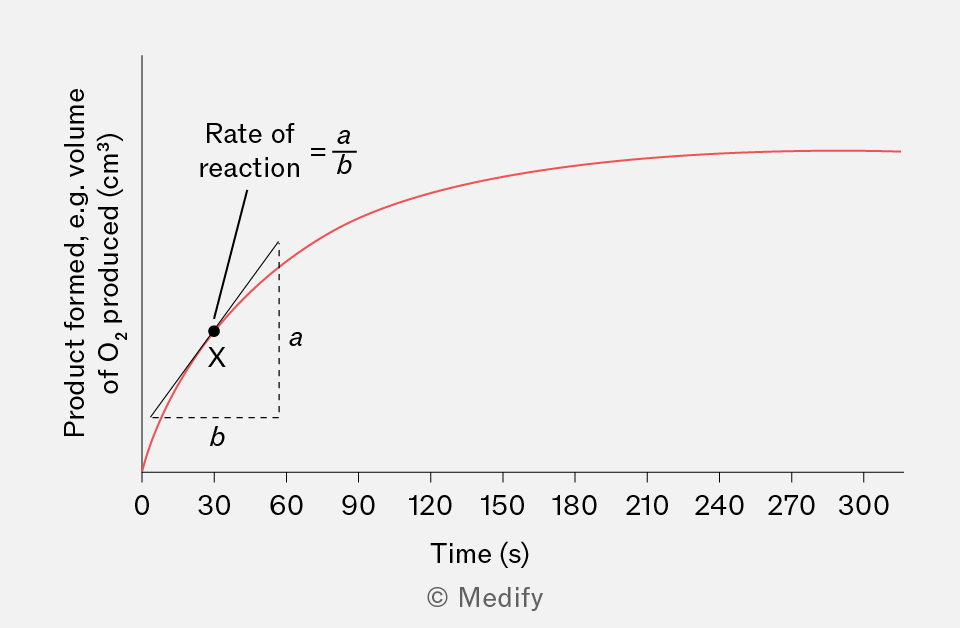
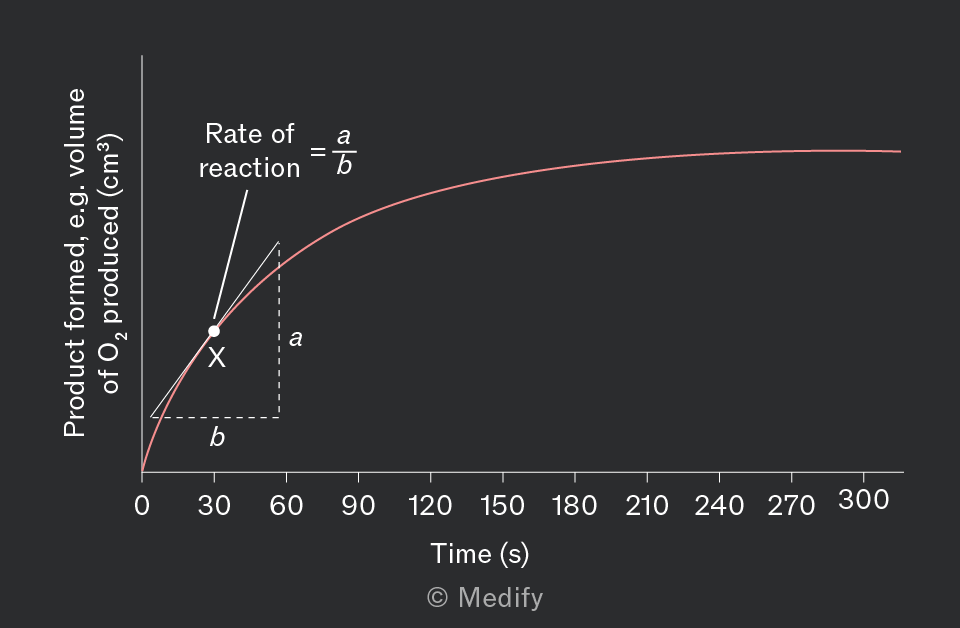
A graph displaying 'Product formed, e.g. volume of O2 produced (cm³)' on the vertical axis and 'Time (s)' on the horizontal axis, with time values ranging from 0 to 300 seconds at intervals of 30. A red curve is plotted, starting at the origin and leveling off as time increases. A black dot labeled 'X' is on the curve. An annotation shows 'Rate of reaction = a/b' with dashed lines indicating 'a' vertically and 'b' horizontally from point 'X'.
Add to favourites

Initially, increasing substrate concentration increases the rate of reaction. With more substrate molecules present, the chance of forming enzyme–substrate complexes increases.

The rate of reaction subsequently plateaus as all active sites become saturated. The rate of reaction reaches its maximum . Beyond this point, further increase in substrate concentration will not increase the reaction rate, as there are no free active sites for additional substrate molecules to bind to. The enzyme concentration becomes the limiting factor in the reaction.
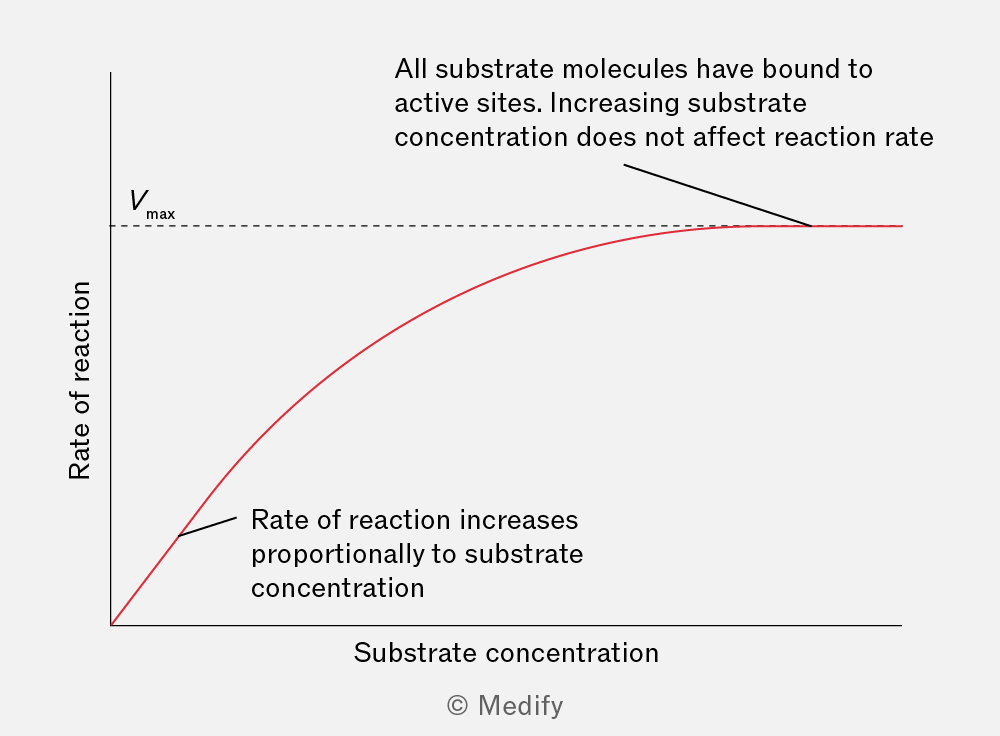
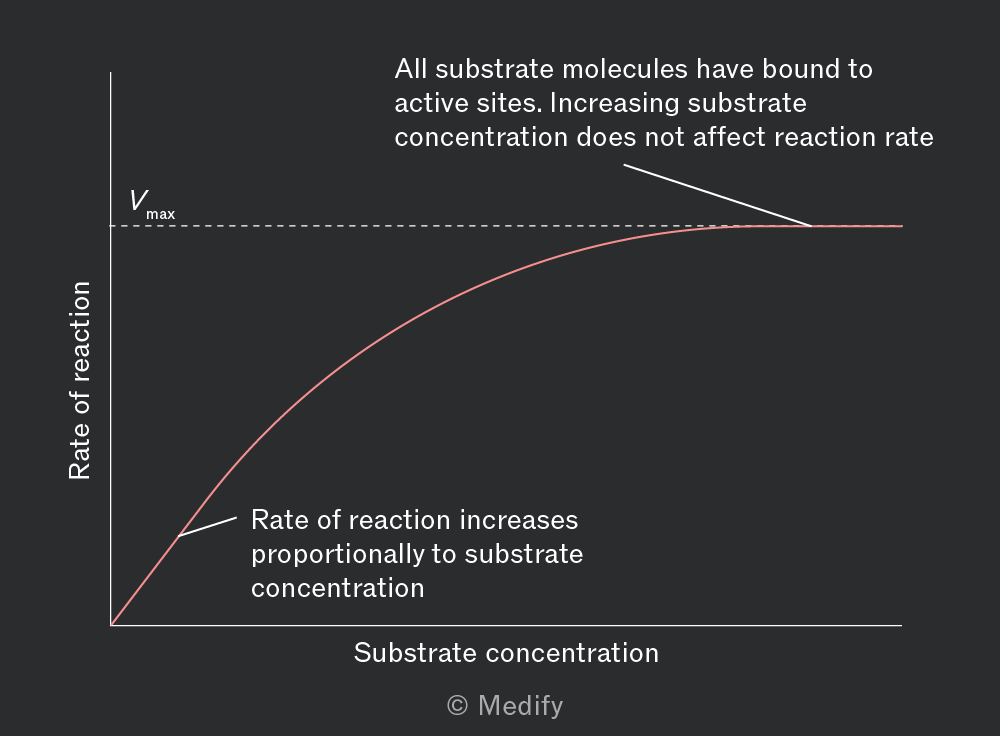
A graph with the x-axis labeled 'Substrate concentration' and the y-axis labeled 'Rate of reaction'. A red curve is shown starting at the origin, increasing steeply, then leveling off as it approaches a horizontal dotted line labeled 'Vmax'. An annotation near the curve's initial rise states, 'Rate of reaction increases proportionally to substrate concentration'. Another annotation near the flat part of the curve states, 'All substrate molecules have bound to active sites. Increasing substrate concentration does not affect reaction rate'.
Add to favourites

Initially, increasing enzyme concentration increases the rate of reaction because there are more active sites available to form enzyme–substrate complexes. With ample substrate available, the initial reaction rate increases linearly with enzyme concentration.

If the substrate is limited, increasing the enzyme concentration further will not increase the reaction rate, because substrate availability becomes the limiting factor. The reaction rate will have reached
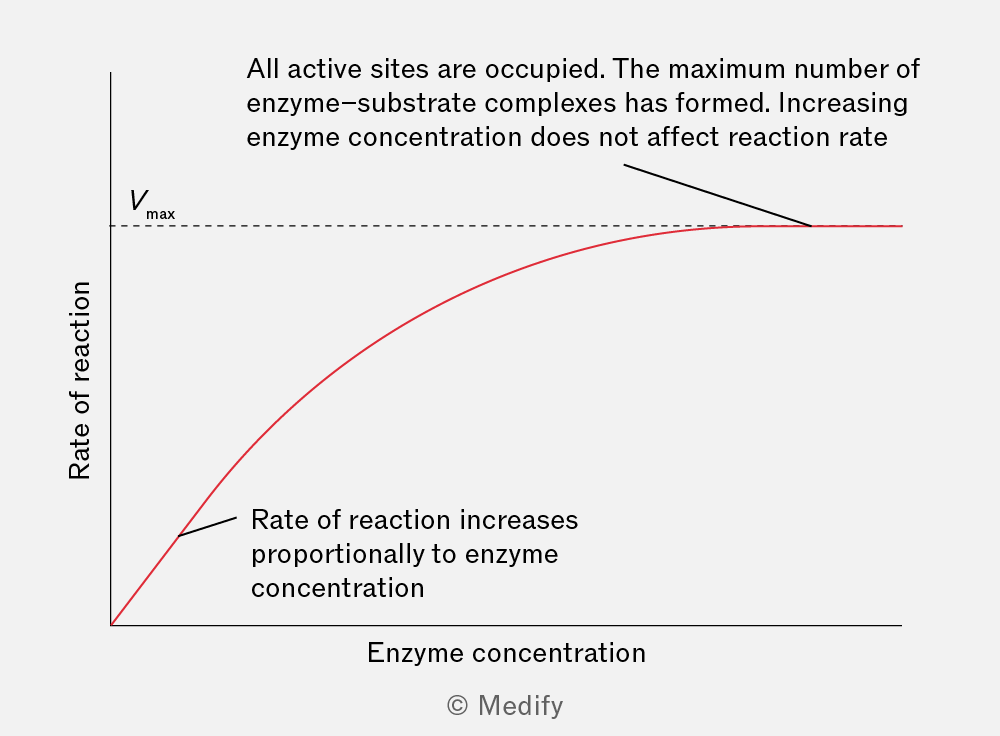
A graph depicting the relationship between enzyme concentration and rate of reaction. The x-axis is labeled 'Enzyme concentration' and the y-axis is labeled 'Rate of reaction'. A red curve starts at the origin, increases steeply, and then levels off, approaching a horizontal asymptote labeled 'Vmax'. Annotations include: 'Rate of reaction increases proportionally to enzyme concentration' near the rising portion of the curve, and 'All active sites are occupied. The maximum number of enzyme-substrate complexes has formed. Increasing enzyme concentration does not affect reaction rate' near the plateau. The curve flattens as it reaches Vmax.
Add to favourites