
Biological membranes (2.1.5)
On this page
Membranes are partially permeable barriers with the same basic structure, regardless of their location.
At the cell surface, the cell surface membrane separates the cell and its environment and regulates the exchange of ions, nutrients, and waste, maintaining homeostasis.
Between membrane–bound organelles and cytoplasm, the membrane separates organelle contents from the cytoplasm, ensuring compartmentalisation and facilitating specialised functions.
Within organelles, the membrane creates distinct compartments, such as the inner mitochondrial membrane, which is essential for processes such as cellular respiration.
Membranes can function as sites of chemical reactions.
Membranes provide a surface for enzymes to bind to and interact with substrates. Membrane organisation supports efficient, sequential enzyme activity in metabolic processes.
Examples:
Respiration: ATP-producing enzymes are embedded in the inner mitochondrial membrane.
Photosynthesis: In chloroplasts, thylakoid membranes house enzymes for light-dependent reactions.
Membranes can function as sites of cell communication and cell recognition.
Receptor proteins bind to signalling molecules such as hormones (e.g. insulin) and neurotransmitters to trigger intracellular responses via signal transduction pathways.
The carbohydrate chains attached to glycoproteins and glycolipids facilitate cell recognition and aid in immune responses and tissue formation.
In 1935, Davson and Danielli, developed the Davson–Danielli model to describe the cell membrane as a phospholipid bilayer sandwiched between two continuous protein layers (giving a ‘protein–lipid–protein’ structure).
The protein layers in the model coated both membrane surfaces, providing stability and resulting in partial permeability by acting as barriers or channels for molecule movement.
Cell membranes consists of 4 main components:
- A phospholipid bilayer, with hydrophilic phosphate heads facing outward and hydrophobic fatty acid tails inward, creating a partially permeable barrier
- Embedded intrinsic (channel and transport) proteins spanning both layers of the membrane and extrinsic proteins in one side of the membrane, facilitating transport, cell signalling, and structural support
- Glycoproteins and glycolipids on the extracellular surface, involved in cell recognition and communication
- Cholesterol interspersed within the bilayer, regulating membrane fluidity and stability, particularly in response to temperature fluctuations.
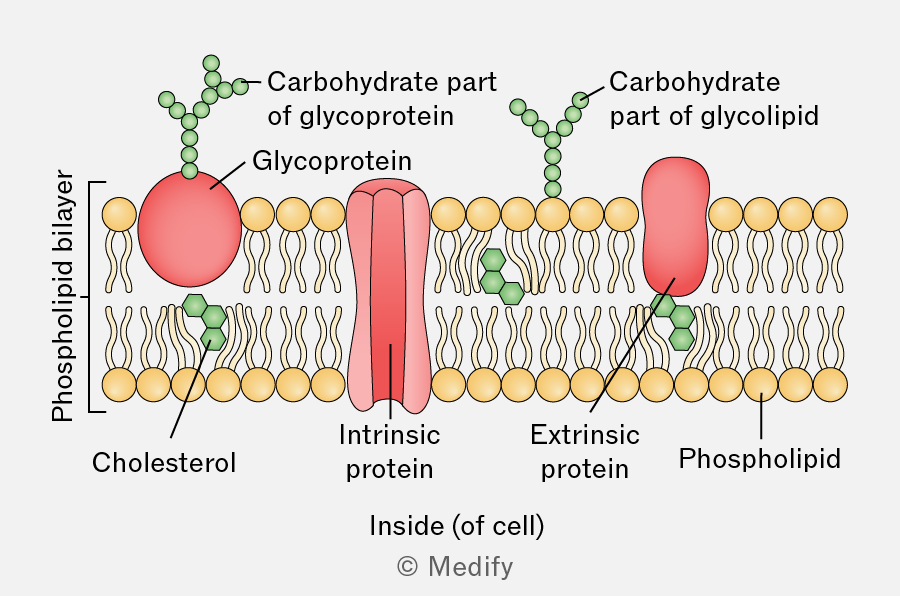
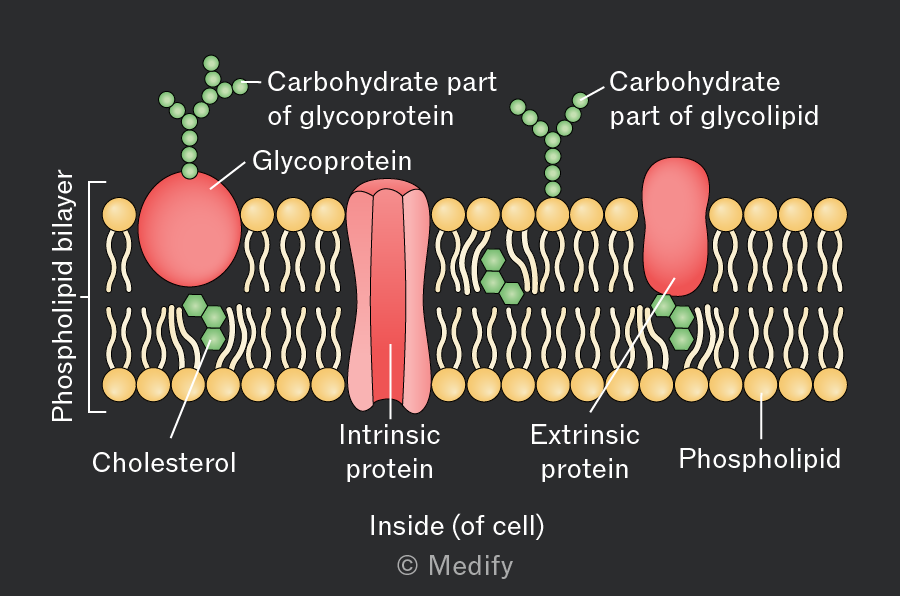
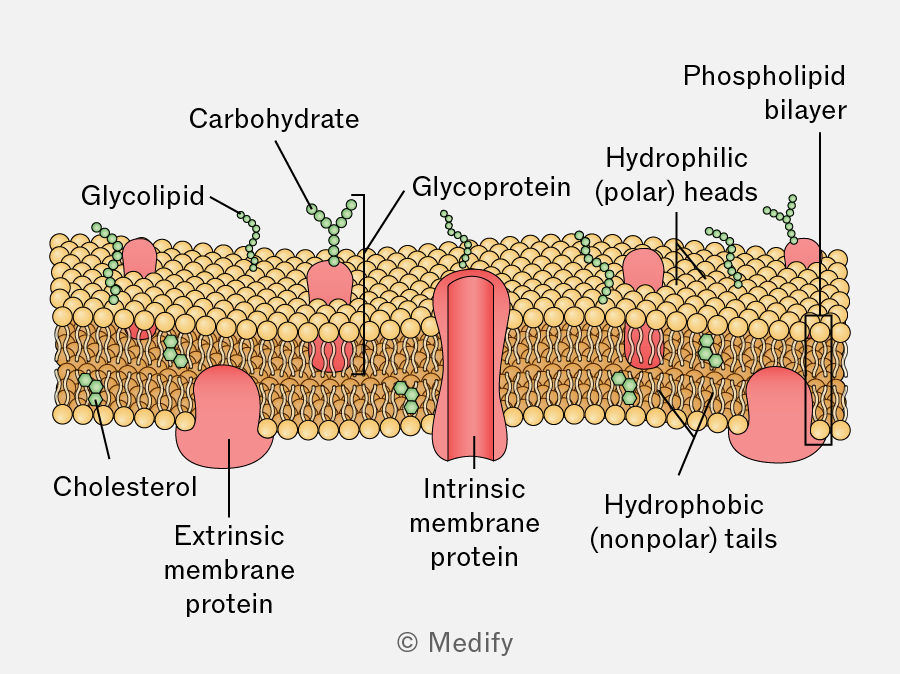
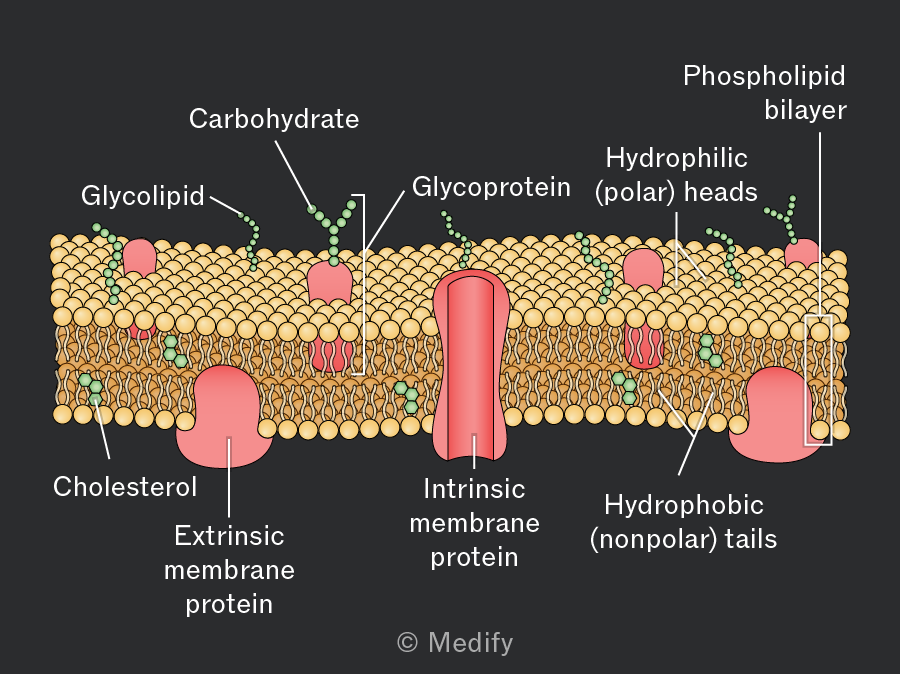
Following advancements in electron microscopy and membrane studies, Singer and Nicolson proposed the fluid mosaic model of cell membrane structure in 1972. This model replaced the Davson–Danielli model.
The model describes the cell membrane as having a dynamic structure formed from a mosaic of proteins, lipids, and carbohydrates.
This structure allows fluid movement of molecules, such as phospholipids and proteins, within the lipid bilayer, and also enables self-repair.
In the fluid mosaic model, cell membranes are made up of multiple components, each with specific functions.
Phospholipids are the main component of membranes. They are amphipathic, consisting of a hydrophilic head and two hydrophobic tails.
In an aqueous environment, phospholipids arrange themselves into a bilayer with heads facing the extracellular and intracellular fluids and tails facing inwards, away from water.
The phospholipid bilayer acts as a partially permeable barrier, allowing only certain small and non-polar molecules to pass through freely, while larger and polar molecules require assistance from membrane proteins.
In the fluid mosaic model, cell membranes are made up of multiple components, each with specific functions.
Intrinsic membrane proteins (transmembrane proteins) span both layers of the phospholipid bilayer.
These proteins can be receptors (e.g., for hormones or neurotransmitters), enzymes (to catalyse reactions at the membrane surface), structural (e.g., involved in cell adhesion), electron carriers (e.g., in mitochondrial or thylakoid membranes), or involved in transport across membranes.
Intrinsic proteins involved in transport:
- Carrier proteins bind specific molecules and change shape to move them across a membrane.
- Channel proteins form pores that allow ions or water-soluble molecules to cross a membrane.
In the fluid mosaic model, cell membranes are made up of multiple components, each with specific functions.
Extrinsic membrane proteins are attached to one side of a membrane but can sometimes move between layers.
They are involved in signalling and maintaining cell shape and structure (e.g., connecting the membrane to the cytoskeleton).
In the fluid mosaic model, cell membranes are made up of multiple components, each with specific functions.
Cholesterol molecules are interspersed within the phospholipid bilayer and stabilise membrane fluidity and rigidity by:
- Making the membrane less permeable to small, water-soluble molecules that could otherwise pass through freely, thus preventing leakage from the cell
- Preventing the membrane from becoming too rigid at cold temperatures and too fluid at high temperatures
- Restricting the movement of other cell membrane components.
In the fluid mosaic model, cell membranes are made up of multiple components, each with specific functions.
Glycolipids are lipids (embedded in the membrane) with a carbohydrate chain attached (extending outwards into the extracellular space).
These molecules are involved in cell recognition (e.g., antigens), signalling, maintaining membrane stability, cell attachment, and the formation of tissues.
In the fluid mosaic model, cell membranes are made up of multiple components, each with specific functions.
Glycoproteins are intrinsic proteins with carbohydrate chains attached. They are crucial for cell adhesion, recognition, and immune responses.
Glycoproteins on the cell surface are involved in cell signalling as receptors for molecules, such as hormones, neurotransmitters, and drugs, which bind to trigger intracellular events (e.g., receptor for acetylcholine at nerve cell synapses).
Membrane-bound receptors are specialised intrinsic membrane proteins that bind to specific signalling molecules (ligands), such as hormones or drugs. Some of these receptors are glycoproteins.
Upon binding, these receptors undergo a conformational change, triggering a cascade of intracellular events.
- Hormones, such as insulin, bind to their respective receptors, initiating signalling pathways that regulate processes, such as glucose uptake.
- Drugs target specific receptors to either mimic (agonist) or block (antagonist) the action of natural signalling molecules, thereby altering cellular activity (e.g., beta blockers bind to cell receptors and alter cardiac activity).
Temperature affects membrane permeability and integrity.
At low temperatures, phospholipids in the membrane have less kinetic energy, leading to decreased membrane fluidity. The membrane becomes more rigid, which can reduce permeability.
If the temperature drops too low, ice crystals can form, puncturing the membrane and causing damage.
Temperature affects membrane permeability and integrity.
As temperature increases, phospholipids gain kinetic energy, making the membrane more fluid and less stable. The increased fluidity enhances the permeability of the membrane, allowing more substances to pass through.
Extremely high temperatures can denature membrane proteins, disrupting their function and further compromising membrane integrity.
Solvents affect membrane permeability and integrity.
Organic solvents, such as ethanol, disrupt the organisation of the phospholipid bilayer by dissolving lipids. This affects the membrane structure, making it more permeable.
At low concentrations, ethanol can slightly increase membrane permeability; but at higher concentrations, it can cause significant disruption, leading to leakage of cellular contents.
Detergents affect membrane permeability and integrity.
Detergents are amphipathic molecules that can be integrated into the phospholipid bilayer, disturbing its structure. This can lead to increased permeability or even complete disintegration of the membrane, depending on the concentration and type of detergent.
The effect of temperature on membrane permeability can be investigated using beetroot and distilled water.
Method:
- Cut beetroot into equal-sized discs to ensure consistent surface areas.
- Rinse the discs to remove any pigment released during cutting.
- Place beetroot discs in test tubes containing distilled water.
- Place each test tube in a water bath at a different temperature for a set time.
- Remove the discs and measure the absorbance of the liquid using a colourimeter (absorbance = how much light a solution absorbs).
Results:
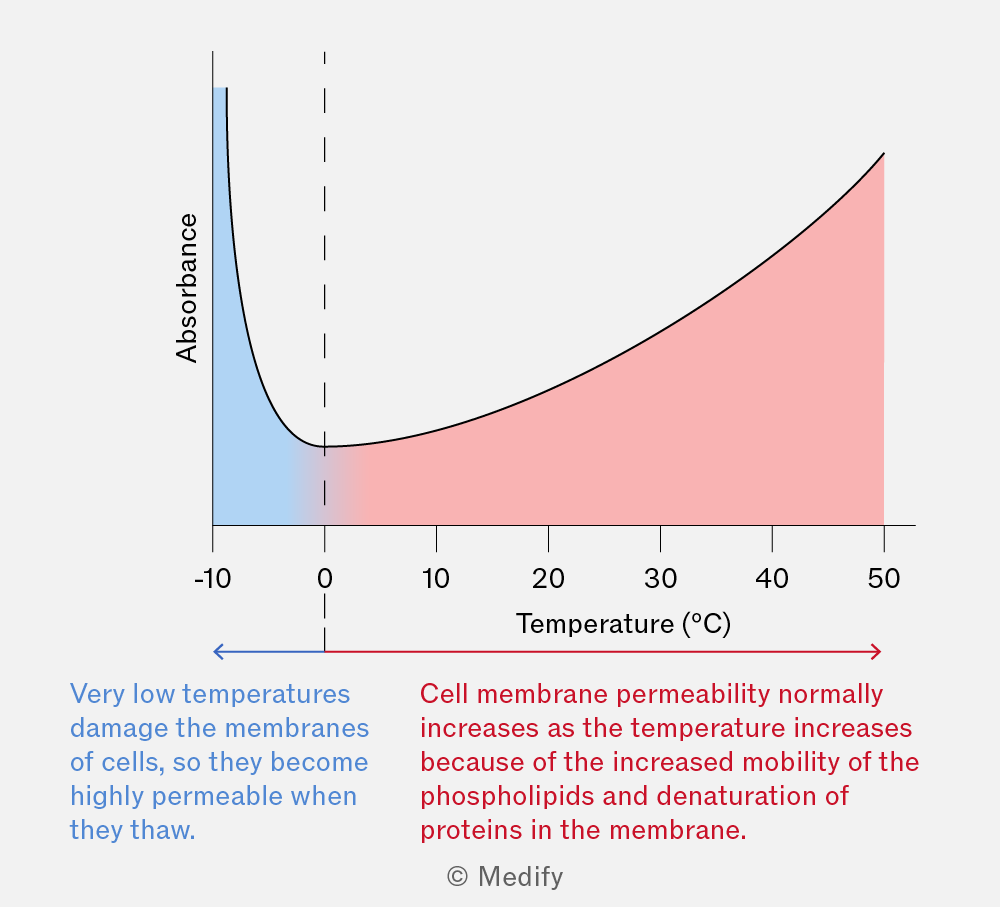
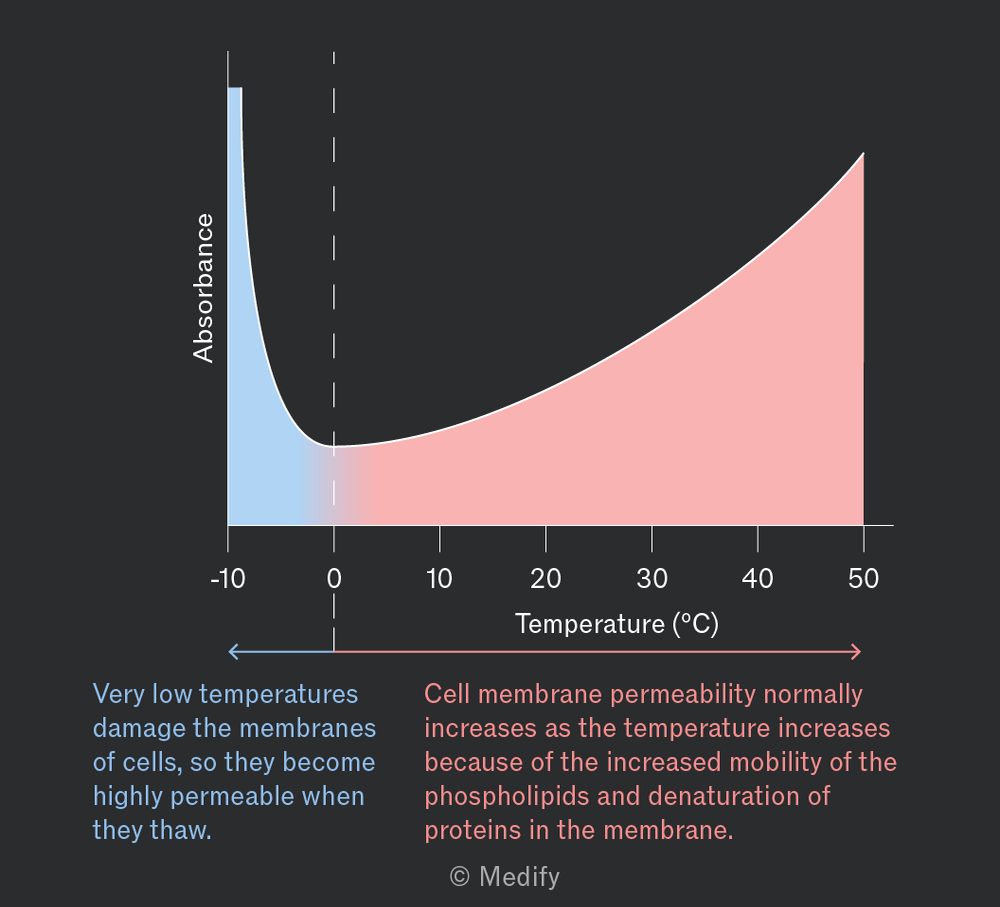
As temperature increases, the absorbance increases. Higher absorbance indicates more pigment has leaked from the cells, due to increased membrane permeability.
At very low temperatures membrane permeability may increase due to ice formation.
The effect of solvent concentration on membrane permeability can be investigated using beetroot and ethanol.
Method:
- Prepare beetroot discs to ensure consistent surface areas. Rinse and pat dry to remove any pigment released during cutting.
- Place the discs in test tubes containing different concentrations of ethanol.
- After a set time, remove the discs and measure the absorbance of the ethanol solution using a colourimeter (absorbance = how much light a solution absorbs).
- Compare the absorbance readings across the different concentrations.
Results:
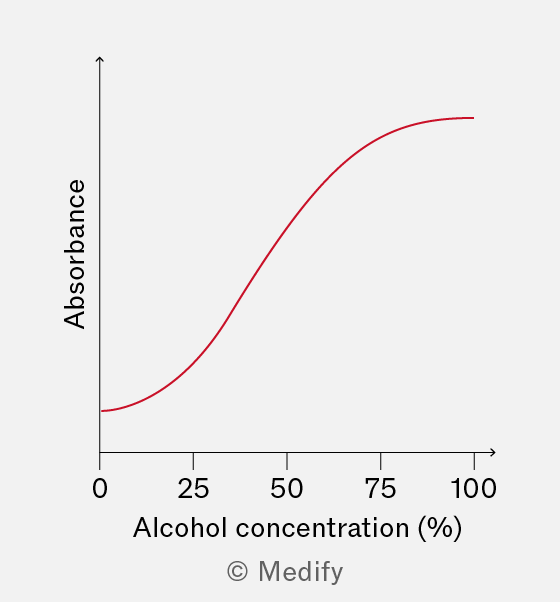
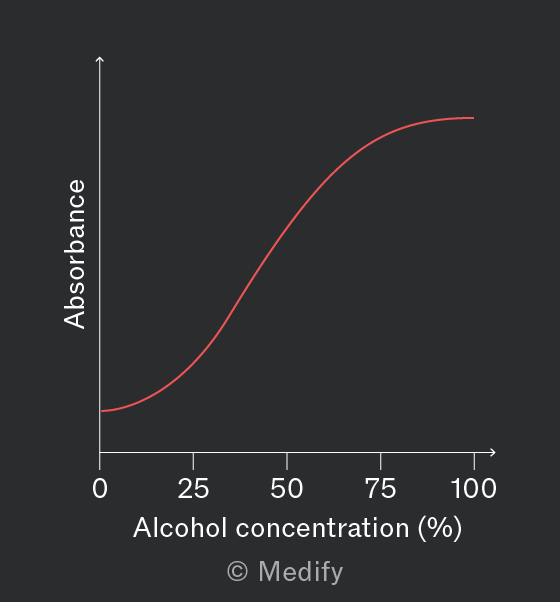
As the concentration of ethanol increases, absorbance increases. Increasing absorbance indicates higher membrane permeability, causing more pigment leakage.
Cell surface membranes control the movement of molecules into and out of cells, maintaining the internal environment and allowing communication with the external environment. There are two main categories of transport: passive transport, which does not require energy, and active transport, which does.
Diffusion and facilitated diffusion are the two main types of passive transport.
Diffusion is the movement of molecules directly through a phospholipid bilayer down their concentration gradient (high to low concentration) without requiring ATP. The process continues until there is equilibrium in molecule concentration between both sides of the membrane.
Molecules that can freely diffuse across membranes are typically small, non-polar, and hydrophobic (lipid soluble). Examples include gases such as and ), steroid hormones such as testosterone, and vitamins such as vitamin D.
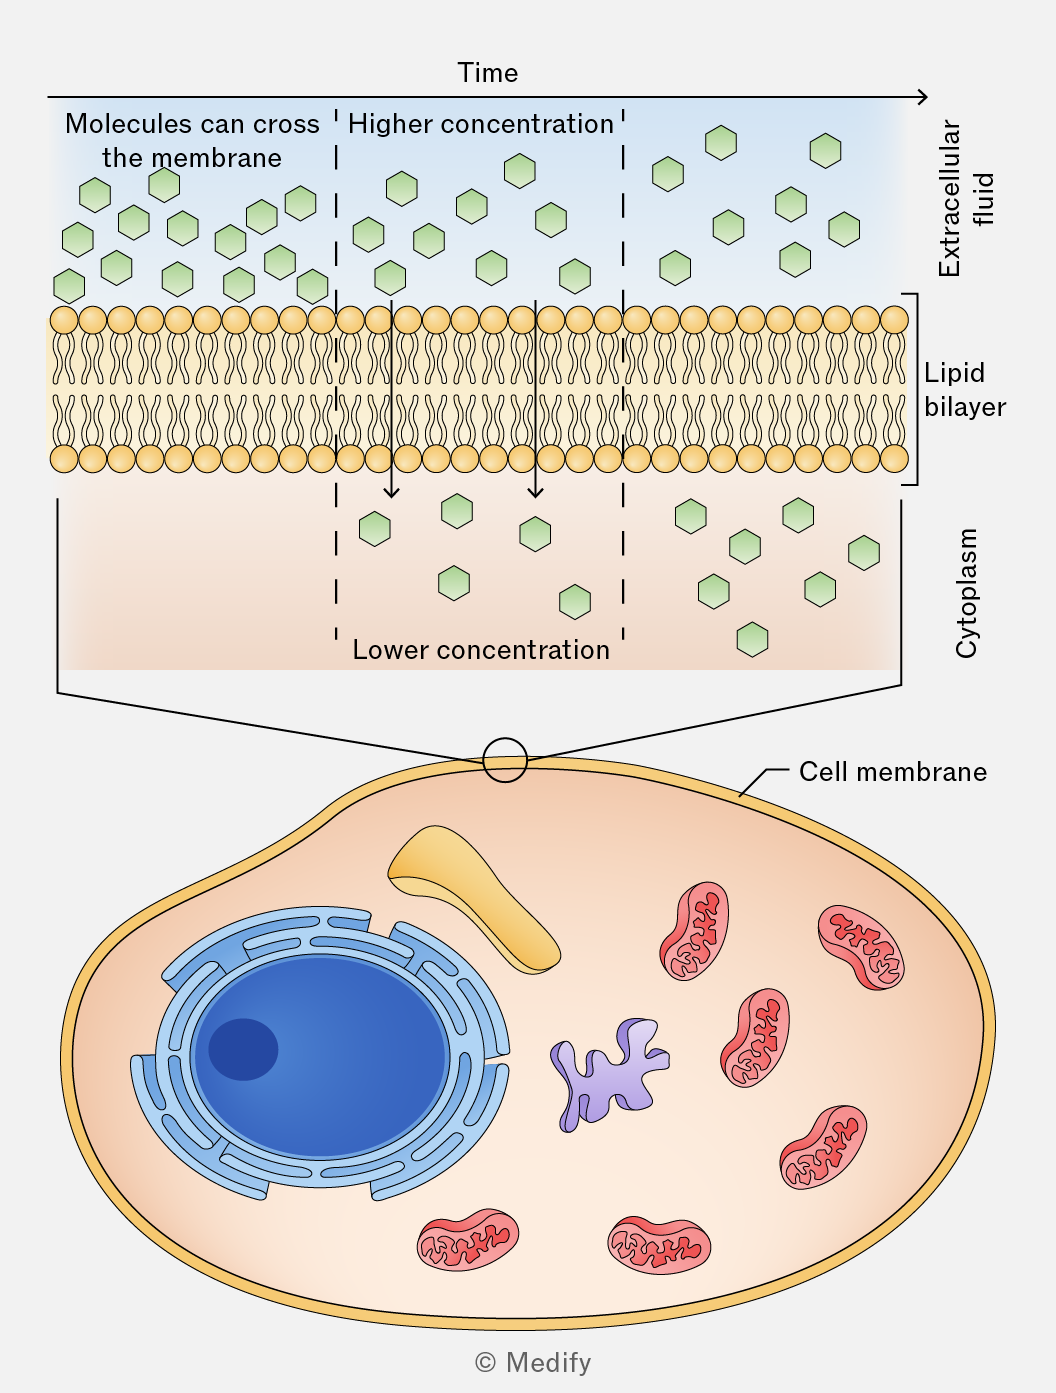
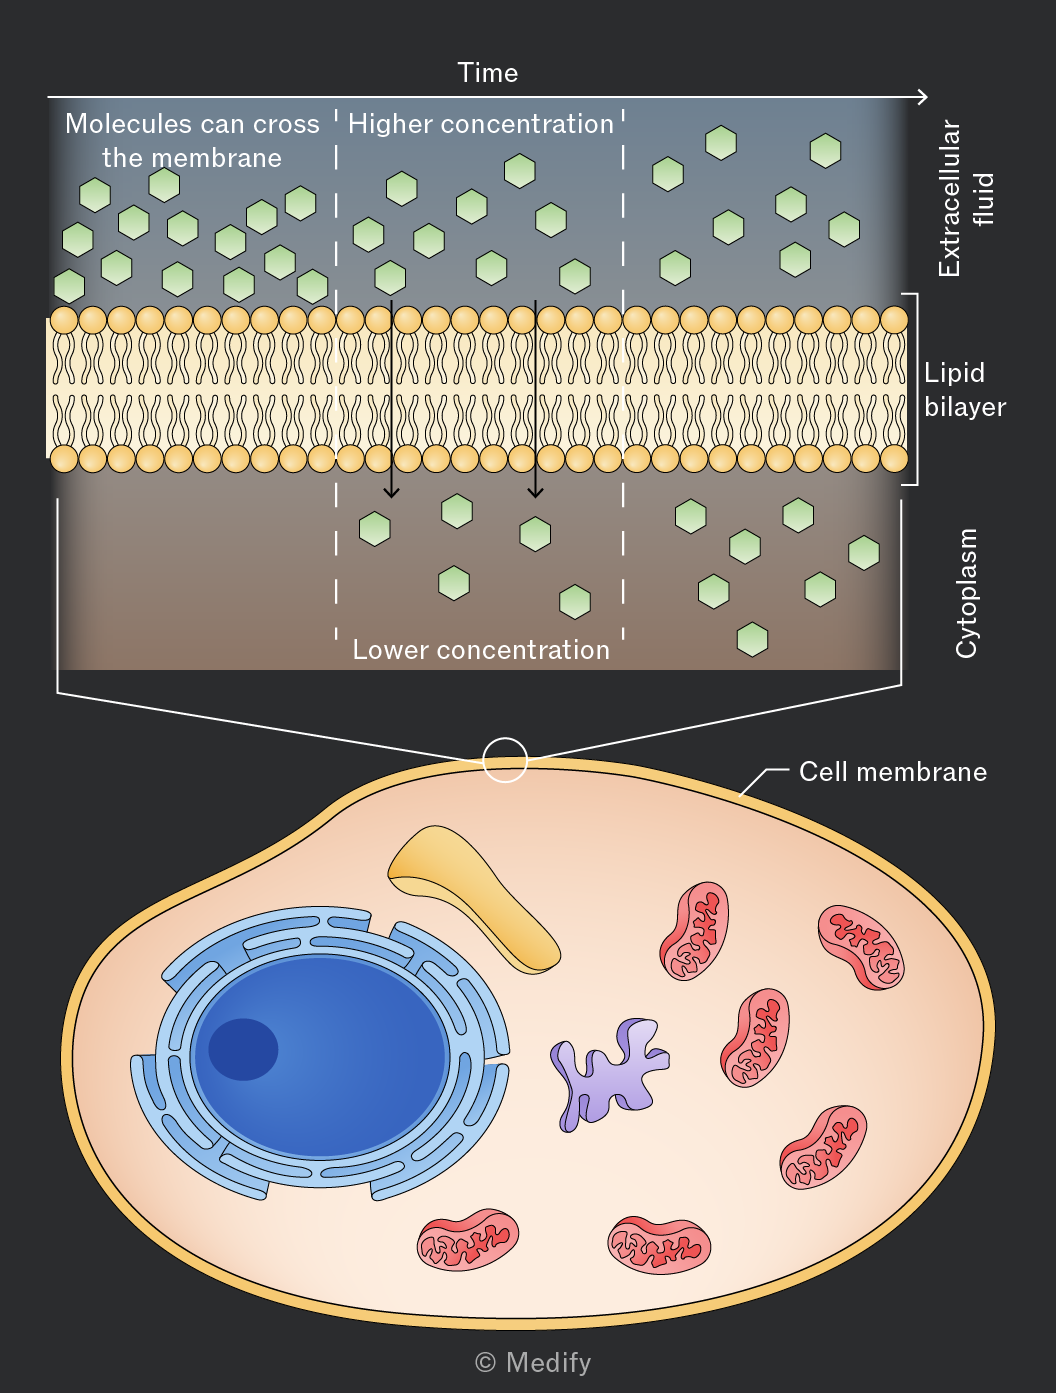
Diffusion and facilitated diffusion are the two main types of passive transport.
Facilitated diffusion is the process by which molecules and ions cross membranes using transport proteins. Molecules move down their concentration gradient (high to low concentration) without using ATP.
Channel proteins form hydrophilic pores through which specific molecules/ions can diffuse across the membrane.
Carrier proteins undergo conformational changes once specific molecules/ions bind to them, which enables those molecules/ions to be transported from one side of a membrane to the other.
Examples of molecules transported by facilitated diffusion include large, polar molecules, such as glucose, and charged molecules/ions, such as and .
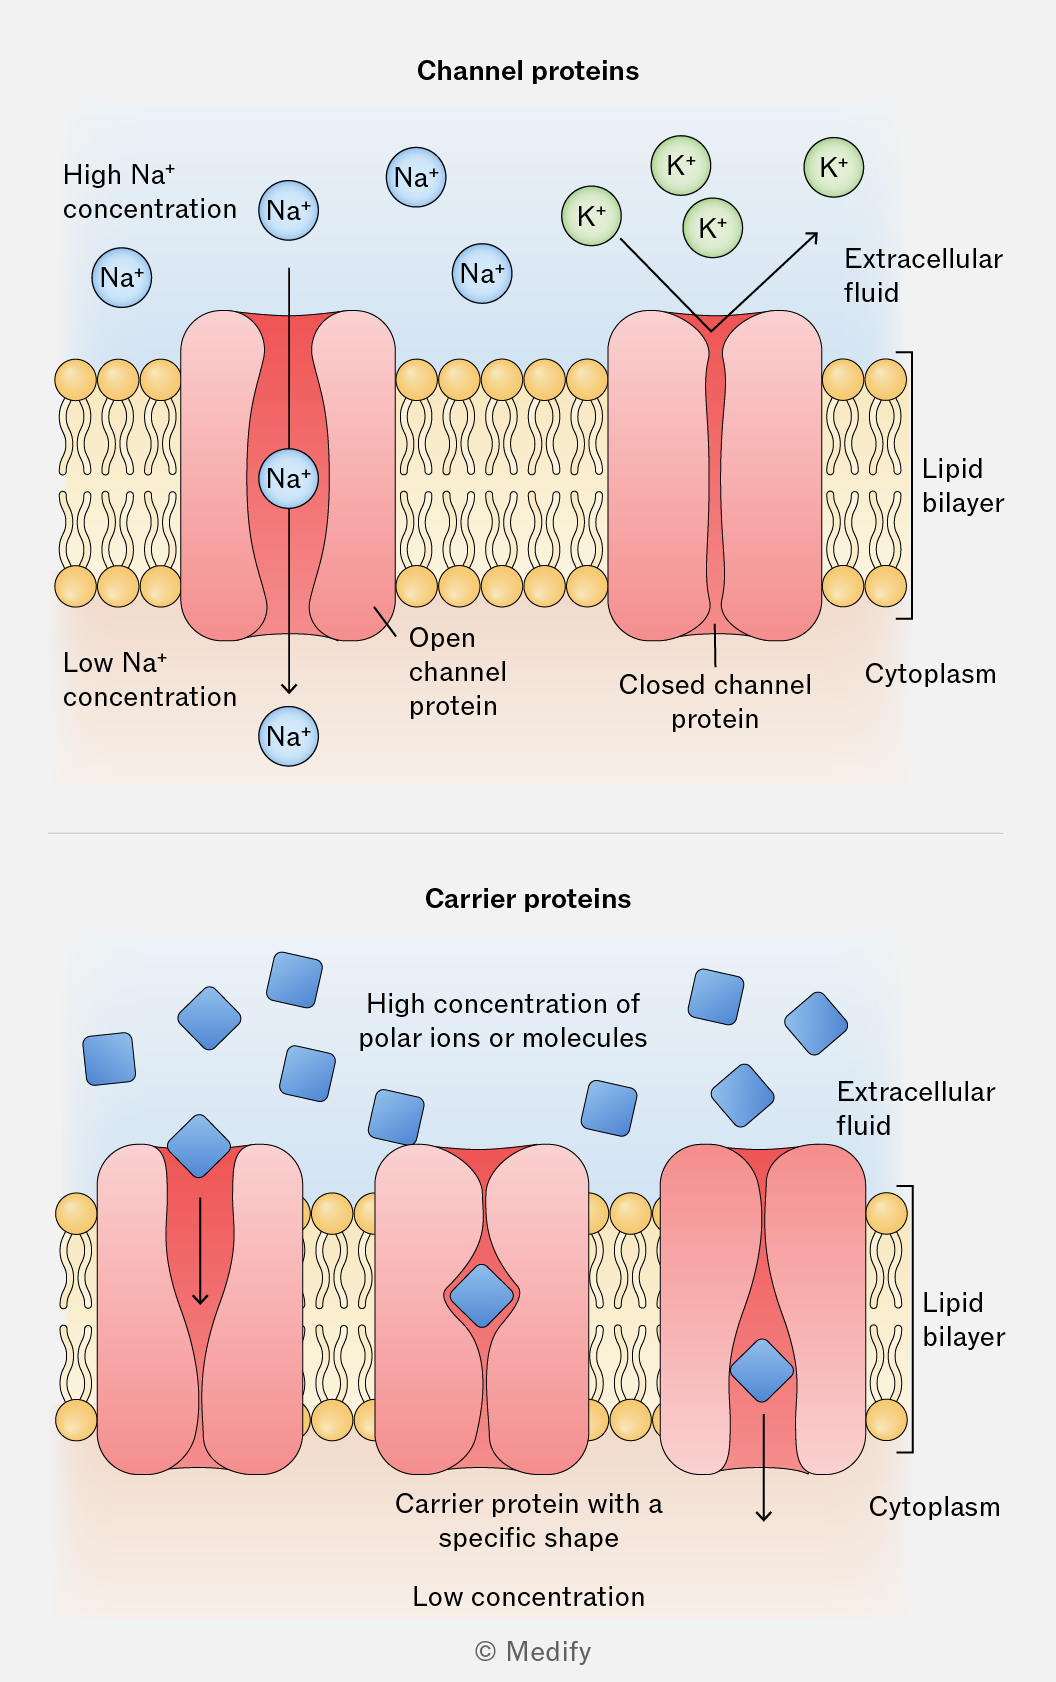
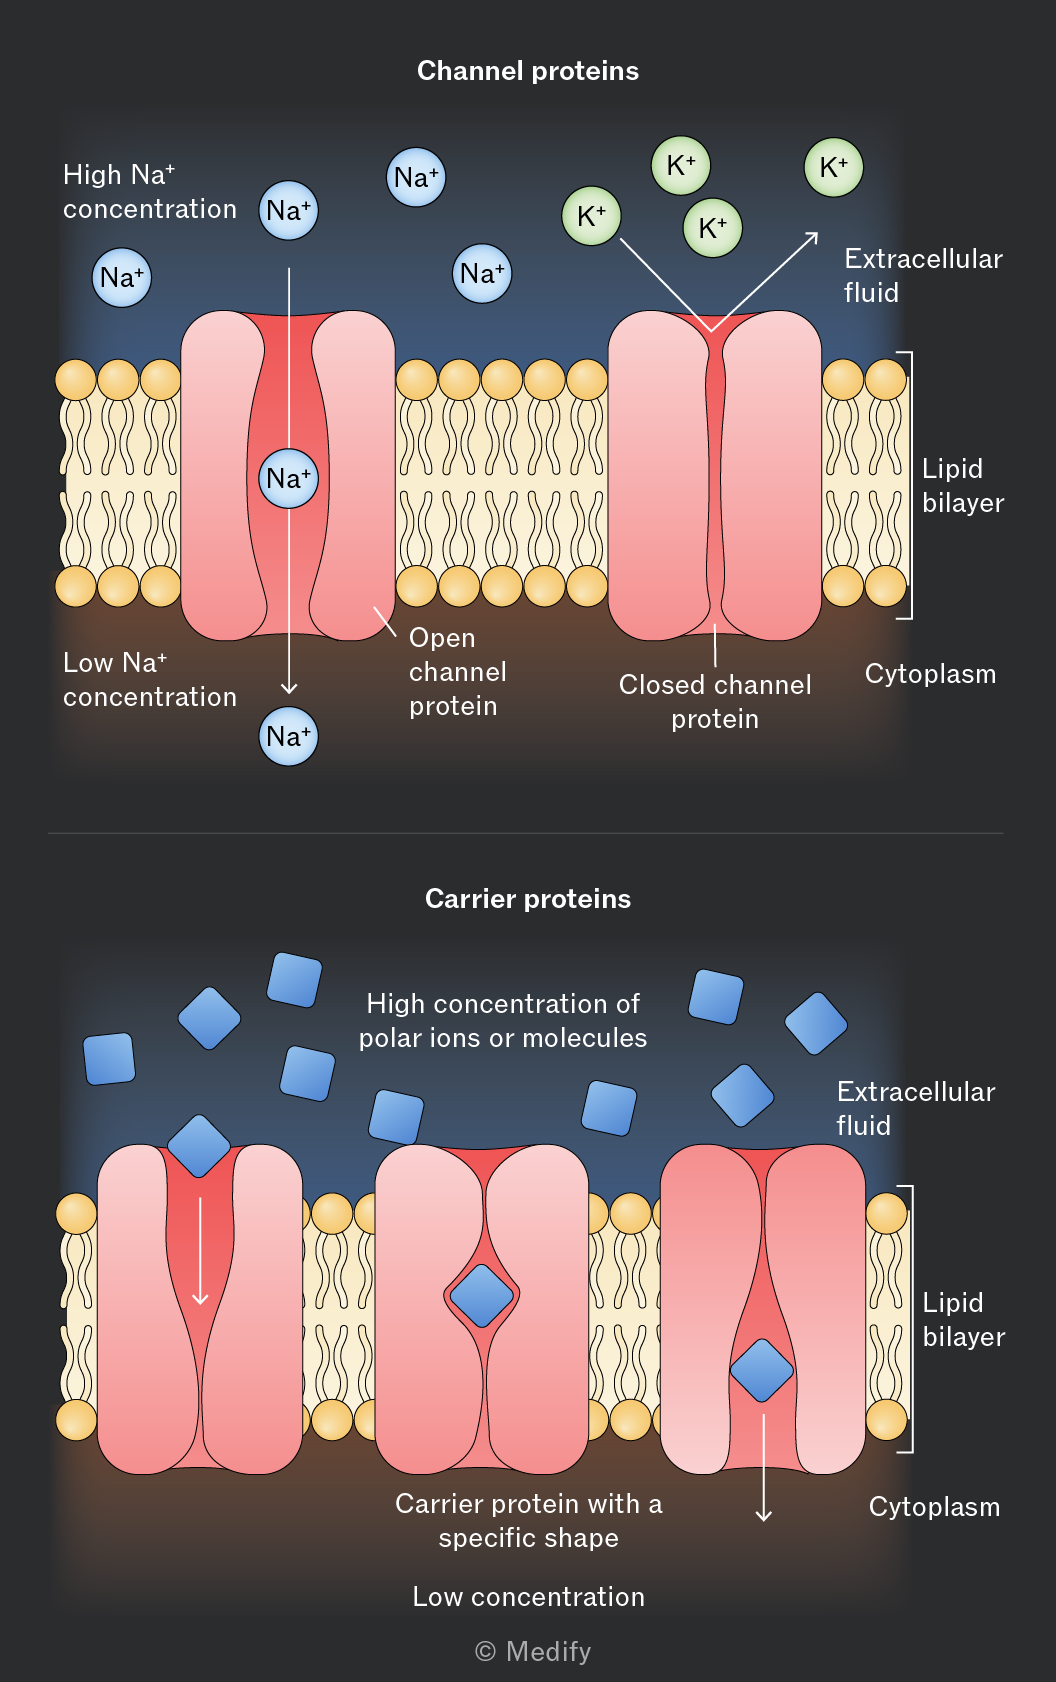
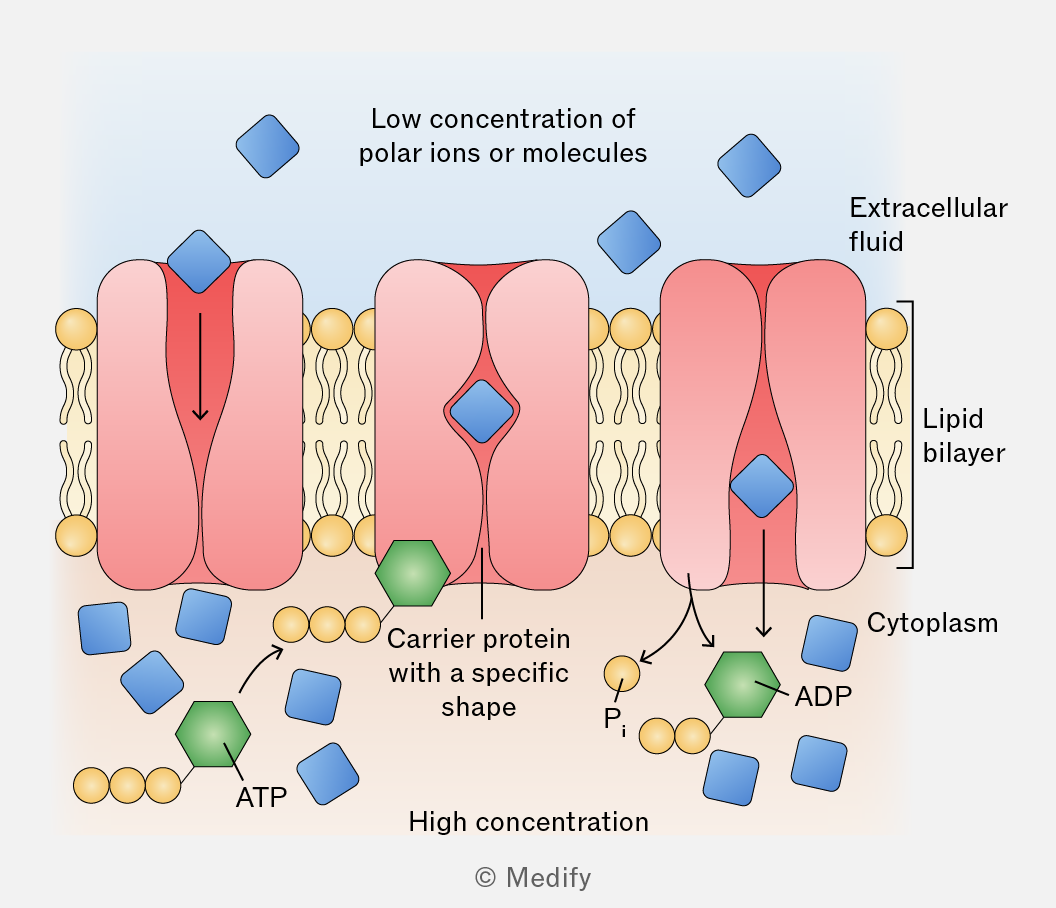
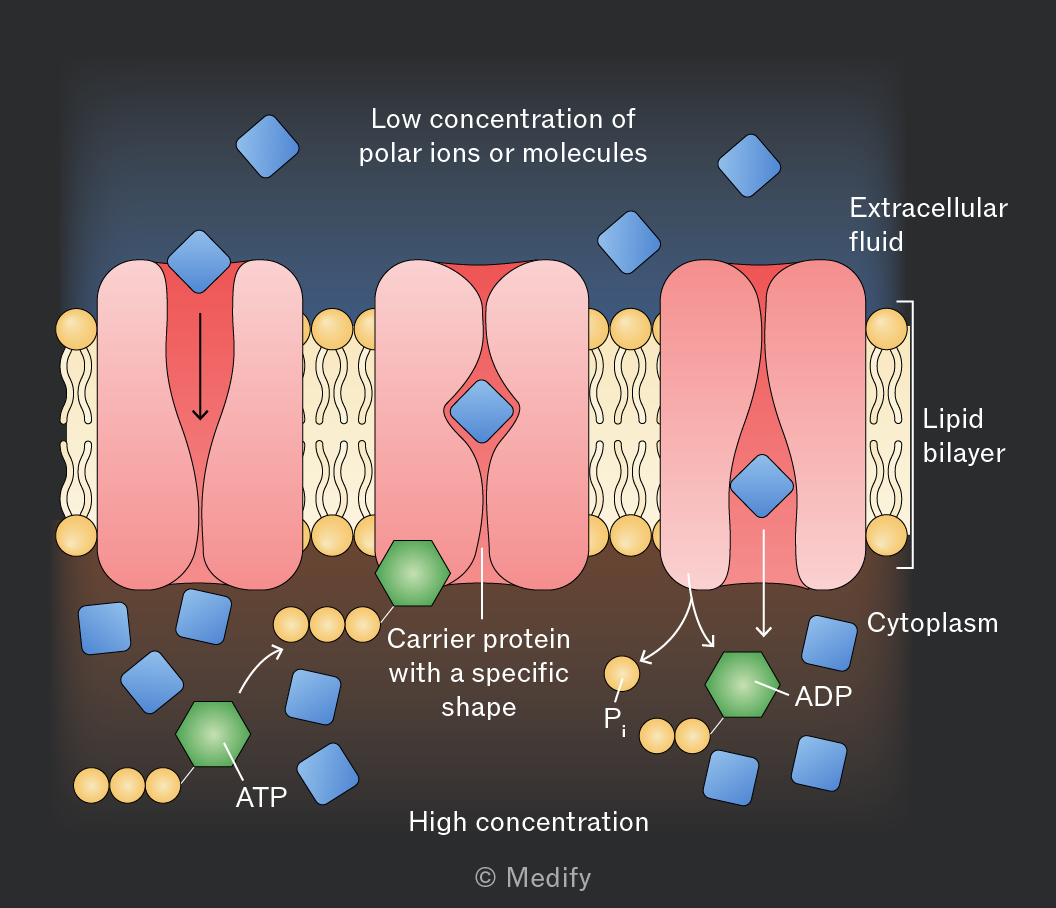
Active transport is the movement of ions/molecules against their concentration gradient (low to high concentration) using ATP as a source of energy and carrier proteins (which act as pumps).
- The ion/molecule to be transported binds to a receptor on the carrier protein.
- On the other side of the membrane, ATP also binds to the carrier protein.
- The ATP is hydrolysed to ADP + .
- The carrier protein undergoes a conformation change and opens, allowing the molecule/ion in.
- The molecule is released (and recombines with ADP to form ATP) and the protein returns to its original shape.
Example: -ATPase pumping out of and into neurons to restore and maintain the resting membrane potential.
Bulk transport is a special kind of active transport that moves material (large molecules or whole cells) that is too large to pass through the membrane via proteins.
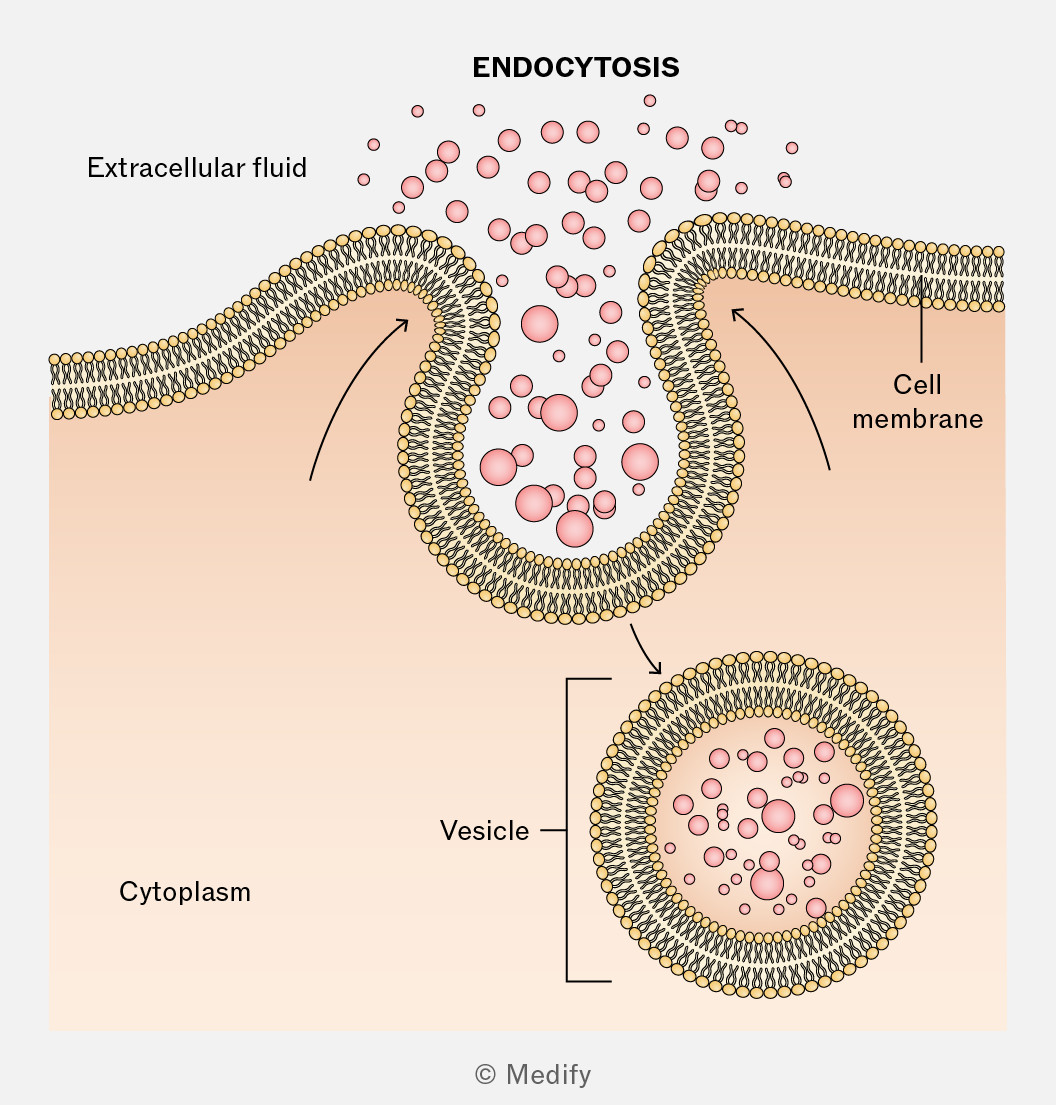
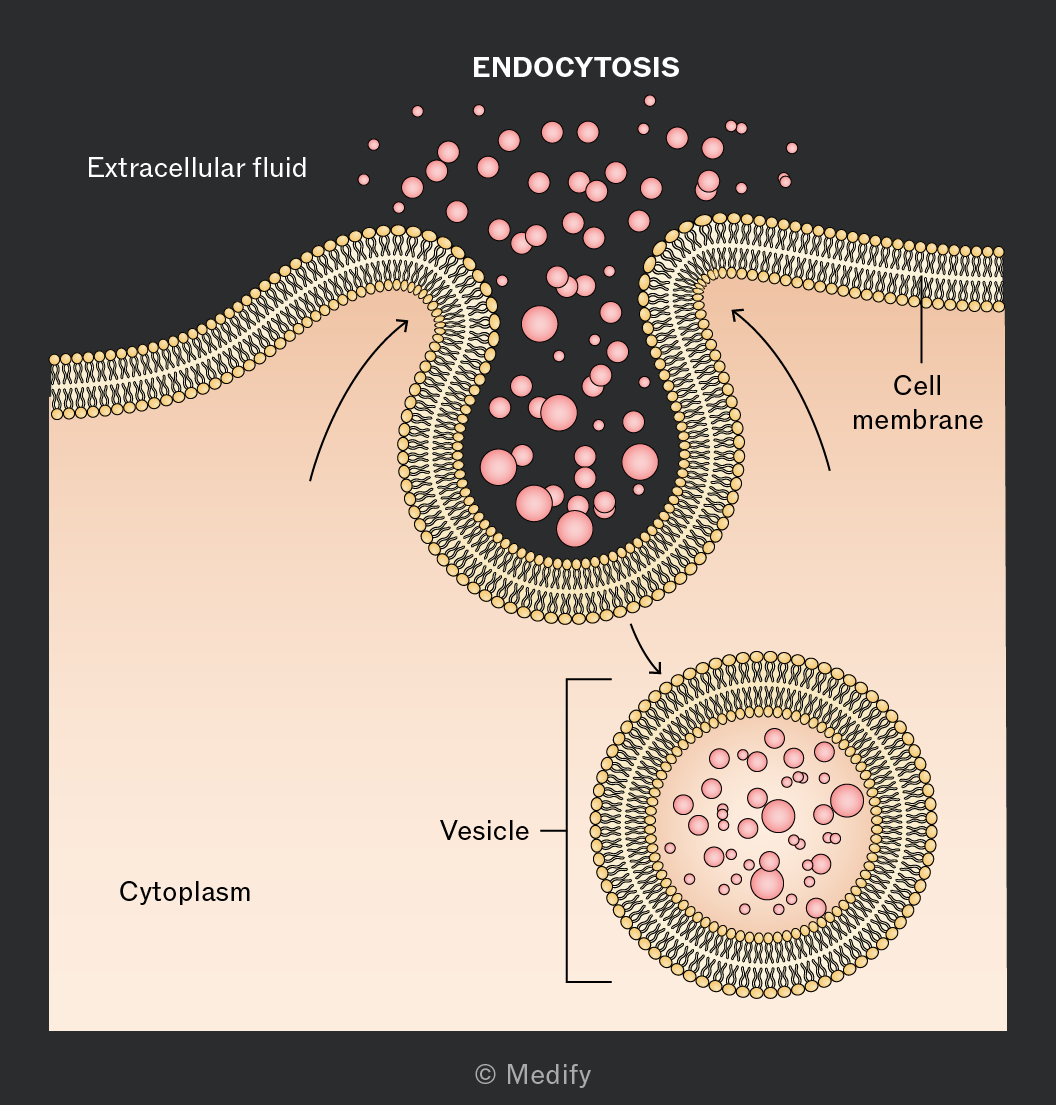
In endocytosis, cells engulf external substances by invagination of the membrane moving them into the cell in vesicles. This requires ATP.
- Phagocytosis is where large, solid particles, such as bacteria, are engulfed.
- Pinocytosis is where the cell ingests extracellular fluid and its solutes.
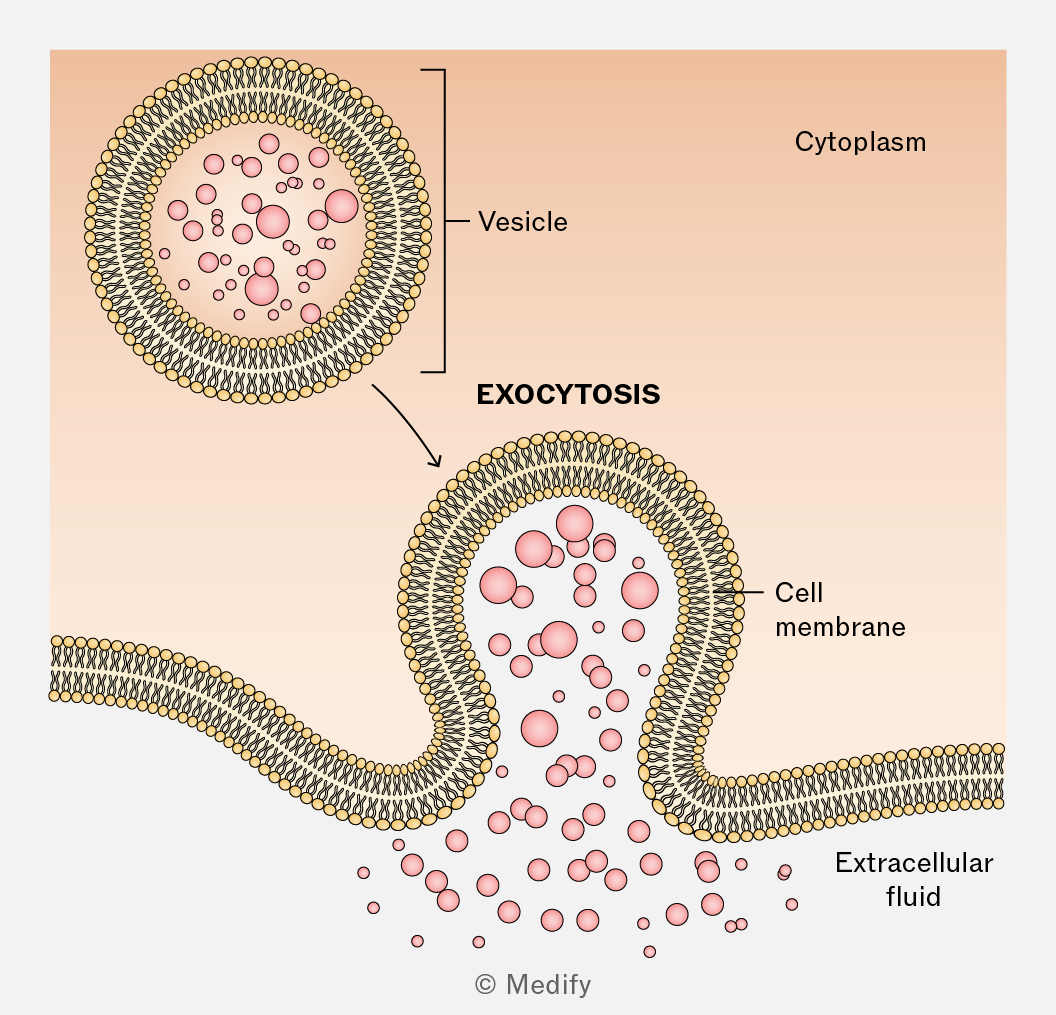
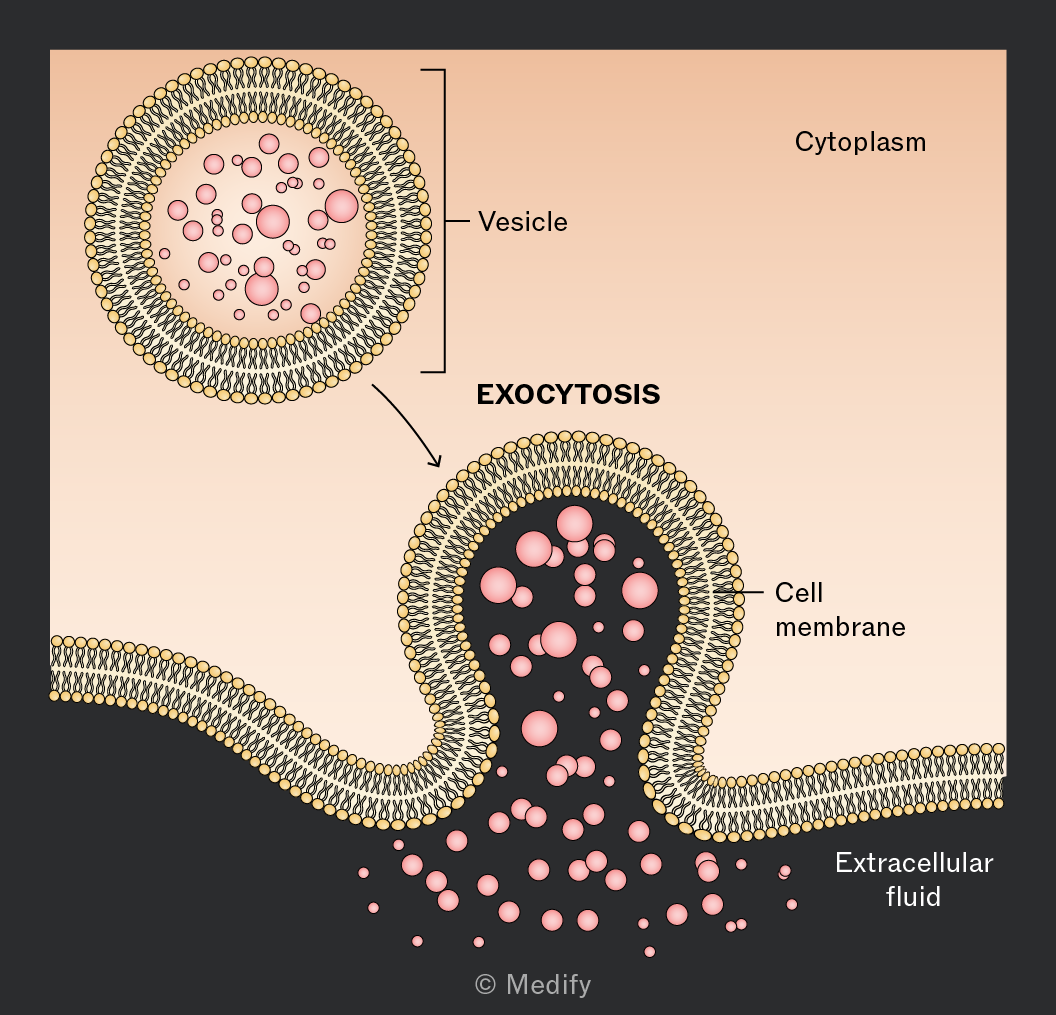
Bulk transport is a special kind of active transport that moves material (large molecules or whole cells) that is too large to pass through the membrane via proteins.
In exocytosis, cells expel materials in vesicles that fuse with the plasma membrane and release their contents outside the cell. This requires ATP. The secretion of neurotransmitters, hormones, and digestive enzymes are examples.
There are several factors that affect diffusion rate. These can be investigated using model cells (agar cubes).
Method:
- Make agar mixed with a pH indicator and cut into different sized cubes (e.g. 1 cm³, 2 cm³, 3 cm³).
- Immerse the cubes in hydrochloric acid
- As the ions diffuse into the agar, the indicator colour changes from the outside inwards.
- Measure and record the time taken for each cube to completely change colour.
Results:
Cubes with a higher surface area to volume ratio (smaller cubes have higher surface area per unit volume) change colour more rapidly. The ions diffuse more efficiently and the diffusion distance to the centre of the cube is lower.
This investigation can also be set up to test the effects of other factors on diffusion distance:
- Temperature – as temperature increases, the kinetic energy of the ions increases, increasing diffusion rate.
- Concentration gradient – as concentration gradient increases, ions diffuse faster from the area of high concentration to the area of low concentration, increasing diffusion rate.
Osmosis is the diffusion of water molecules across a partially permeable membrane from a region of higher water potential (lower solute concentration) to a region of lower water potential (higher solute concentration). This process continues until equilibrium is reached. It does not require ATP.
Partially permeable membranes allow certain substances to pass through, but restrict or prevent the movement of others.
Cell surface membranes are partially permeable membranes.
Often, small molecules, such as and can diffuse across cell membranes, whereas larger or charged molecules require transport proteins.
Water potential measures the potential energy of water in a solution compared to pure water under standard conditions atmospheric pressure).
Measured in kilopascals (kPa), pure water has (highest possible value).
determines the direction of water movement by osmosis, as water moves from a region of higher water potential (less negative) to a region of lower water potential (more negative) down the water potential gradient.
The steeper the water potential gradient, the faster the rate of osmosis.
Solutes lower (make it more negative) because they bind water molecules and reduce free energy.
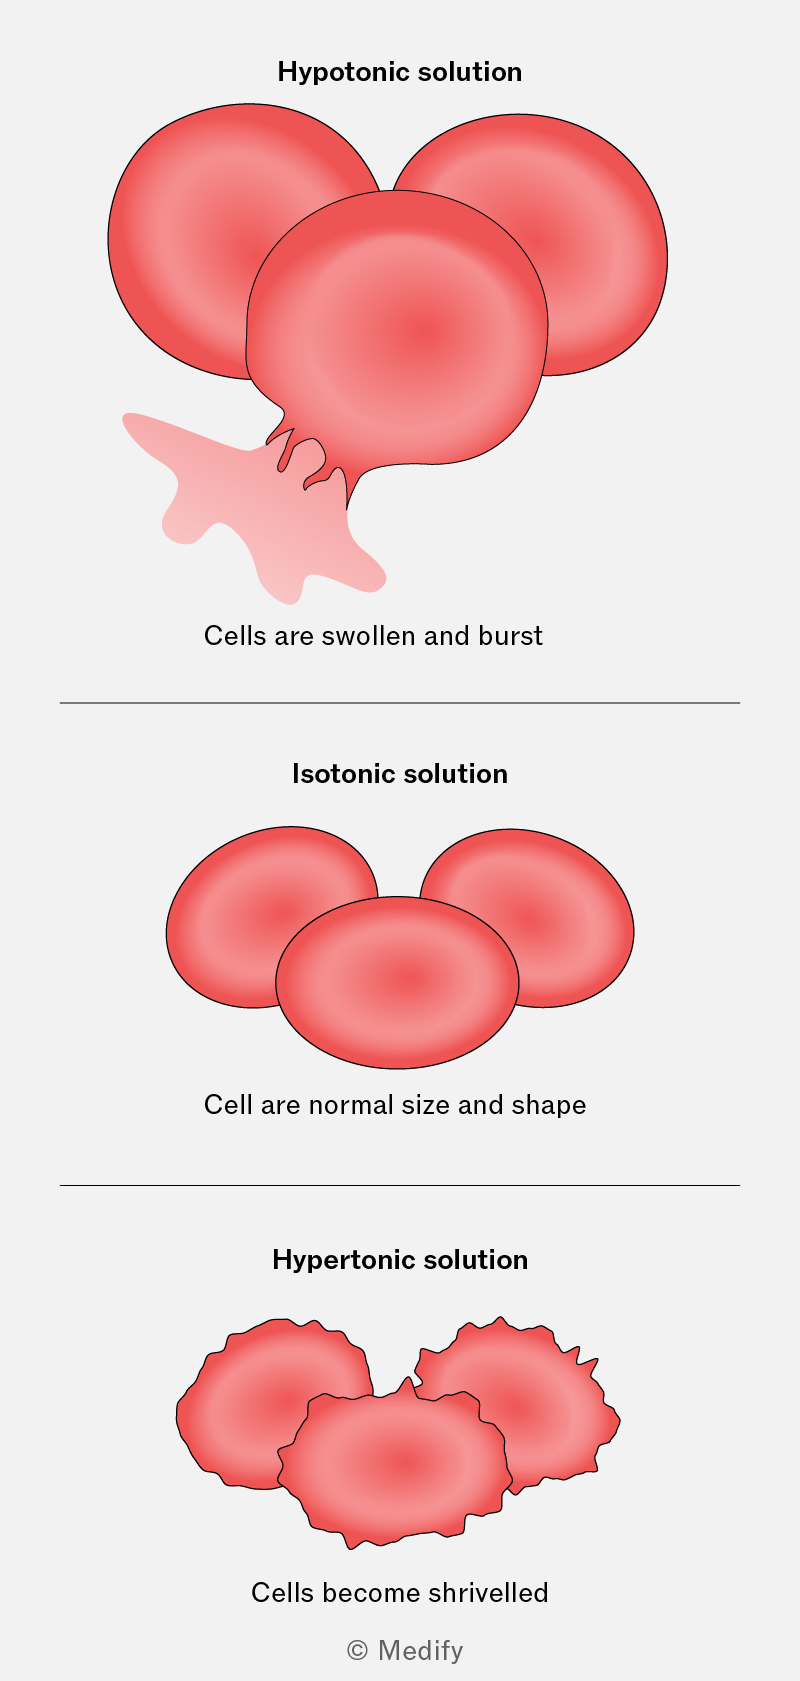
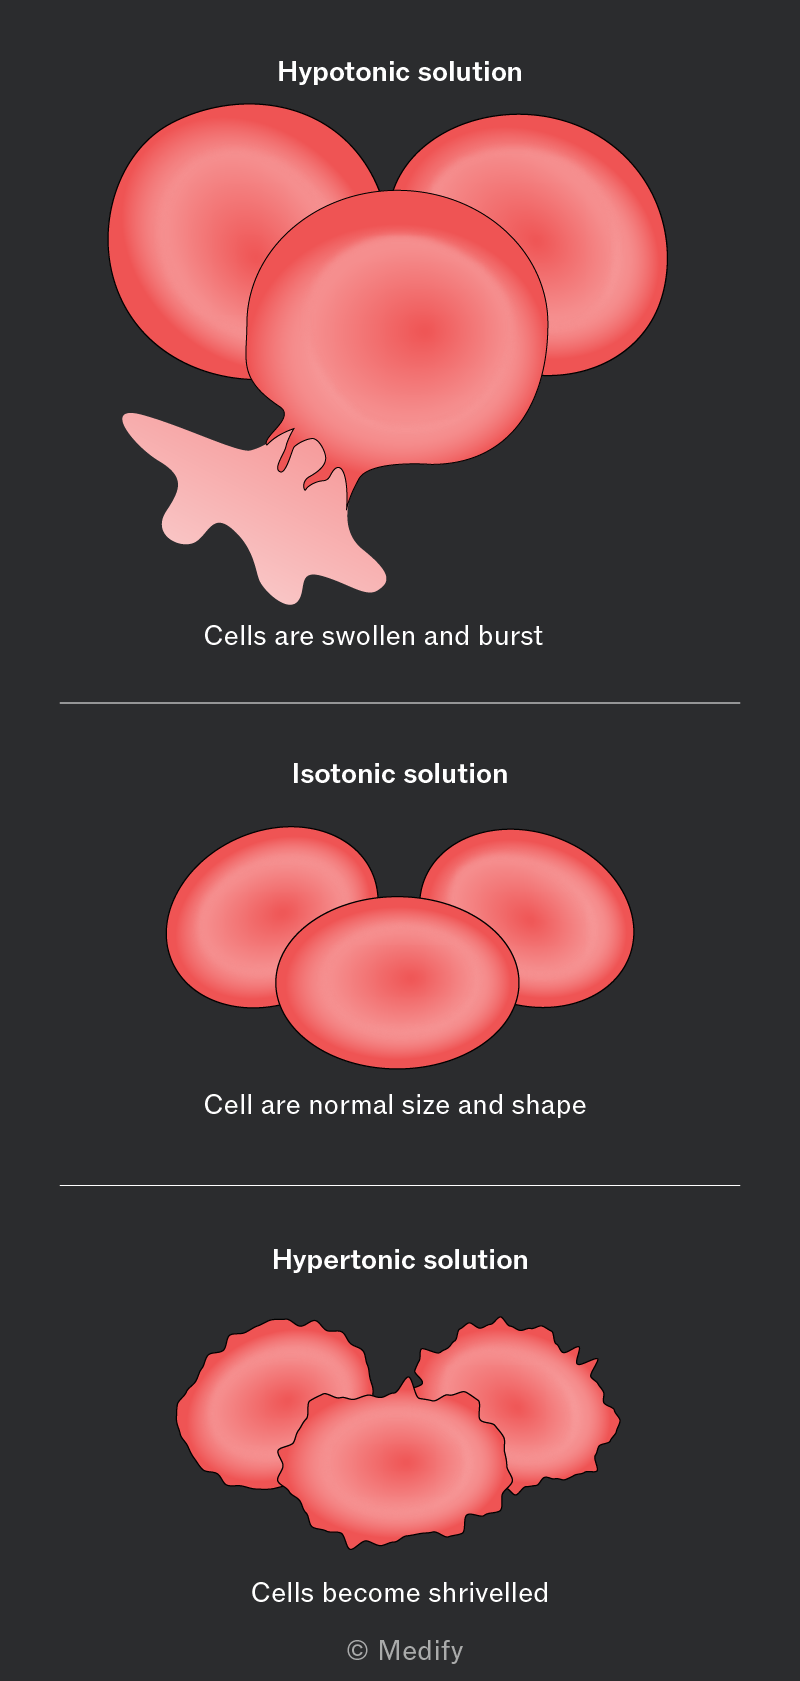
Solutions of different water potentials have predictable effects on animal cells.
- Hypotonic solutions (higher water potential than cell) cause water to enter the animal cell by osmosis.The cell swells and may eventually lyse (burst) because animal cells lack a cell wall to resist the increased internal pressure.
- Isotonic solutions (same water potential as cell) cause no net movement of water; the cell maintains its normal shape.
- Hypertonic solutions (lower water potential than cell) cause water to leave the animal cell by osmosis. The cell becomes crenated (shrinks) as it loses water, leading to a wrinkled appearance.
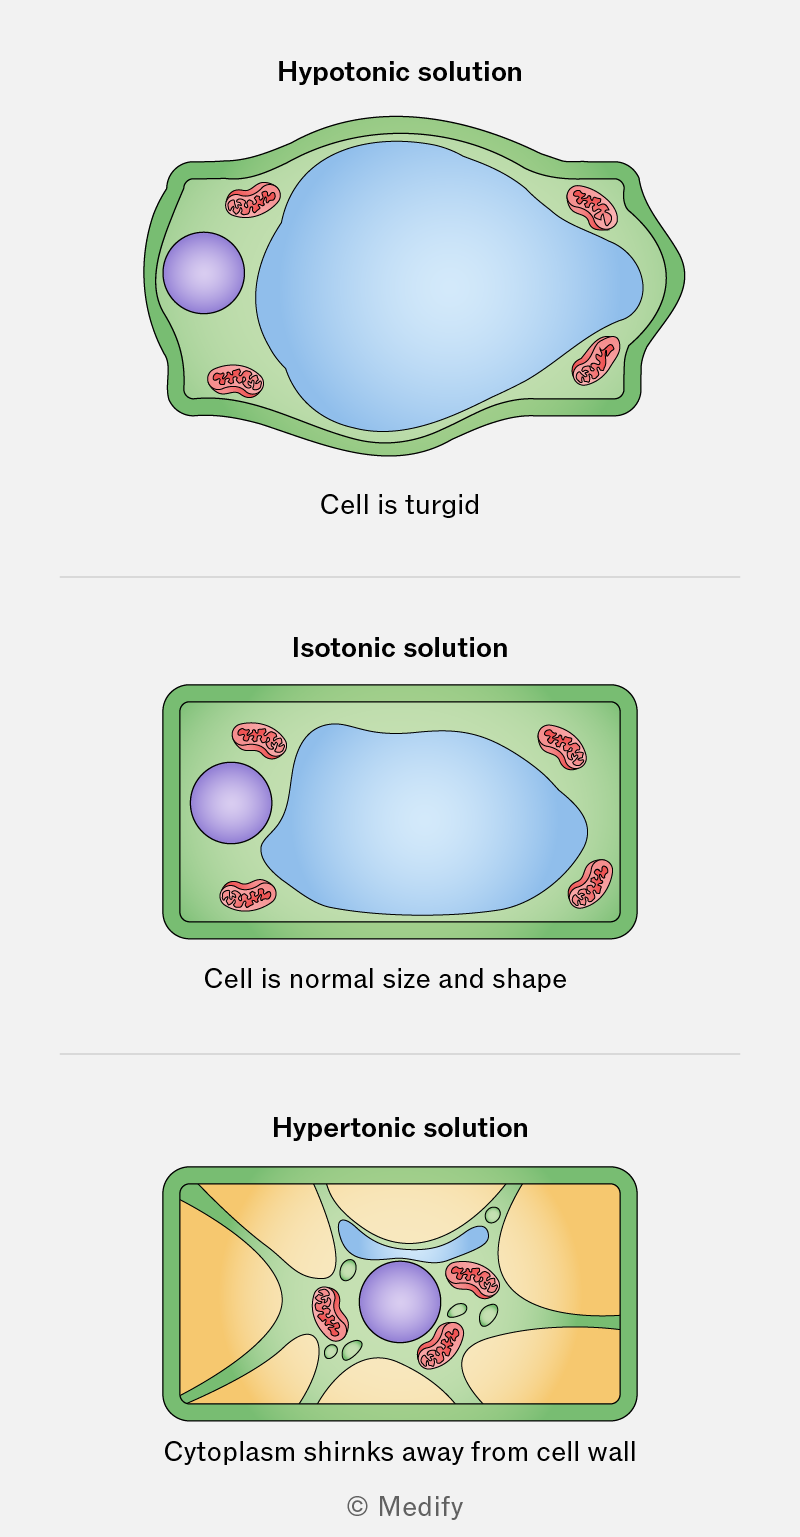
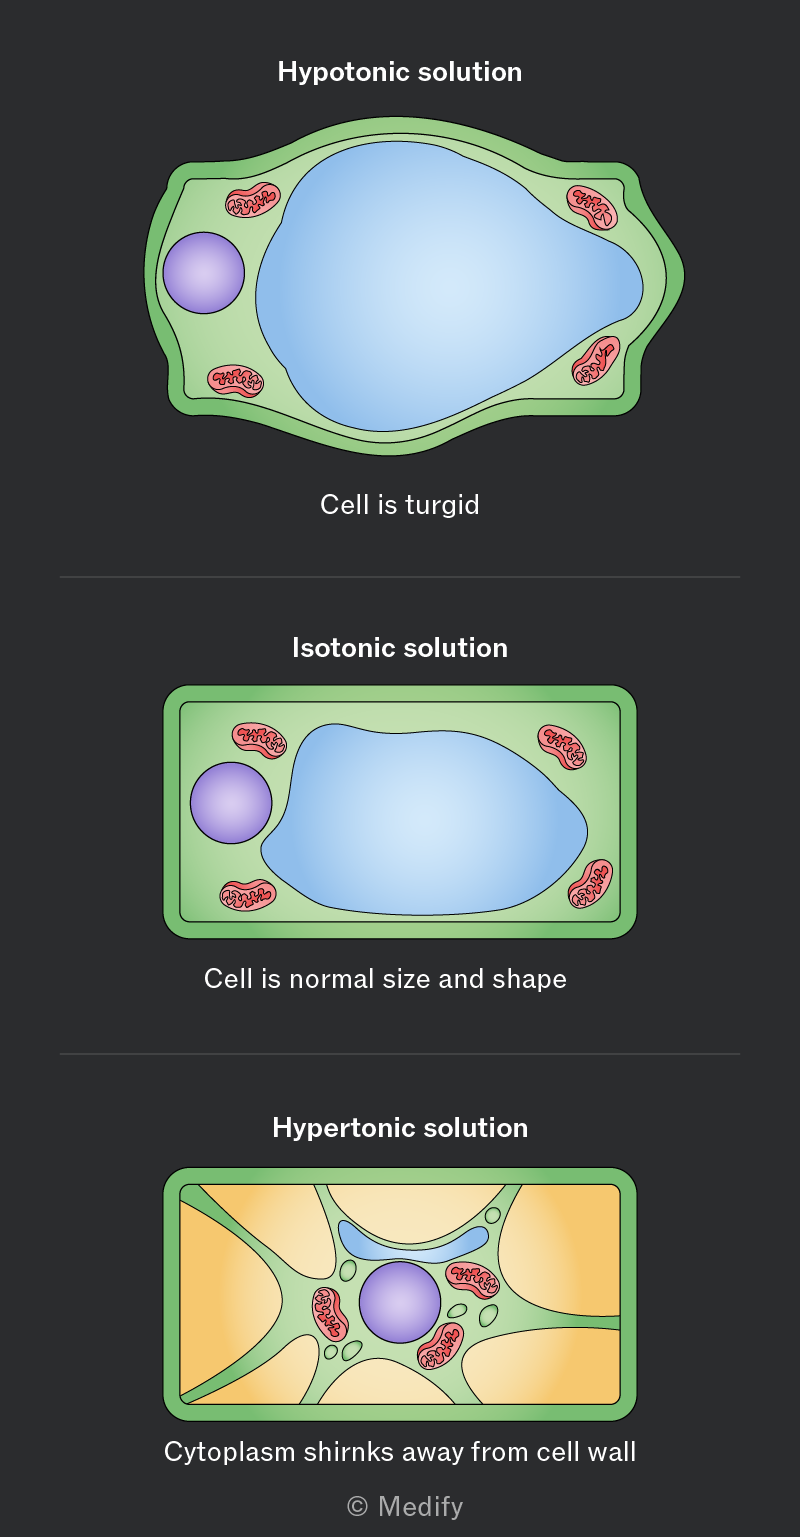
Solutions of different water potentials have predictable effects on plant cells.
- Hypotonic solutions (higher water potential than cell) cause water to enter the cell. The cell becomes turgid as the vacuole fills, pressing the cytoplasm against the cell wall (which prevents the cell bursting).
- Isotonic solutions (same water potential as cell) causes no net water movement; the cell remains in its normal state.
- Hypertonic solutions (lower water potential than cell) cause water to leave the cell (vacuole and cytoplasm). The cell becomes plasmolysed, with the plasma membrane pulling away from the cell wall, leading to a flaccid, wilted appearance.
The effect of water potential on osmosis in animal cells can be investigated using saline solutions and red blood cells (RBCs).
Method:
- Prepare labelled saline solutions of different concentrations.
- Add a drop of blood to each saline solution and mix gently.
- After a few minutes, place a drop from each mixture on a microscope slide, cover with a coverslip, and observe under the microscope.
- Record the appearance of RBCs (normal, swollen, or crenated) in each solution.
Results:
Red blood cells placed in hypotonic solutions will swell and can lyse due to excessive water intake.
Red blood cells in hypertonic solutions will shrink and become crenated as water leaves the cells.
Red blood cells in isotonic solutions will maintain their normal, biconcave shape.
The effect of water potential on osmosis in plant cells can be investigated using sucrose solutions and potato cells.
Method:
- Use a cork borer to cut potato cylinders of equal size.
- Measure and record the initial mass of each cylinder.
- Place each cylinder in a beaker containing a different concentration of sucrose solution.
- Leave the potato cylinders in the solutions for a few hours.
- Remove the potato cylinders, blot them gently to remove surface liquid, and reweigh them.
- Record the final mass and calculate the change in mass for each cylinder.
Results:
Potato cylinders placed in hypotonic solutions (lower sucrose concentration than the potato cells) will gain mass as water enters the cells by osmosis.
Cylinders in hypertonic solutions (higher sucrose concentration) will lose mass as water leaves the cells.
Cylinders in isotonic solutions (same concentration) should show little to no change in mass.