
Enzymes (2.1.4)
On this page
Enzymes are a type of globular protein. They have a specific 3-dimensional shape as a result of their primary structure (sequence of amino acids).
Activation energy is the energy needed to start a reaction.
Enzymes act as biological catalysts, lowering the activation energy required for a reaction to occur by forming weak interactions with the substrate. These interactions can strain the bonds in the substrate, making them more likely to break or form.
Enzymes are not altered or used up during a reaction; they can be reused.
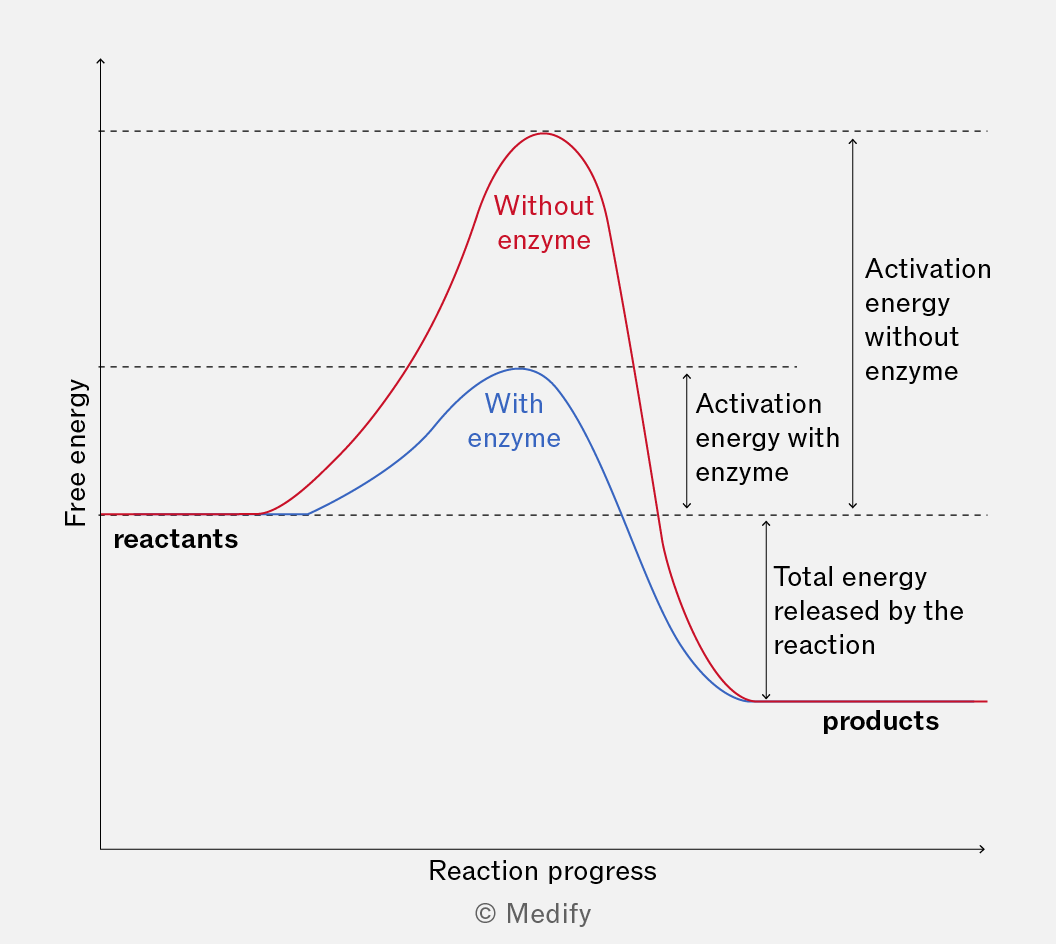
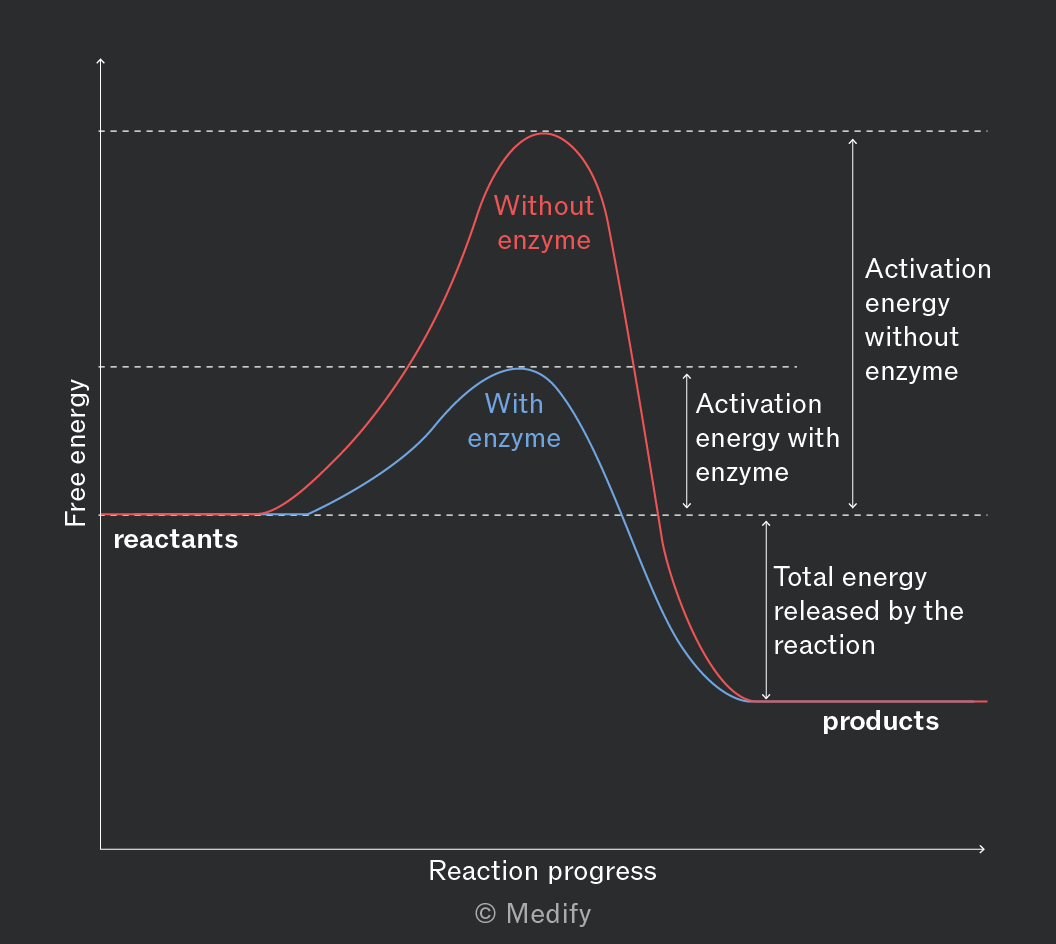
In cells, many metabolic reactions have high activation energies and would occur too slowly at normal biological temperatures. Enzymes lower the activation energy, allowing reactions to proceed quickly and efficiently, supporting life without raising the cell’s temperature.
Enzymes play a crucial role in regulating metabolism, determining structures and functions from the cellular to the whole organism level.
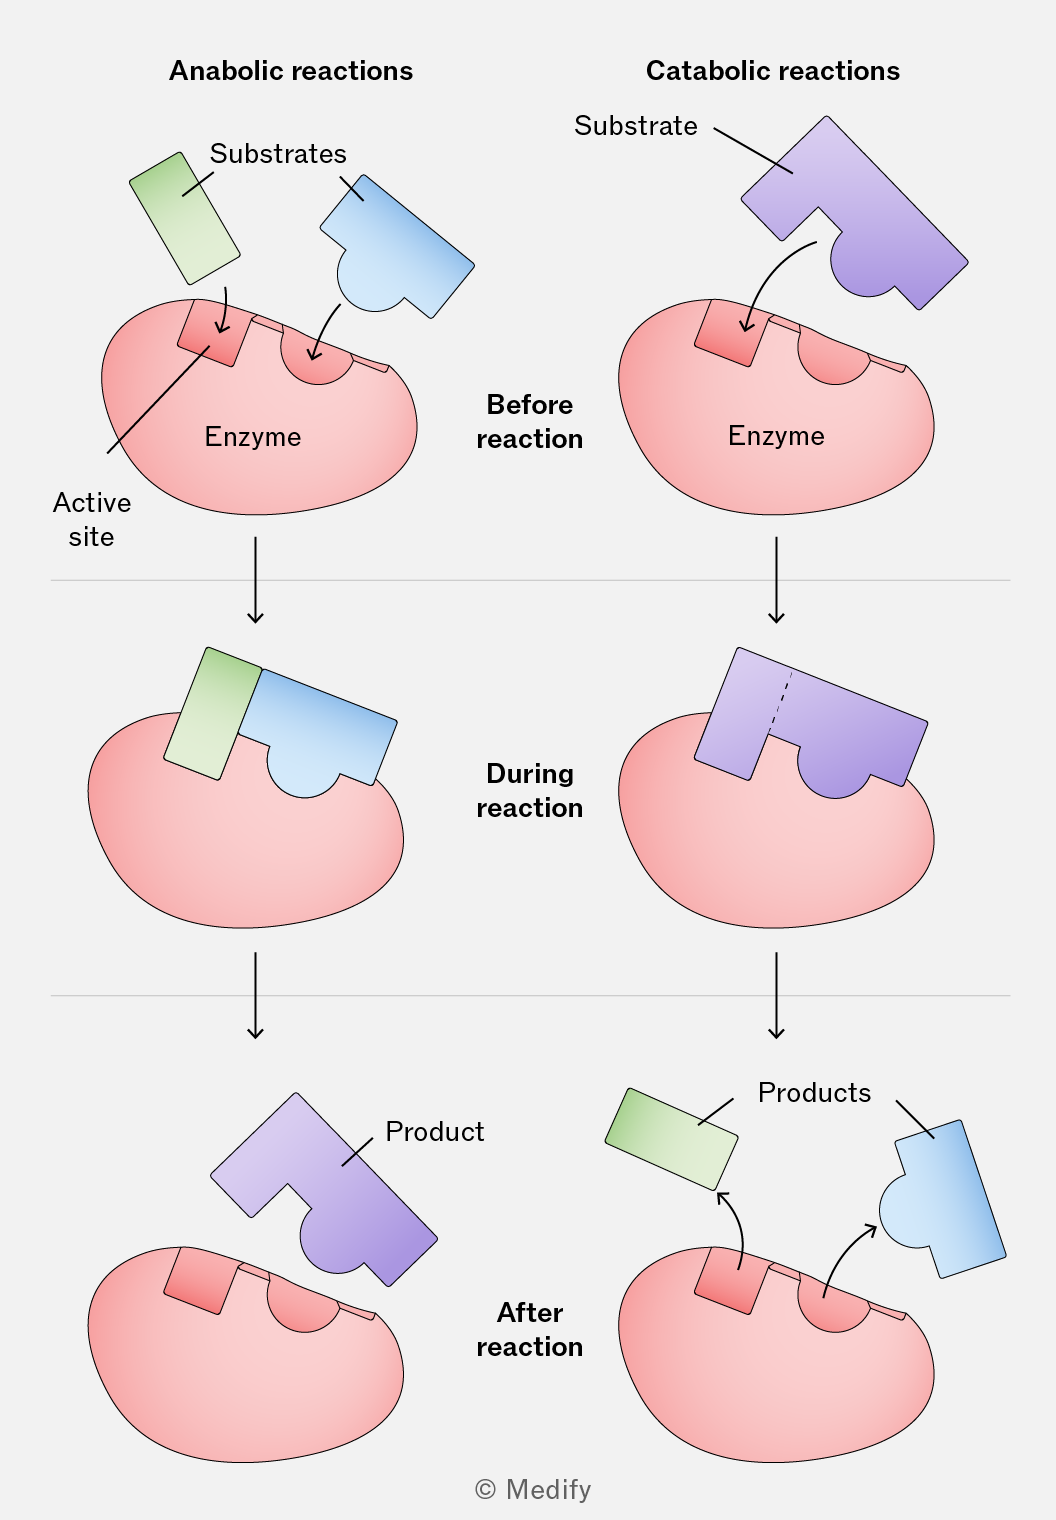
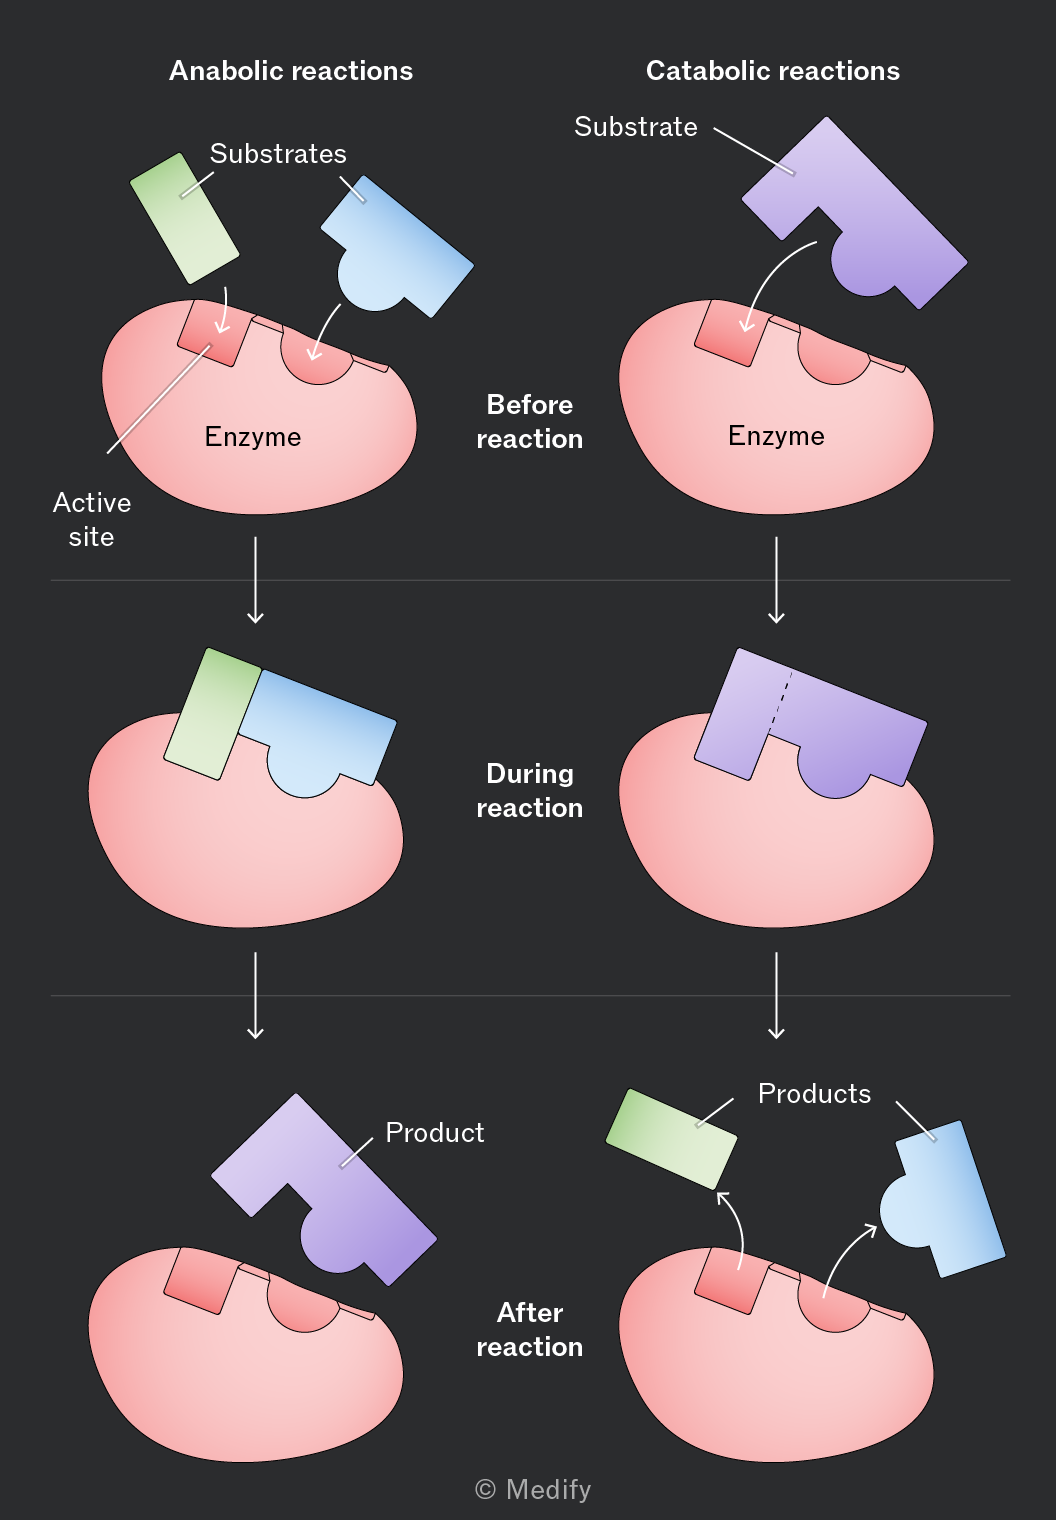
Enzymes catalyse anabolic reactions where large molecules are synthesised from their component parts.
For example, enzymes are involved in synthesising structural components, such as:
- Cellulose: Enzymes join together beta-glucose monomers to form the cellulose polymer to build plant cell walls.
- Muscle fibres: Enzymes join amino acid monomers together to form the proteins (such as actin and myosin) that assemble into muscle filaments.
Enzymes catalyse catabolic reactions where large molecules are broken down into smaller molecules. These reactions usually release energy (and the end-products can be used in respiration to produce ATP).
For example, the enzyme amylase catalyses the hydrolysis (breakdown) of starch into maltose.
Without enzymes catalysing catabolic reactions, large molecules in our food would not be broken down or energy released at a rate fast enough to support life.
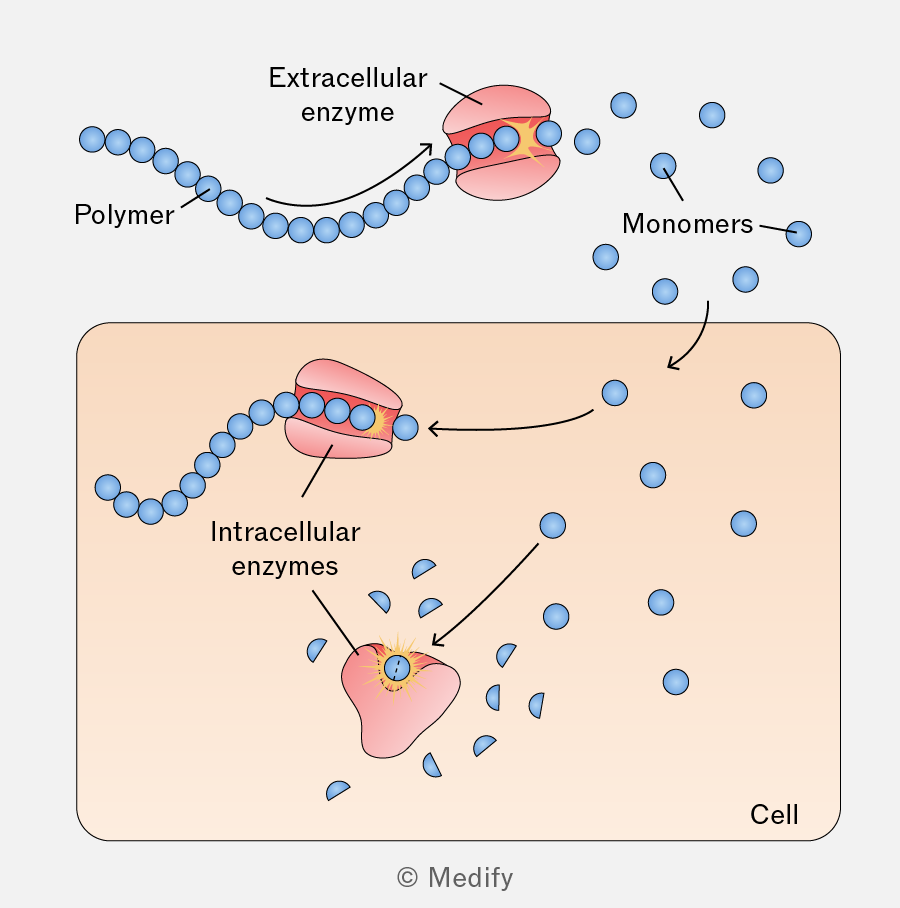
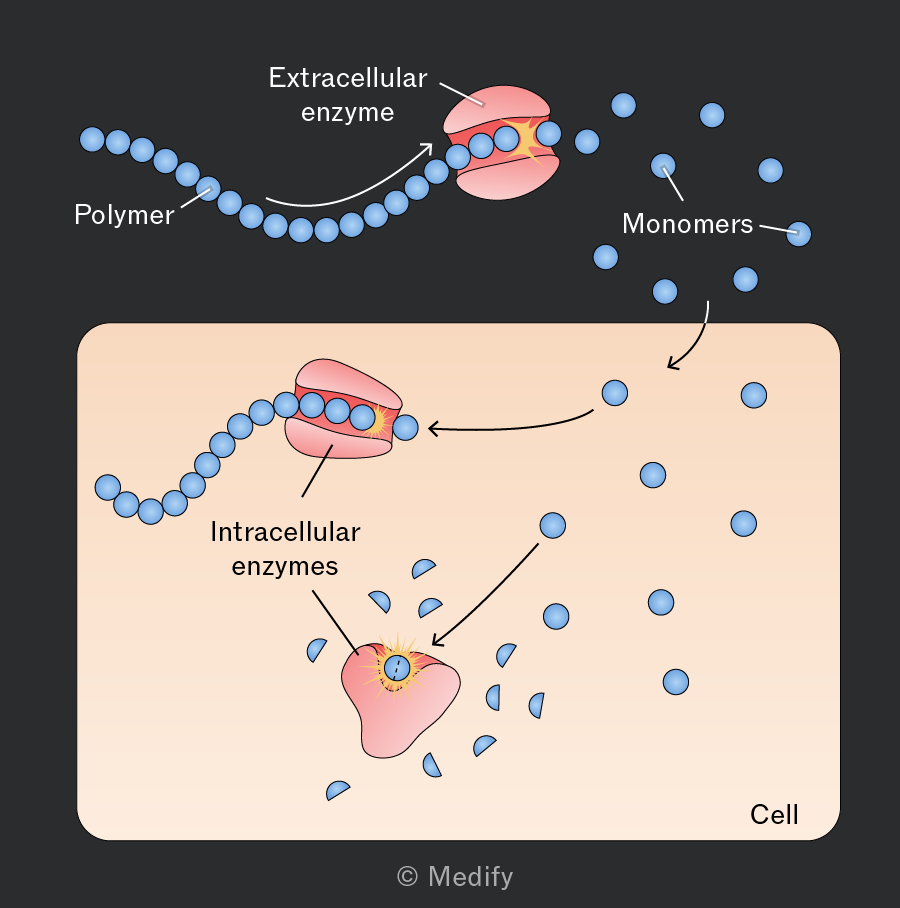
Enzymes are essential for various biochemical processes and can function both inside cells (intracellular) and outside cells (extracellular).
Intracellular enzymes function within cells, catalysing numerous metabolic processes essential for cell survival and function.
Catalase is an example of an intracellular enzyme and is found in nearly all living organisms that respire aerobically. It decomposes hydrogen peroxide, a harmful byproduct of aerobic metabolism, into water and oxygen:
Extracellular enzymes are secreted by cells to function outside of the cell. They play crucial roles in digestion, where large nutrient molecules need to be broken down or modified outside the cell.
For example, amylase is an enzyme produced by cells in the salivary glands and pancreas. When released into saliva, it catalyses the hydrolysis of starch (a polysaccharide) into maltose (a disaccharide).
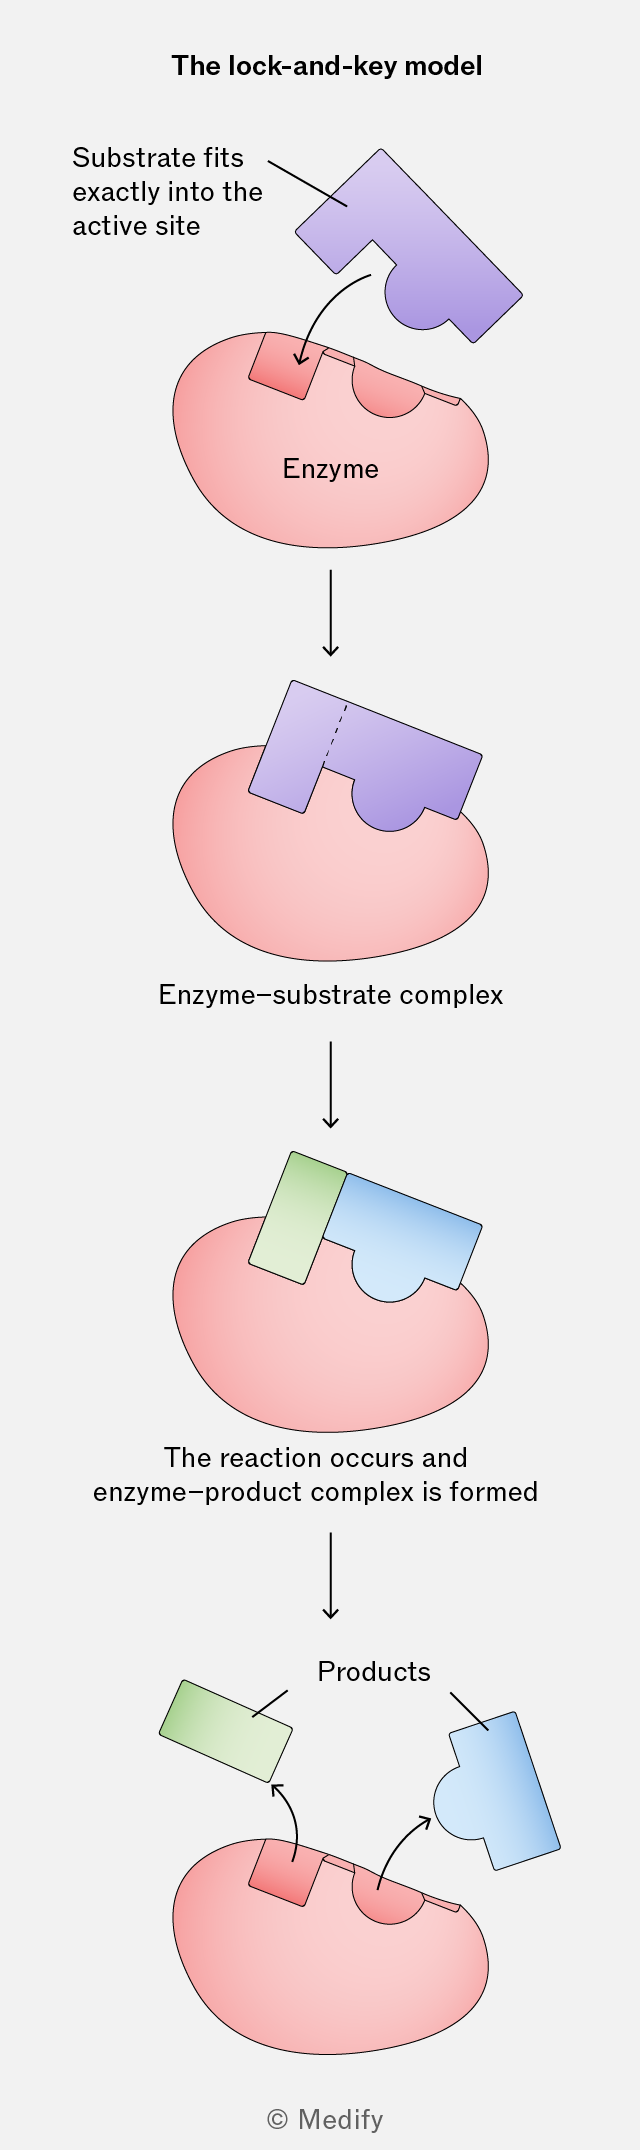
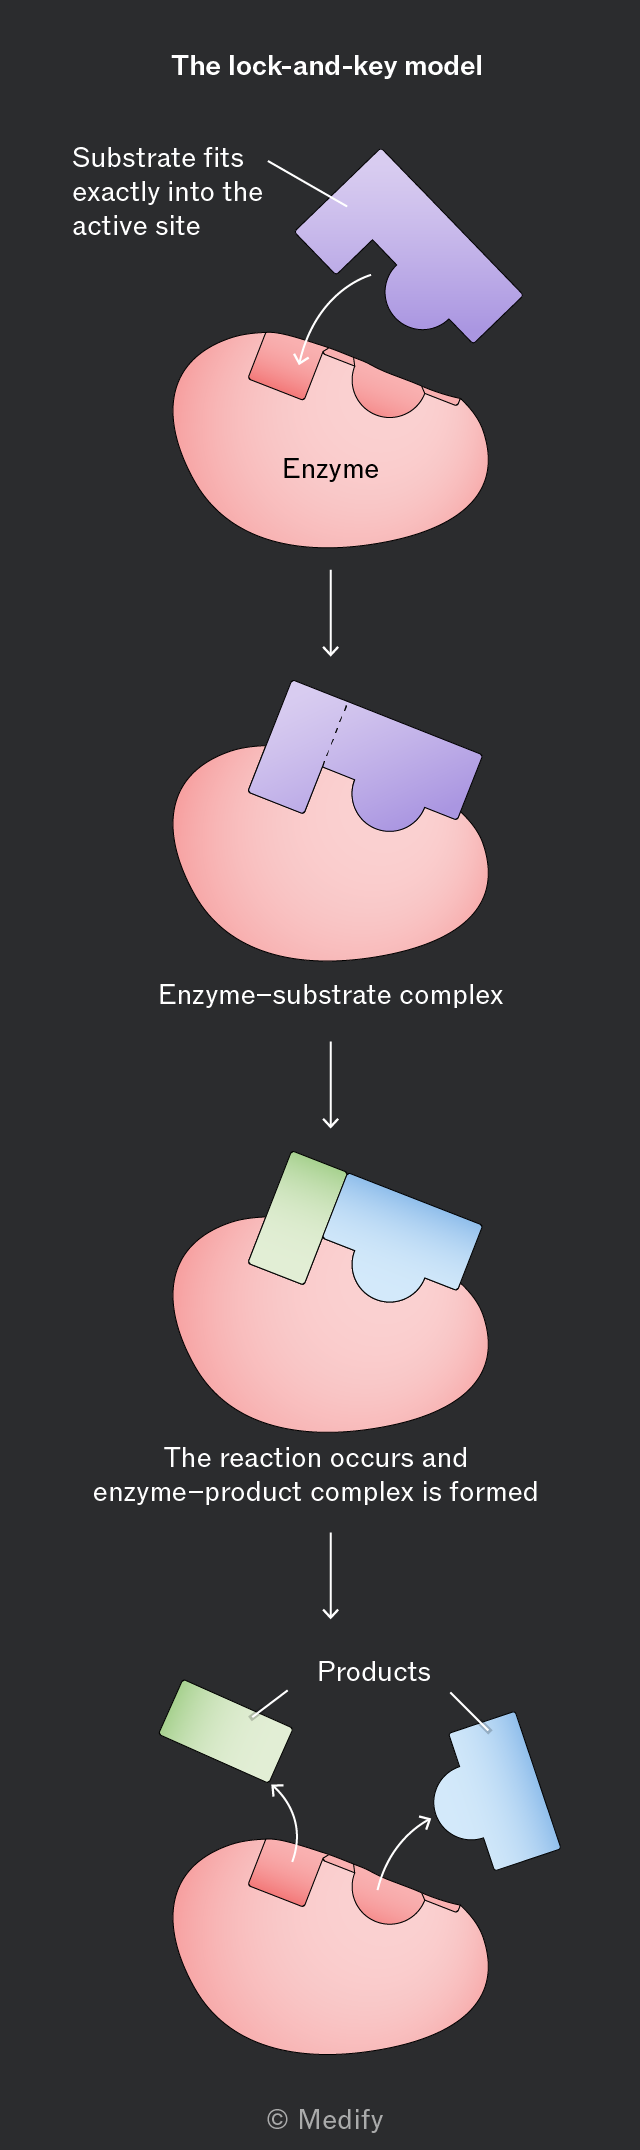
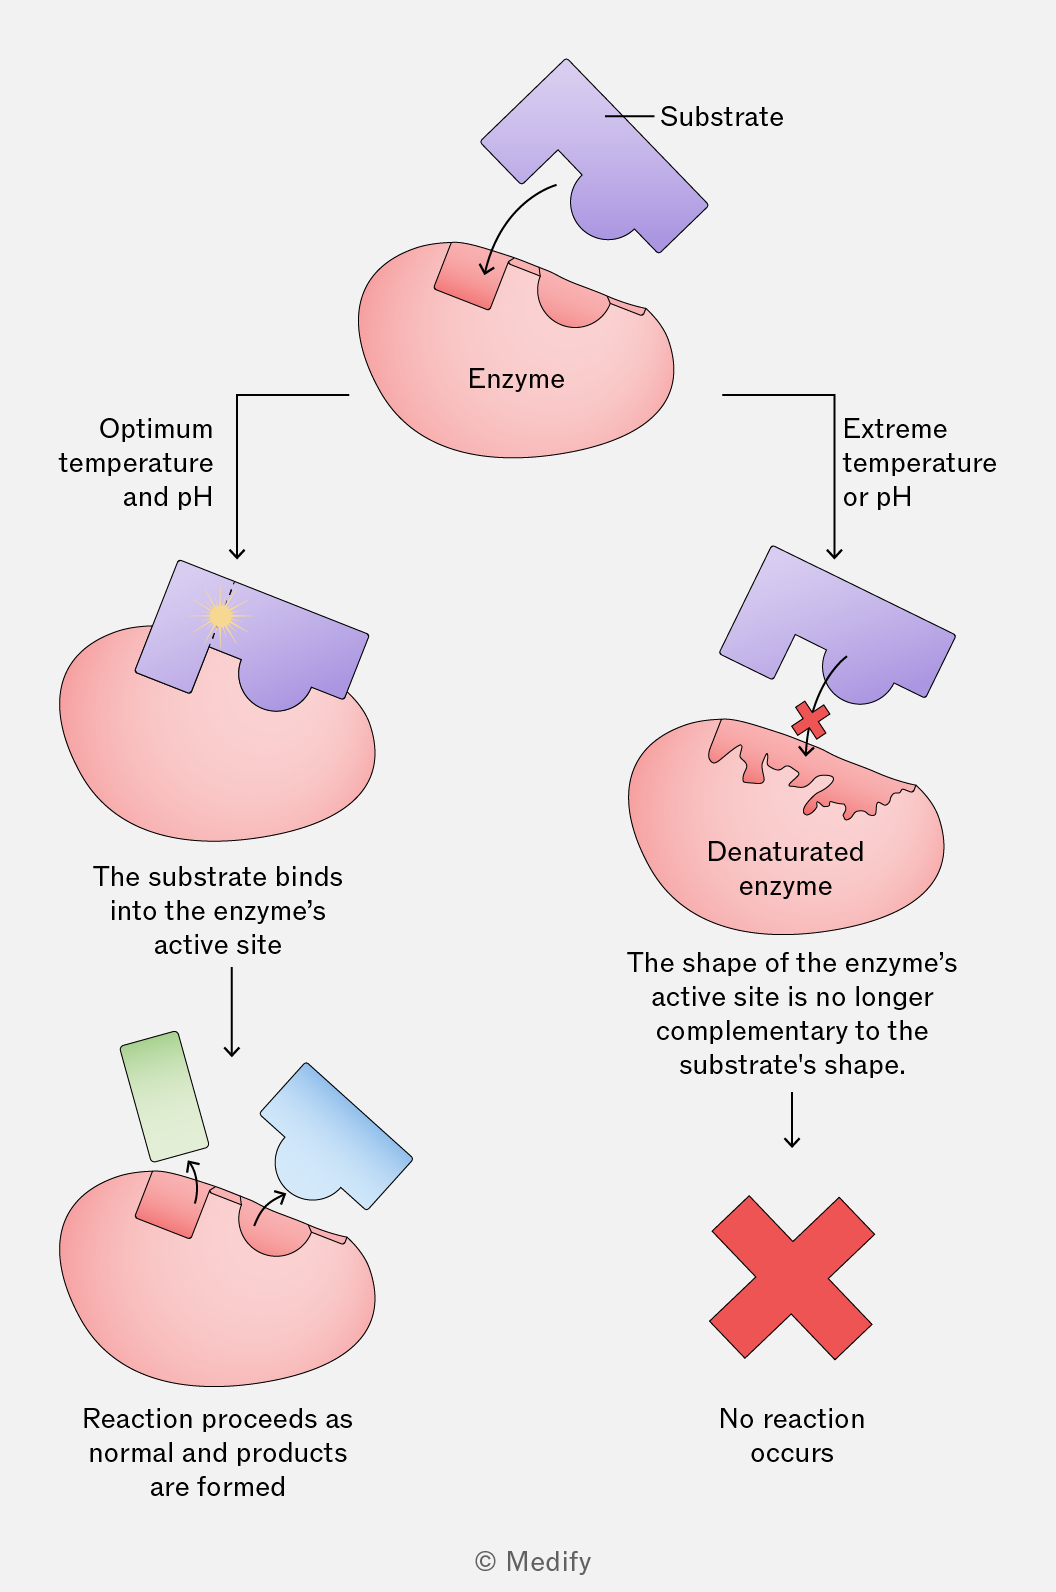
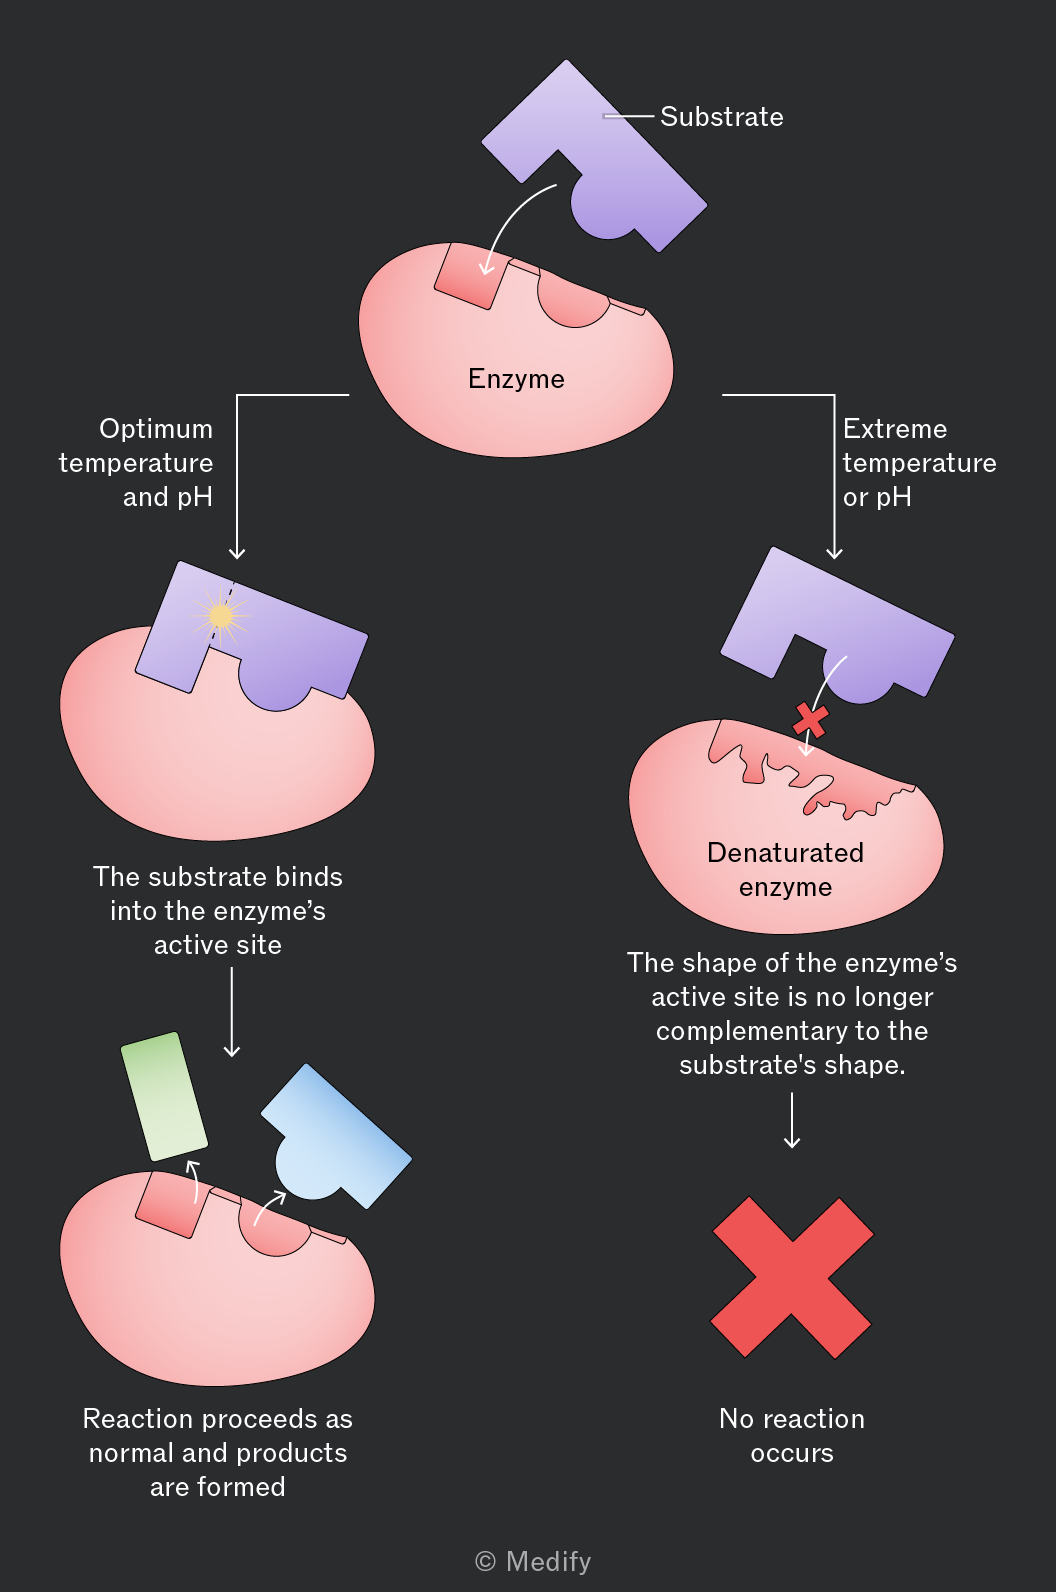
Enzymes are globular proteins with a specific tertiary (3-dimensional) structure. An area within this structure, called the enzyme’s active site, is where substrates bind, forming an enzyme–substrate complex.
The shape of an enzyme’s active site is complementary to the substrate(s) involved in the specific reaction it catalyses.
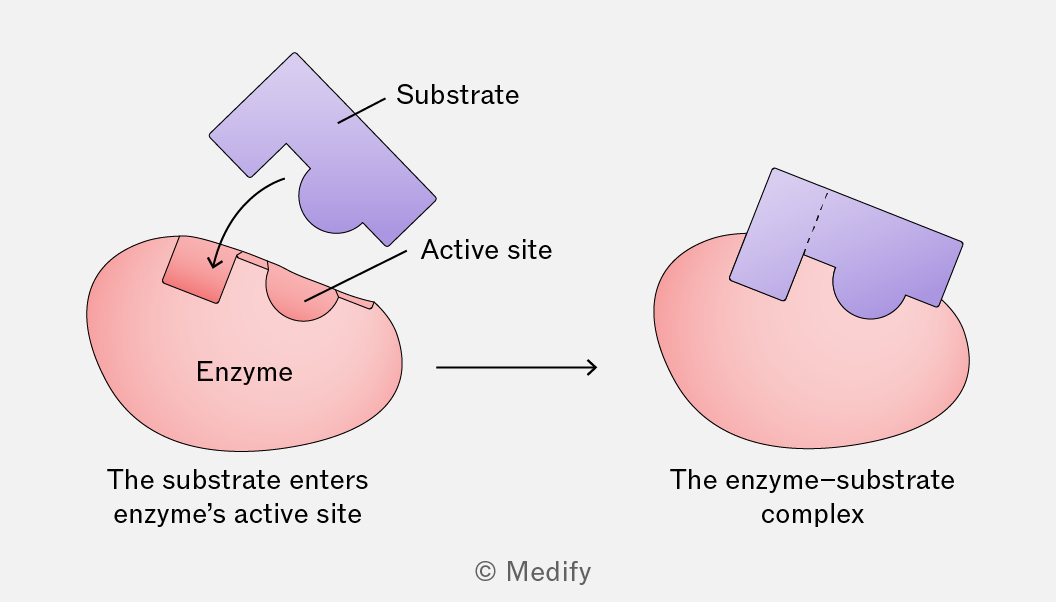
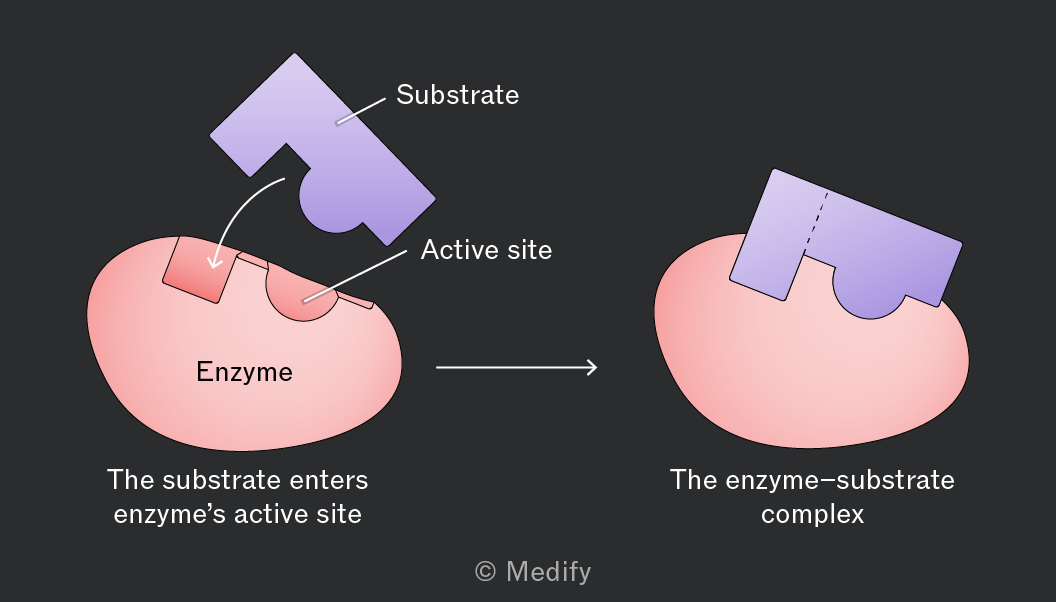
The lock-and-key hypothesis of enzyme action suggests that a substrate fits into the rigid structure of an enzyme’s active site precisely, in the same way a specific key fits into its corresponding lock.
When an enzyme and its substrate collide, the side chains of amino acids (R groups) within the enzyme’s active site form temporary bonds with the substrate. This results in the formation of an enzyme–substrate complex.
The enzyme catalyses the reaction, and the products are formed in an enzyme–product complex. The enzyme then releases the products and is left unchanged, ready to be reused.
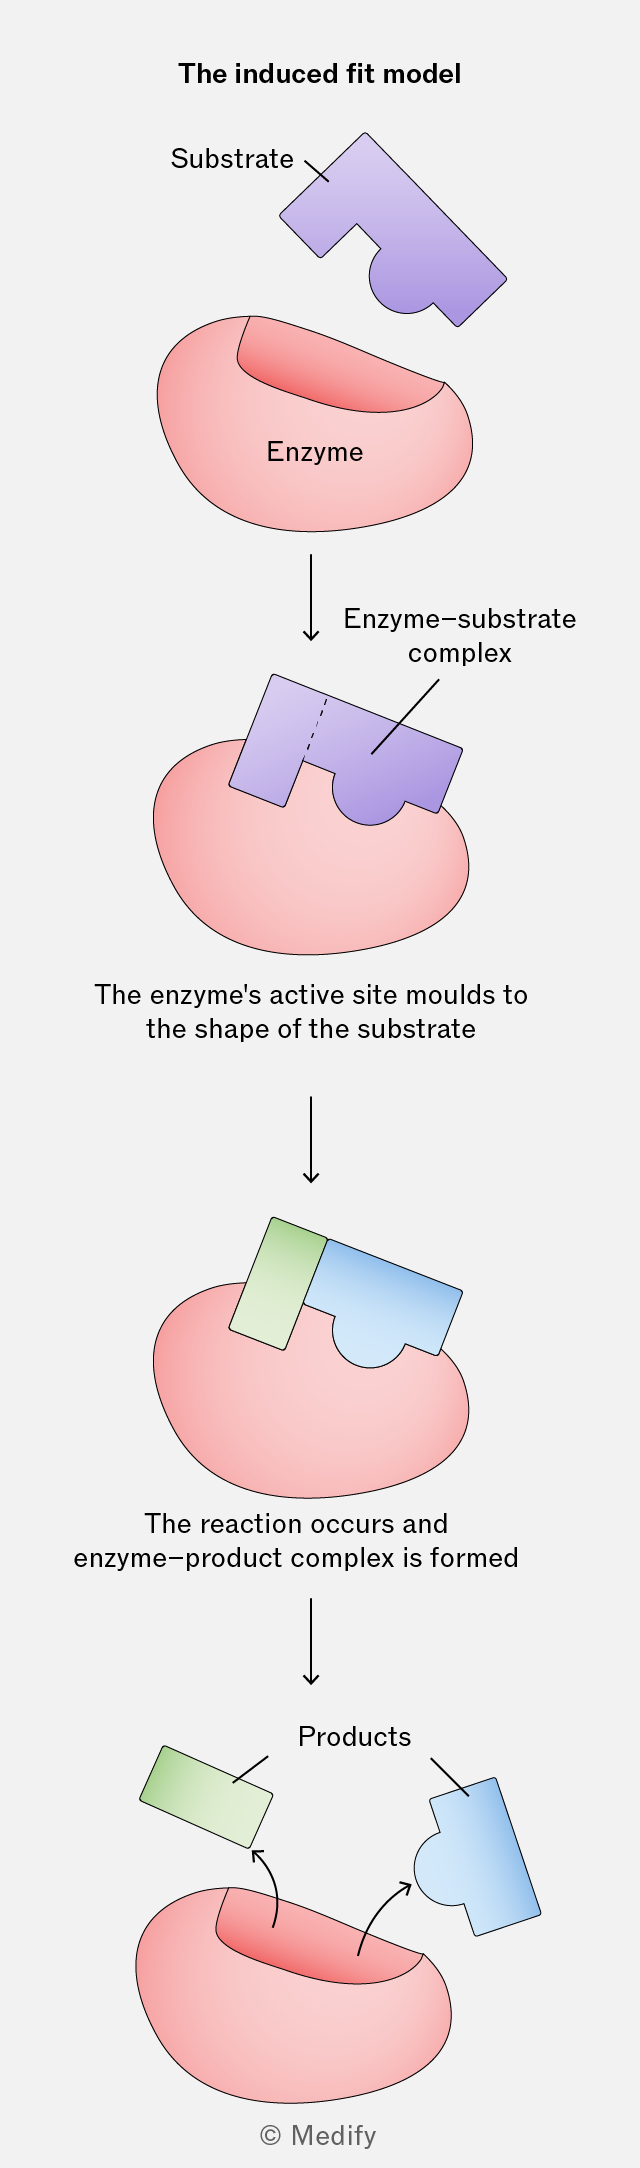
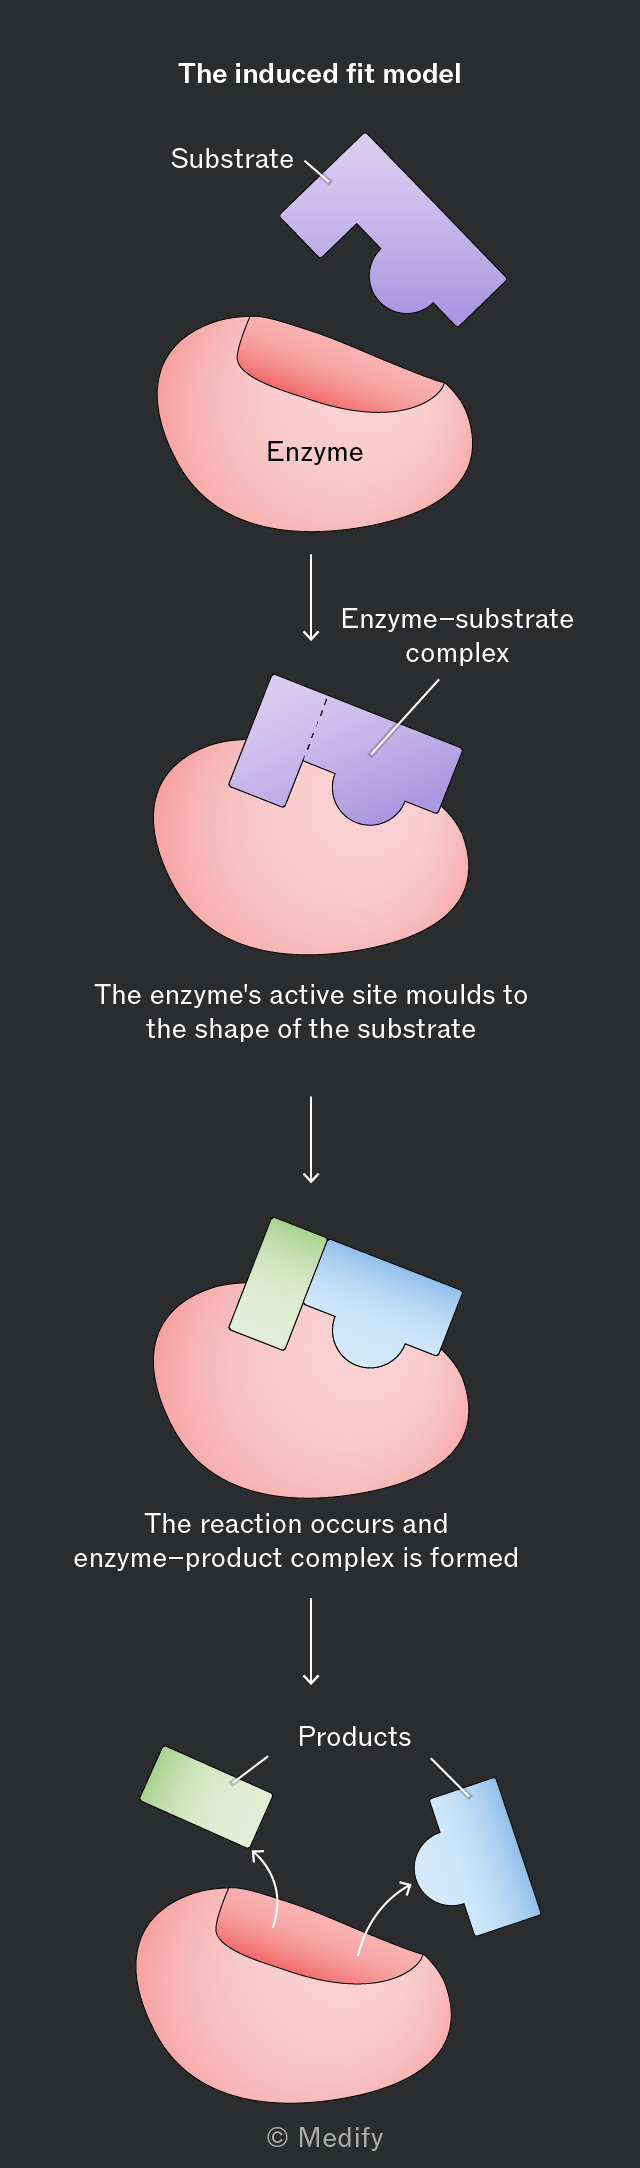
The induced fit model of enzyme action suggests that enzymes are flexible and can change shape in the presence of a substrate. These changes in shape are known as conformational changes.
As an enzyme and substrate collide, the side chains of amino acids (R groups) within the enzyme’s active site form temporary bonds with the substrate. These weak interactions induce a change in the enzyme’s tertiary structure, strengthening the binding in the enzyme–substrate complex. This strains the bonds in the substrate making them easier to break (lowering the activation energy required for the reaction).
The products are formed within an enzyme–product complex and are then released. The enzyme returns to its original shape, ready to be reused.
The progress of enzyme-catalysed reactions can be investigated by:
- Measuring the rate of product formation
- Measuring the rate of substrate disappearance.
The rate of an enzyme-catalysed reaction can be measured from a graph of the amount of product formed or substrate used through time.
The gradient of the curve at any given point is equal to the rate of the reaction (units are always ‘per unit time’). This changes over time if the relationship is curved.
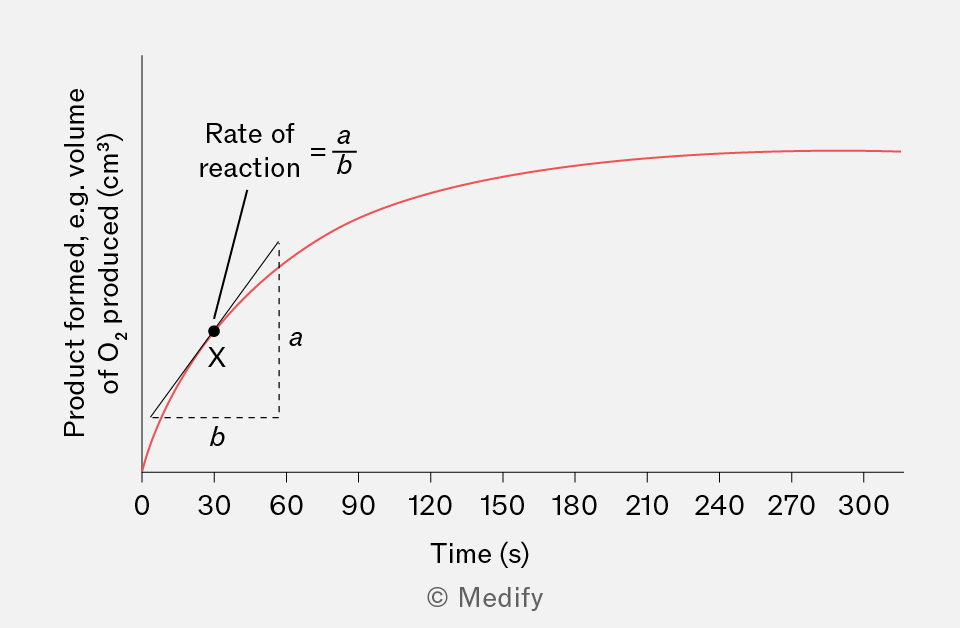
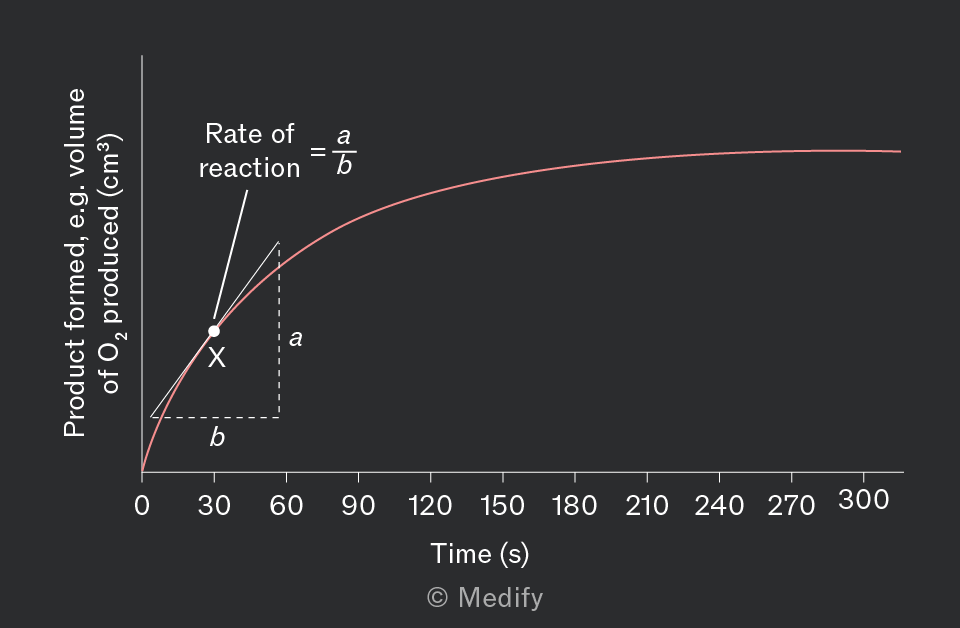
The maximum rate of a reaction is . This is when the maximum number of enzyme–substrate complexes have formed.
can be increased by increasing the enzyme concentration or increasing the temperature of the reaction.
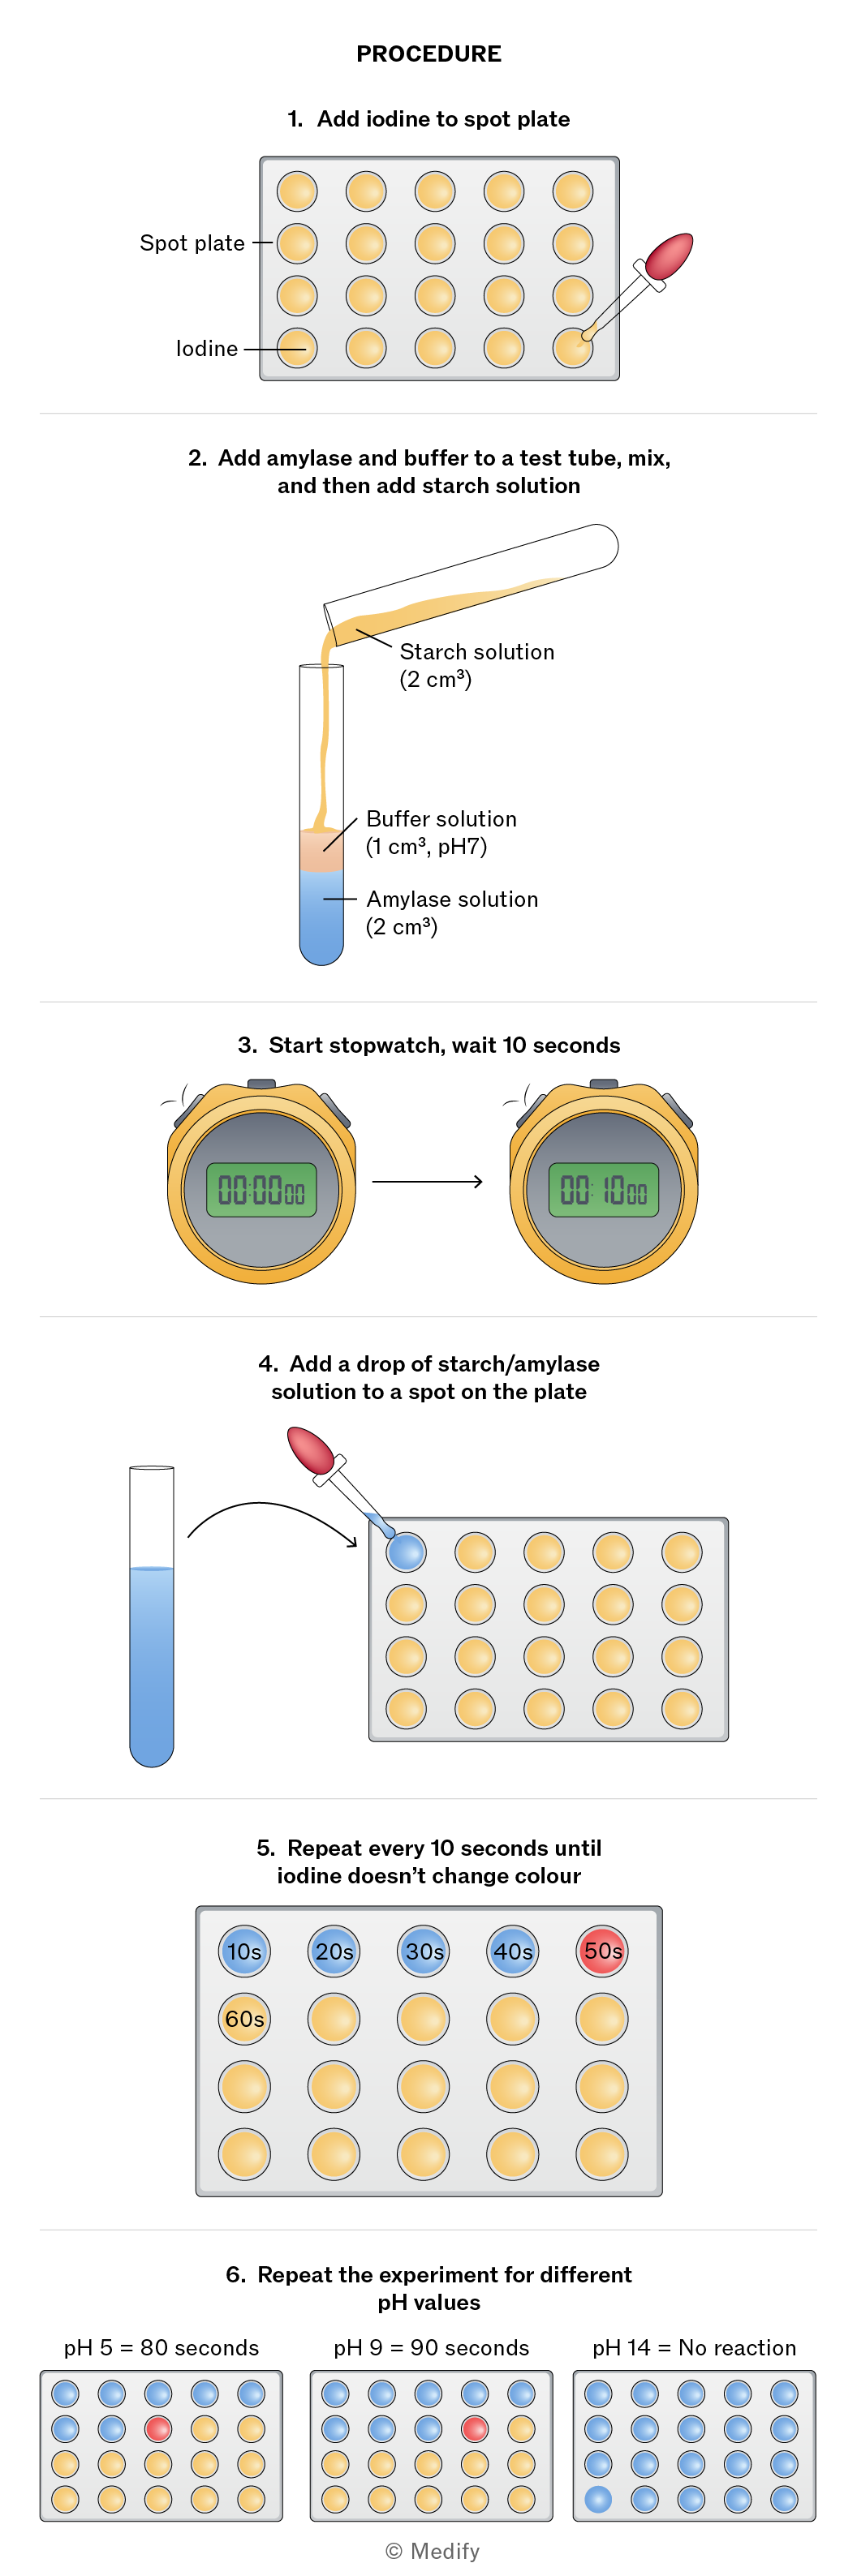
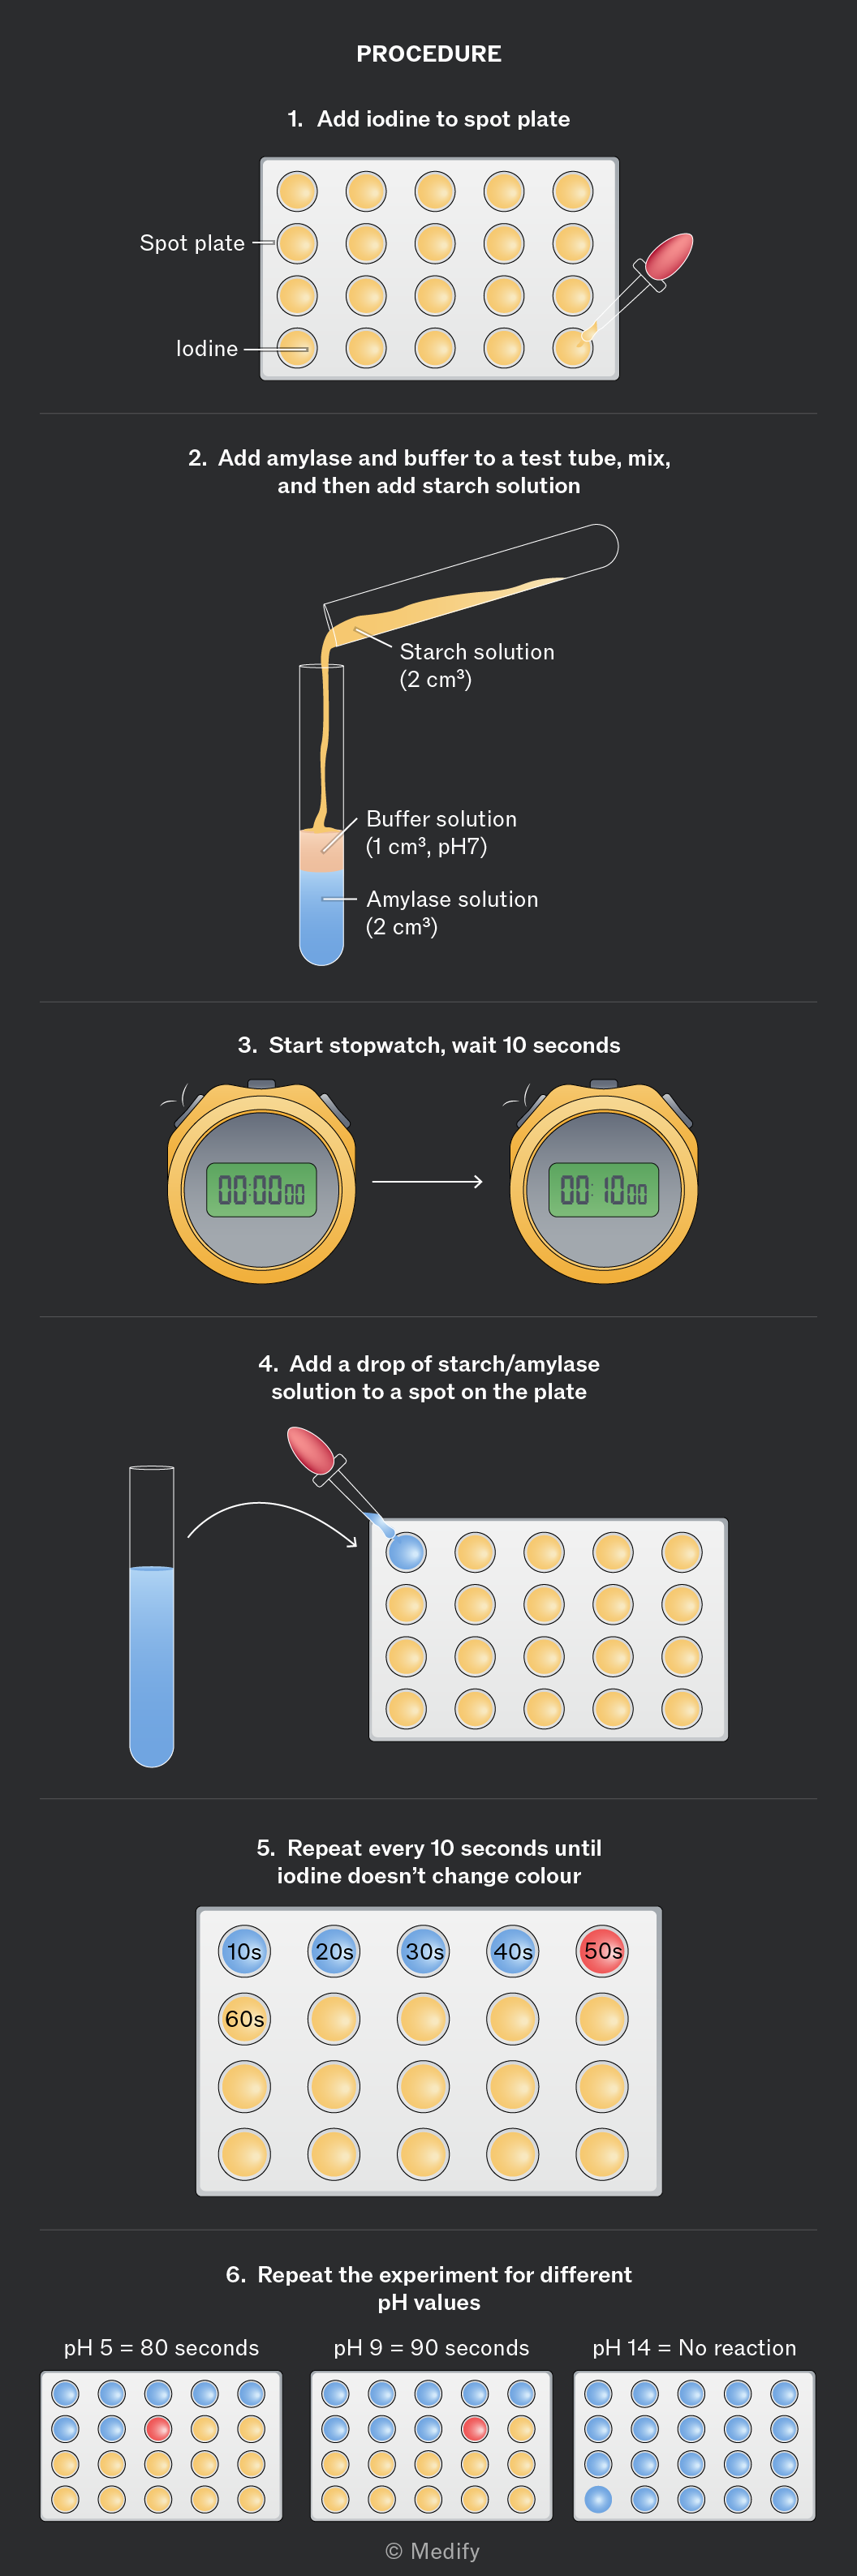
To investigate the effect of pH on enzyme activity, we can use the enzyme amylase to break down starch into maltose. The progress of the reaction is monitored using iodine as an indicator (iodine = yellow-brown; starch + iodine = blue-black).
Buffer solutions have a specific pH and maintain it, even if the reaction taking place would otherwise cause the pH of the reaction mixture to change.
Experimental procedure:
- Place drops of iodine indicator solution (potassium iodide) into the wells of a spot plate.
- Label a test tube with the buffer solution being used (pH levels to be tested).
- Add of amylase solution to each test tube.
- Add of the buffer solution to the amylase using a syringe.
- Add of starch solution to the mixture, start the stopwatch, and mix.
- Every 10 seconds, place a drop of the mixture onto a drop of iodine indicator solution on the spot plate.
- Note the time when the iodine indicator no longer turns blue-black, suggesting that the starch has completely broken down. The faster the iodine indicator stops turning blue-black, the more effective the enzyme is at that pH.
- Repeat for different buffer solutions (pH values).
Enzymes work best at their optimum pH (concentration of ions). Reactions will slow as the pH is increased or decreased away from the optimum.
ions interact with the hydrogen and ionic bonds forming an enzyme’s tertiary structure. Outside the enzyme’s optimal pH ([] is too high or too low), they can disrupt this bonding, altering the shape of the enzyme and its active site. When the shape of the active site is no longer complementary to the substrate, the enzyme is denatured, and it cannot function.
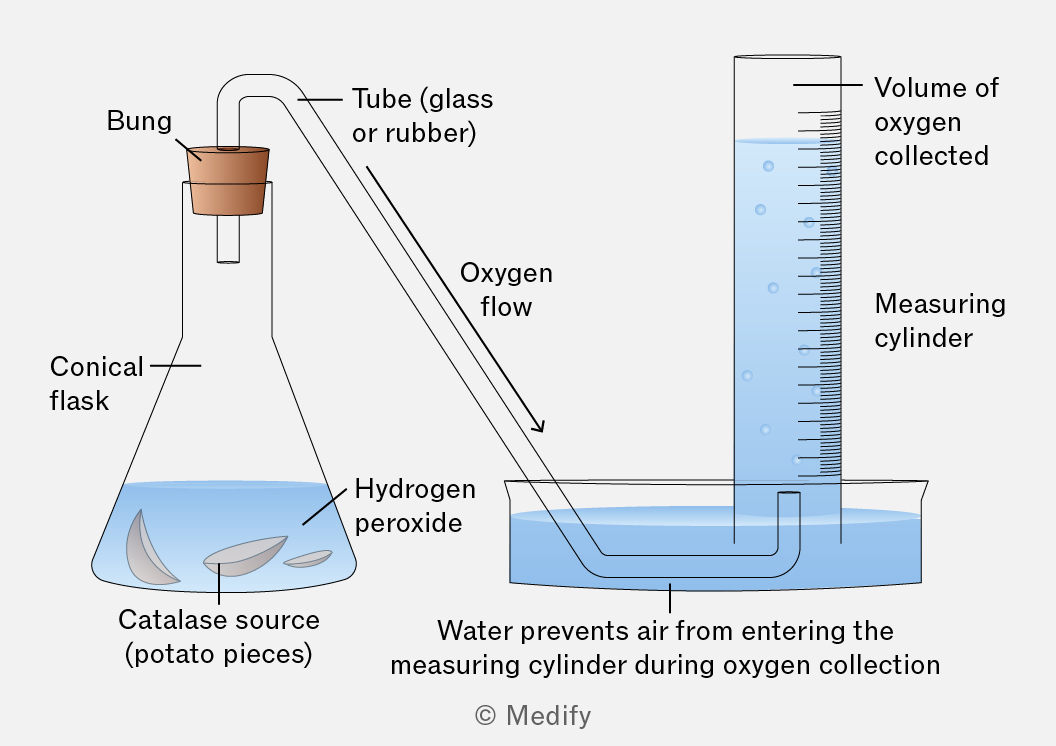
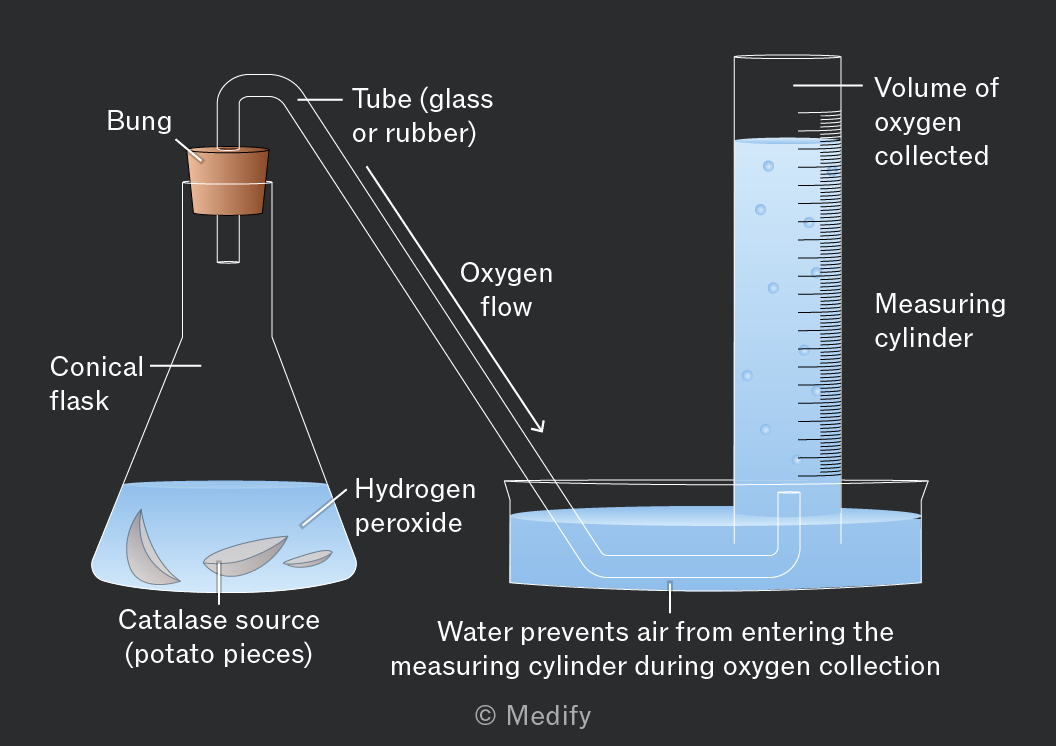
To investigate the effect of temperature on enzyme activity, we can use the enzyme catalase which breaks down hydrogen peroxide into water and oxygen.
Experimental procedure:
- Cut a set weight of raw potato.
- Set up the equipment, as shown below.
- Add the potato to the hydrogen peroxide, start the timer, and mix.
- Record the volume of oxygen produced every 10 seconds.
Repeat this procedure with the same weight of potato that has been boiled for 10 minutes.
Temperature affects the speed at which molecules move and, therefore, the rate at which enzyme and substrate molecules collide.
Enzymes have an optimum temperature, where they catalyse reactions fastest. This is the temperature at which the maximum number of enzyme–substrate complexes form.
At low temperatures, molecules have less kinetic energy and move more slowly. This leads to fewer successful collisions between enzymes and substrates. As a result, fewer enzyme–substrate complexes form and the reaction rate is slower.
Higher temperatures provide more kinetic energy. This results in more frequent and successful collisions between enzymes and substrates, accelerating the reaction.
Beyond the optimum temperature, too much kinetic energy breaks the hydrogen and ionic bonds that maintain the enzyme’s tertiary structure and shape the active site. The enzyme is said to be denatured. If the enzyme cannot bind the substrate, it cannot catalyse the reaction and the reaction rate drops sharply.
Denaturation is often irreversible.
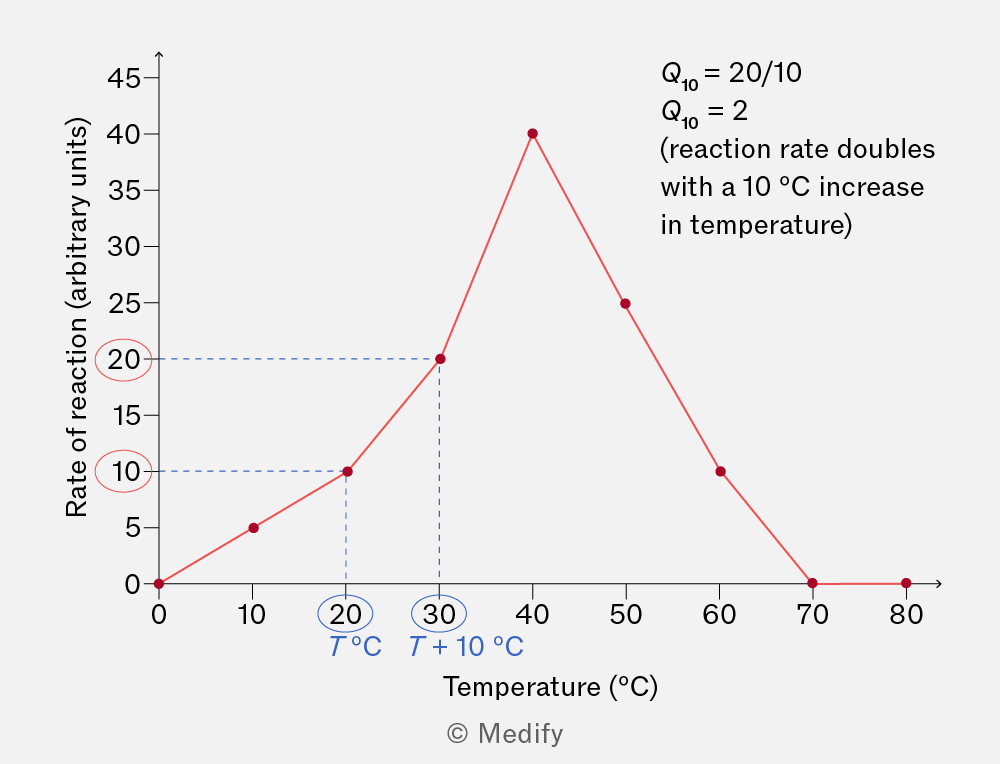
The temperature coefficient is a measure of the change in the rate of a reaction after increasing the temperature by .
is calculated using the formula:
where:
is the initial temperature.
For most enzyme-catalysed reactions, values typically range between 2 and 3. This means the rate of reaction roughly doubles or triples with every rise in temperature.
The relationship does not apply outside of an enzyme’s optimum temperature range.
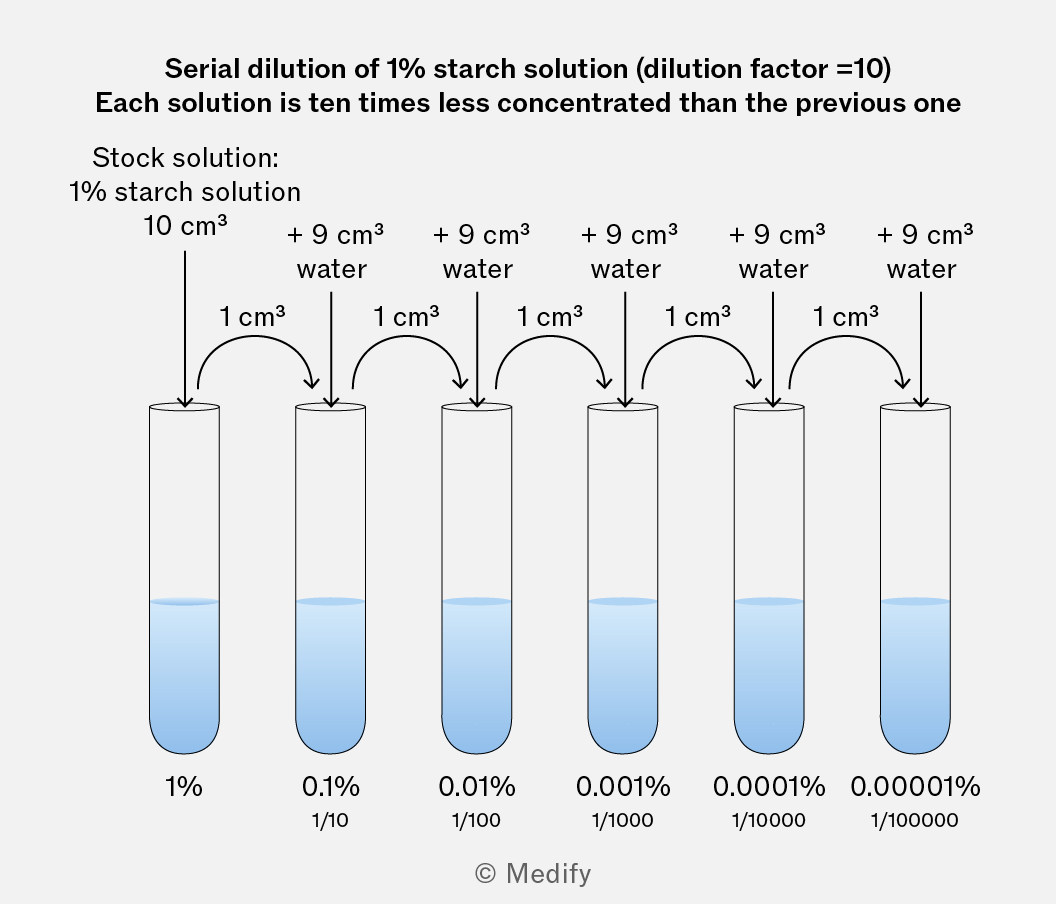
Serial dilutions are useful for testing the impact of substrate or enzyme concentration on reaction rate. This dilution technique is used to produce a series of solutions with progressively lower concentrations.
To investigate the effect of substrate concentration on enzyme activity, we can use the enzyme catalase, which breaks down hydrogen peroxide (the substrate) into water and oxygen.
Experimental procedure:
- Prepare test tubes containing different concentrations of hydrogen peroxide.
- Set up the experiment with a conical flask fitted with a bung and glass tube leading to an upturned measuring cylinder filled with water.
- Place the source of catalase into the conical flask.
- Pour in one of the test tubes of hydrogen peroxide, start a timer, and mix.
- Record the volume of oxygen produced every 10 seconds.
Repeat the above procedure for all concentrations of hydrogen peroxide, recording your results.
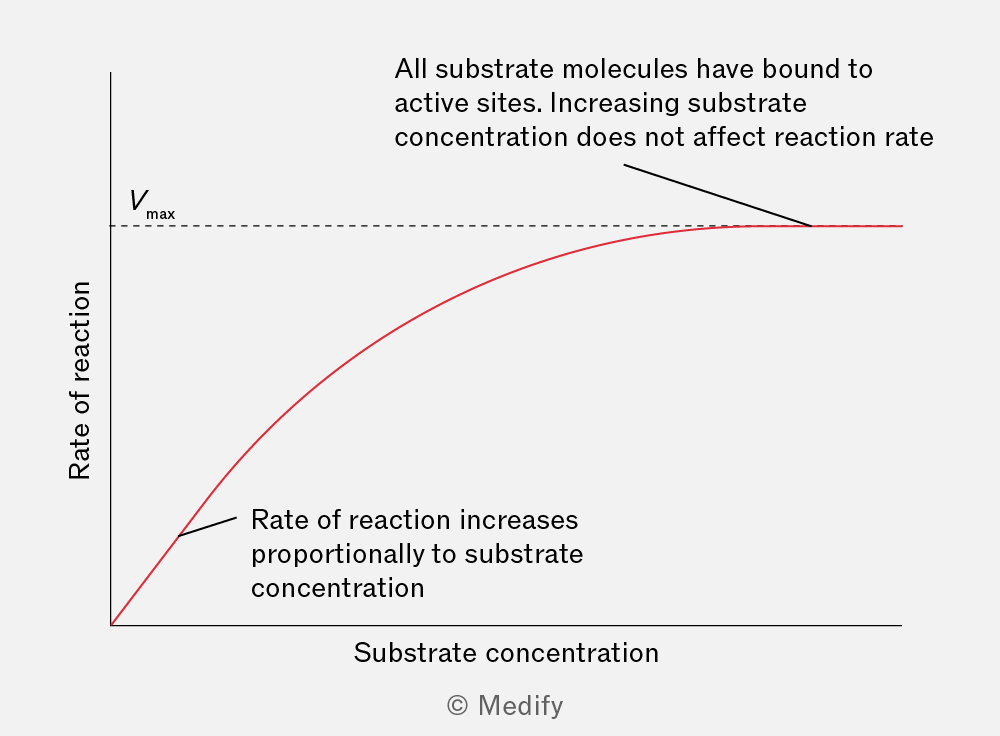
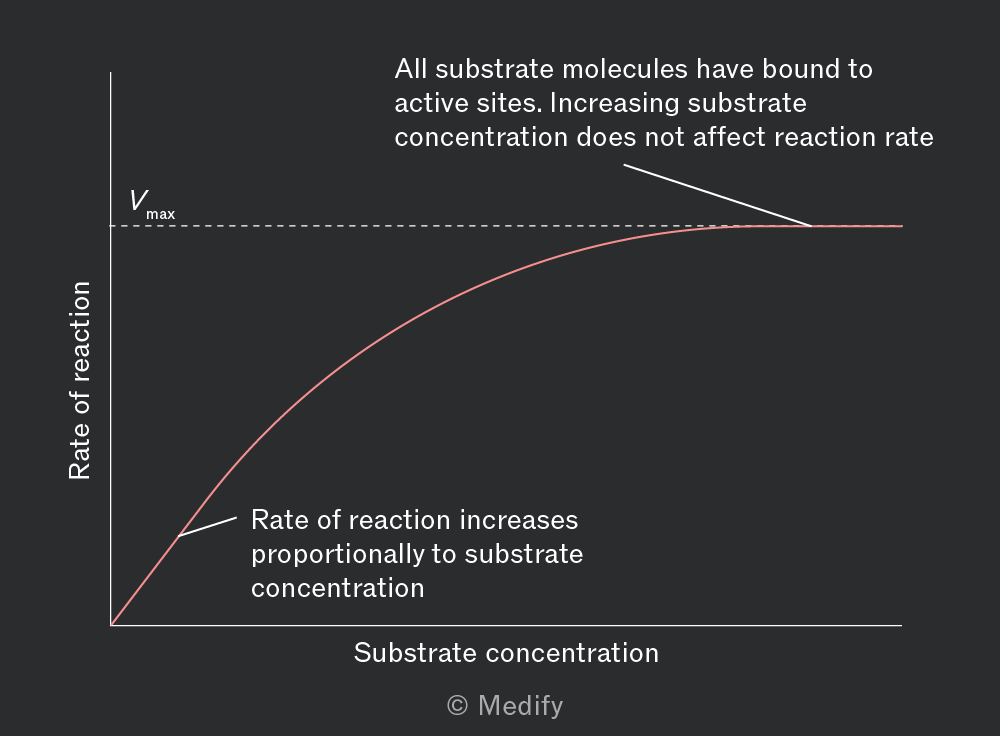
Initially, increasing substrate concentration increases the rate of reaction. With more substrate molecules present, the chance of forming enzyme–substrate complexes increases.
The rate of reaction subsequently plateaus as all active sites become saturated. The rate of reaction reaches its maximum . Beyond this point, further increase in substrate concentration will not increase the reaction rate, as there are no free active sites for additional substrate molecules to bind to. The enzyme concentration becomes the limiting factor in the reaction.
To investigate the effect of enzyme concentration on enzyme activity, we can use the enzyme catalase which breaks down hydrogen peroxide into water and oxygen.
Experimental procedure:
- Prepare test tubes containing different concentrations of catalase (serially diluted solutions containing a ground down catalase source, such as potato).
- Set up the experiment with a conical flask fit with a bung and glass tube leading to an upturned measuring cylinder filled with water.
- Pour hydrogen peroxide into the conical flask.
- Pour in one of the test tubes of catalase solution, start a timer, and mix.
- Record the volume of oxygen produced every 10 seconds.
Repeat the above procedure for all concentrations of catalase, recording your results.
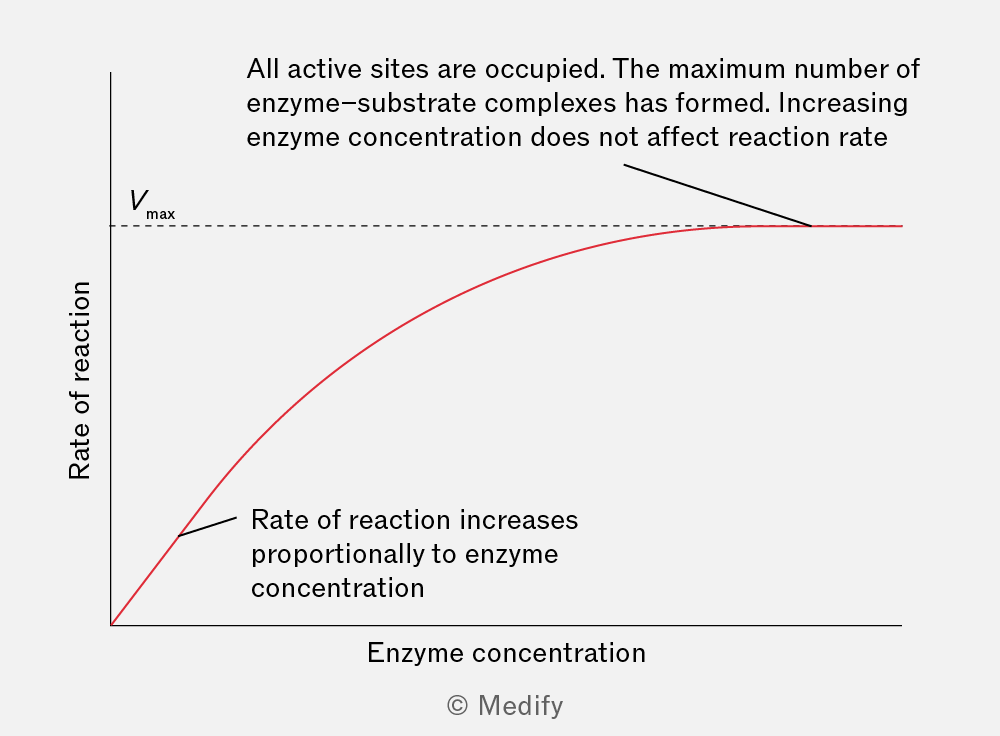
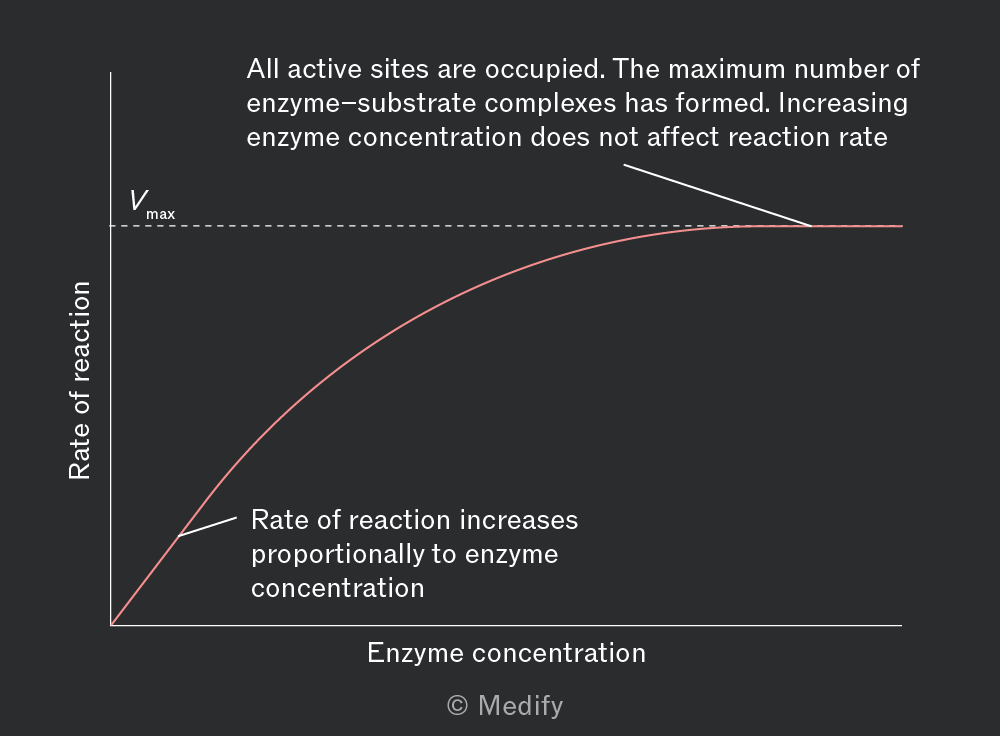
Initially, increasing enzyme concentration increases the rate of reaction because there are more active sites available to form enzyme–substrate complexes. With ample substrate available, the initial reaction rate increases linearly with enzyme concentration.
If the substrate is limited, increasing the enzyme concentration further will not increase the reaction rate, because substrate availability becomes the limiting factor. The reaction rate will have reached
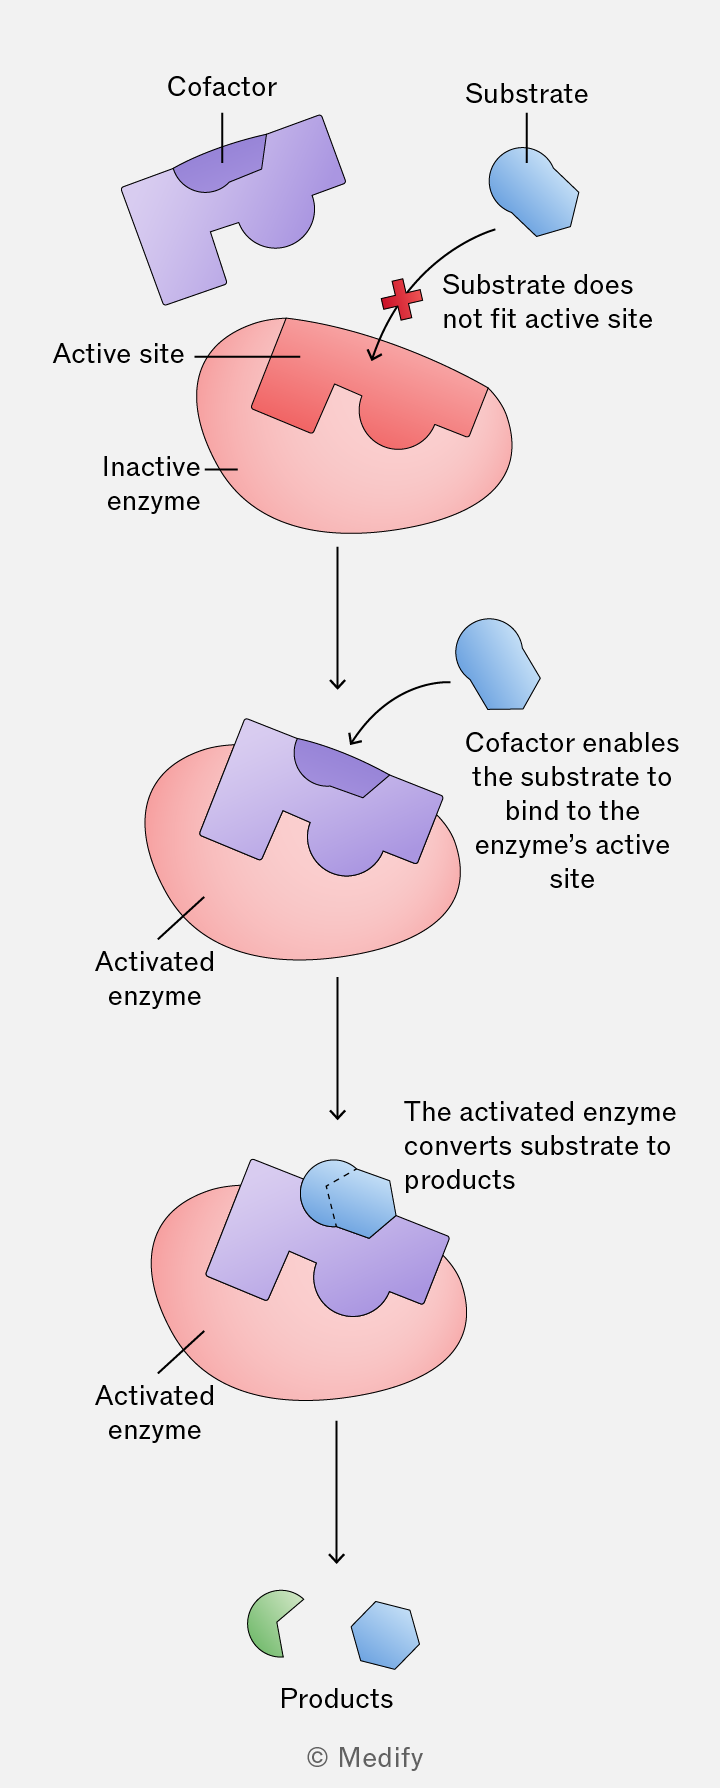
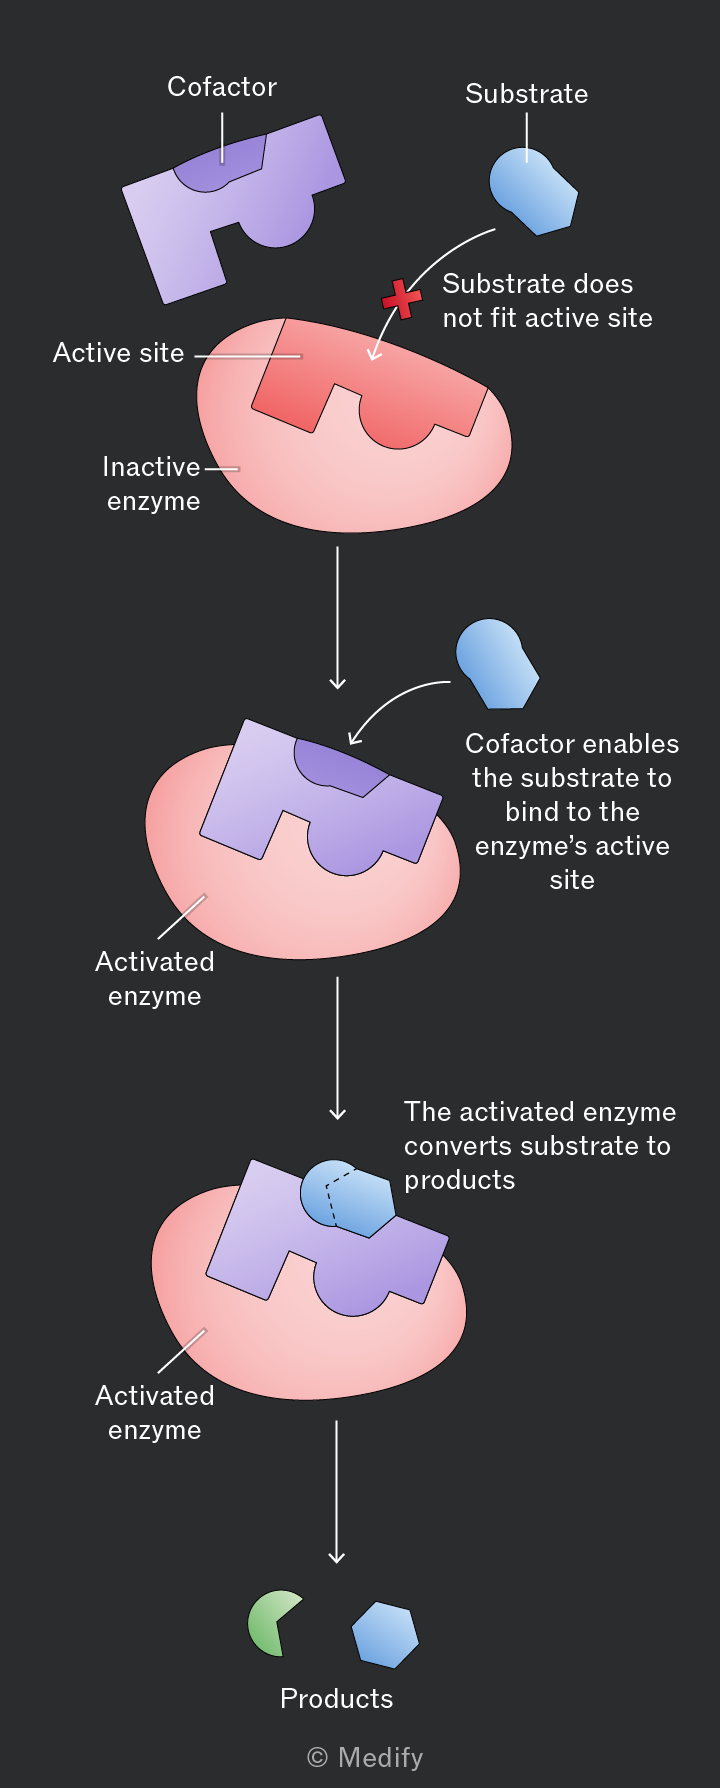
Some enzymes require a non-protein component to function. A cofactor can temporarily bind to an enzyme, altering its tertiary structure and the shape of its active site to activate it.
Examples of cofactors include:
- Inorganic ions – metal ions such as , or chloride ions bound to amylase
- Coenzymes – organic molecules that bind temporarily, e.g. NAD, FAD
- Prosthetic groups – organic or inorganic molecules that are tightly bound to the enzyme, e.g. zinc ions bound to carbonic anhydrase in red blood cells
Some cofactors help to stabilise the structure of the enzyme, whereas others take part in the reaction at the active site.
Cofactors can also help bind the substrate to the enzyme and are not changed or used up during the reaction.
Coenzymes are small, organic molecules that help enzymes function by transferring chemical groups or electrons between reactions or by forming part of the active site. Although they are temporarily altered during reactions, they are continuously recycled.
Many coenzymes are derived from vitamins. For example:
- Vitamin B5 (pantothenic acid) is a key component of coenzyme A.
- Vitamin B3 (nicotinic acid) is used to produce the coenzymes NAD and NADP.
- Vitamin B1 (riboflavin) is used to produce the coenzyme FAD.
Inhibitors are molecules which stop enzymes from functioning or slow them down. They can bind to enzymes reversibly or irreversibly. There are two types of inhibitors:
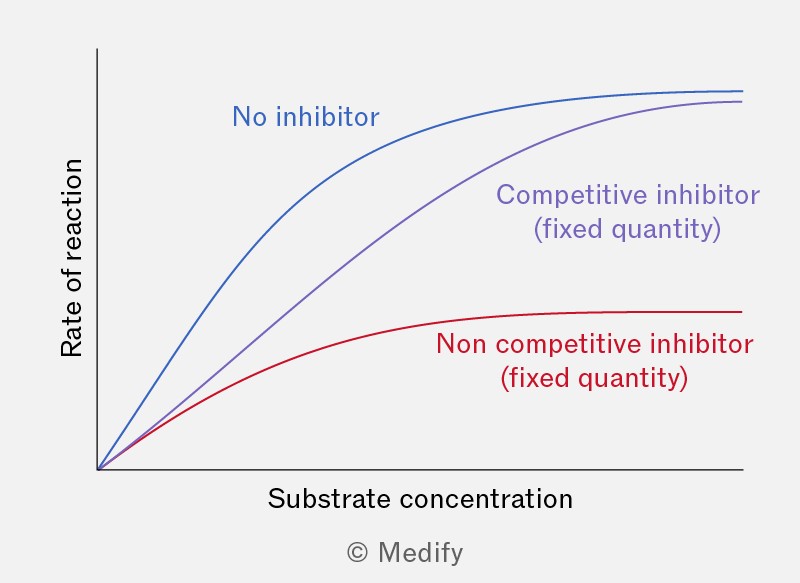
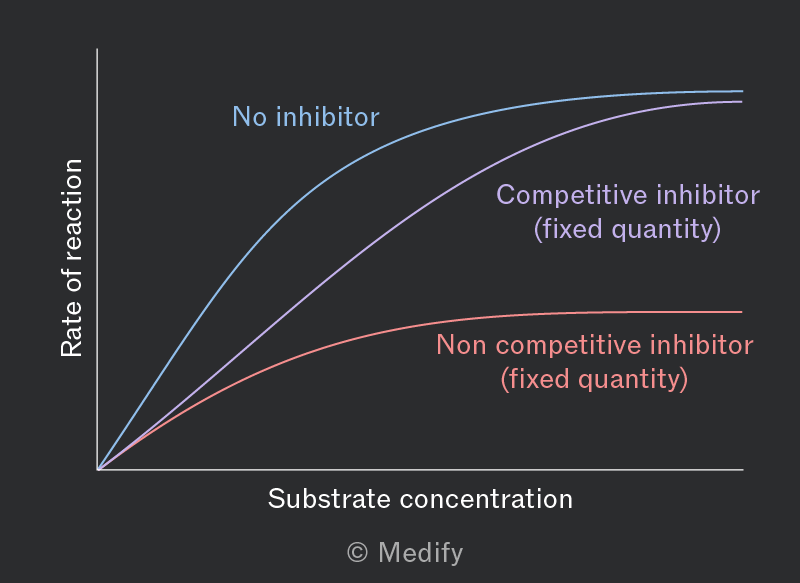
- Competitive inhibitors have a similar shape to the substrate and compete to bind to the enzyme’s active site. By forming enzyme–inhibitor complexes, competitive inhibitors reduce the formation of enzyme–substrate complexes.
- Non-competitive inhibitors bind to the enzyme at an alternative site (or allosteric site), which alters the shape of the active site. This reduces the activity of the enzyme or prevents the substrate from binding.
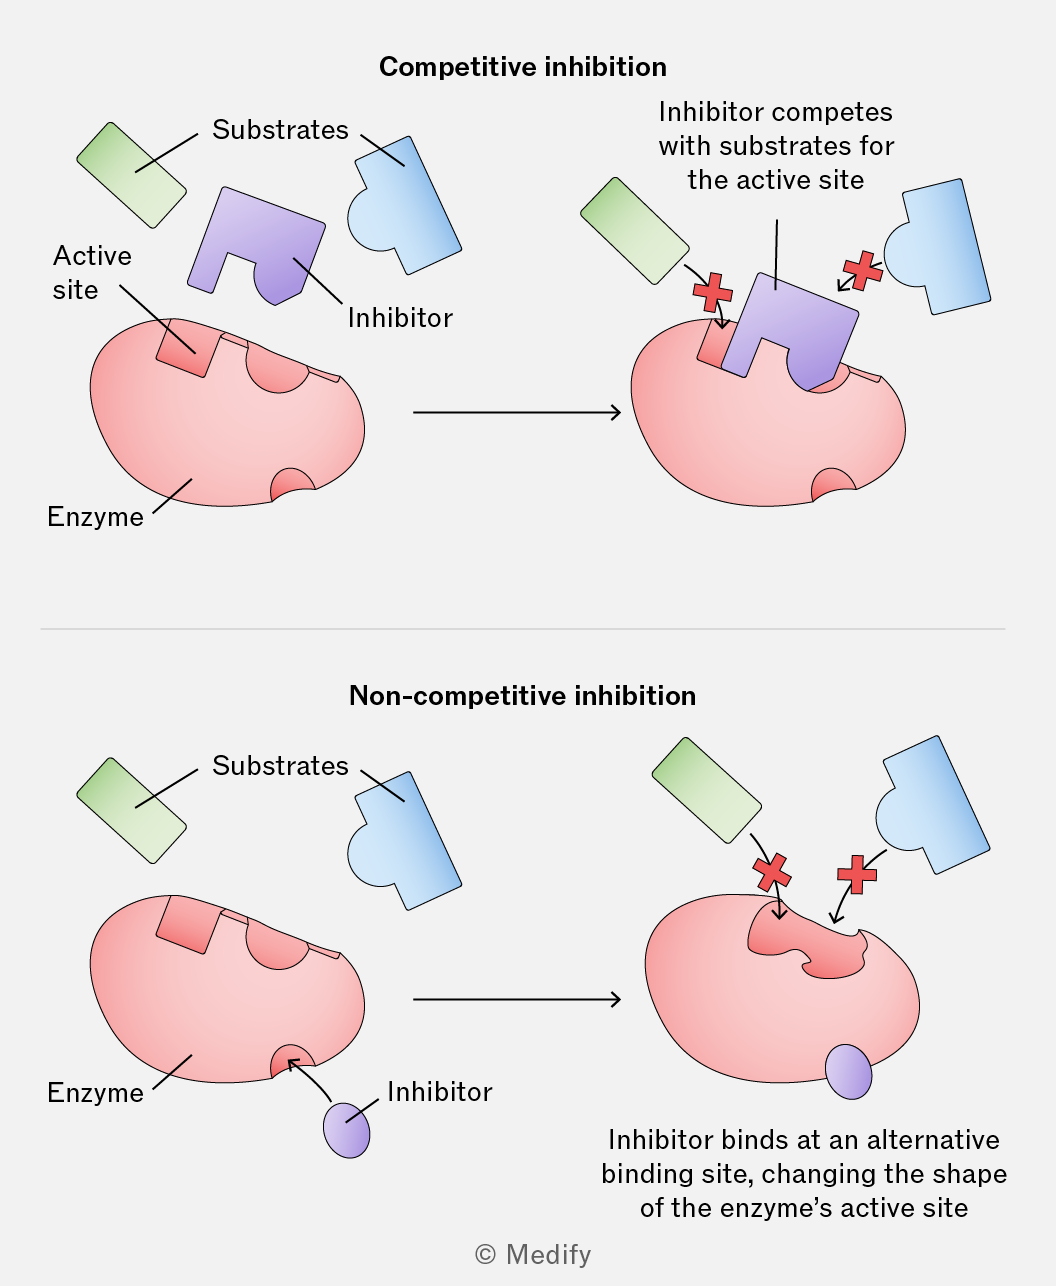
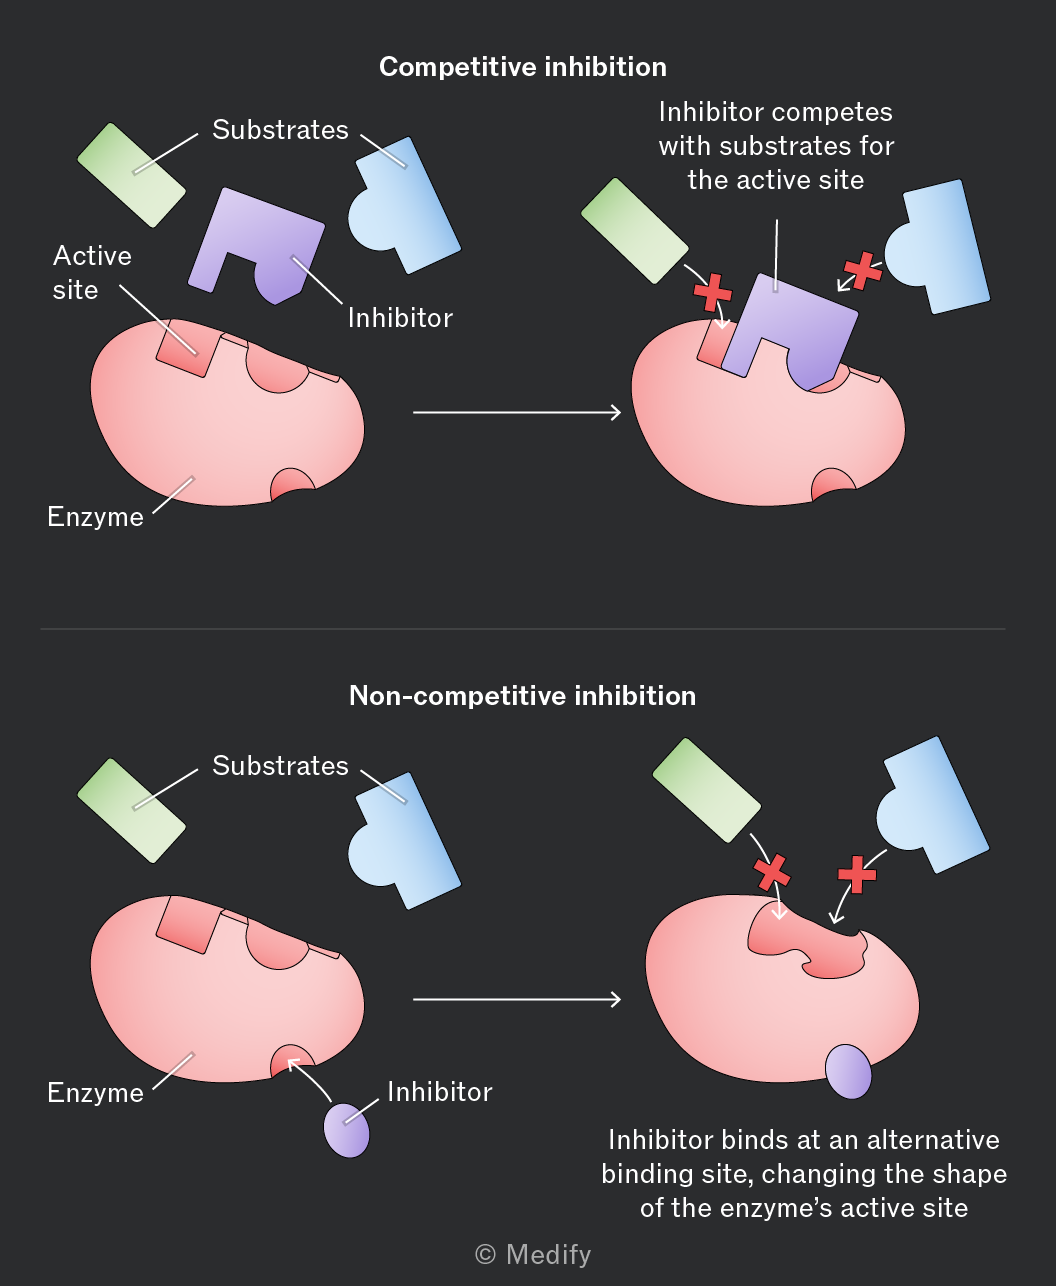
Competitive and non-competitive inhibitors decrease the reaction rate. At sufficiently high inhibitor concentrations, the reaction can cease entirely.
Increasing substrate concentration can counteract the effect of a competitive inhibitor, as more substrate molecules are available to collide with enzymes and form enzyme–substrate complexes.
Increasing substrate concentration does not restore the reaction rate in the presence of a non-competitive inhibitor, since the inhibitor changes the enzyme’s active site, preventing enzyme–substrate complex formation.
Reversible inhibitors can regulate metabolic pathways to ensure reactions are tightly controlled, preventing any single enzyme from producing excessive amounts of a product or using up too many resources.
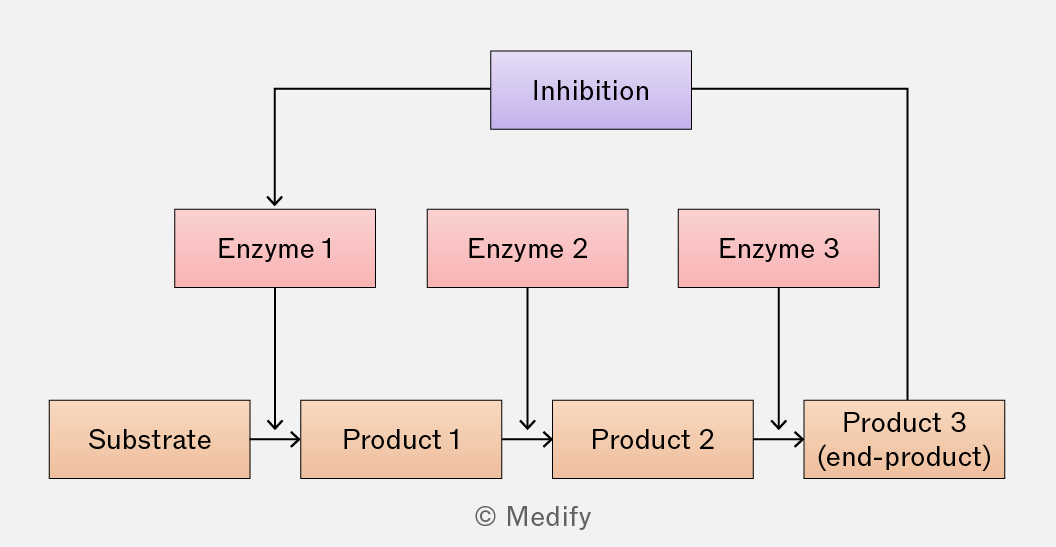
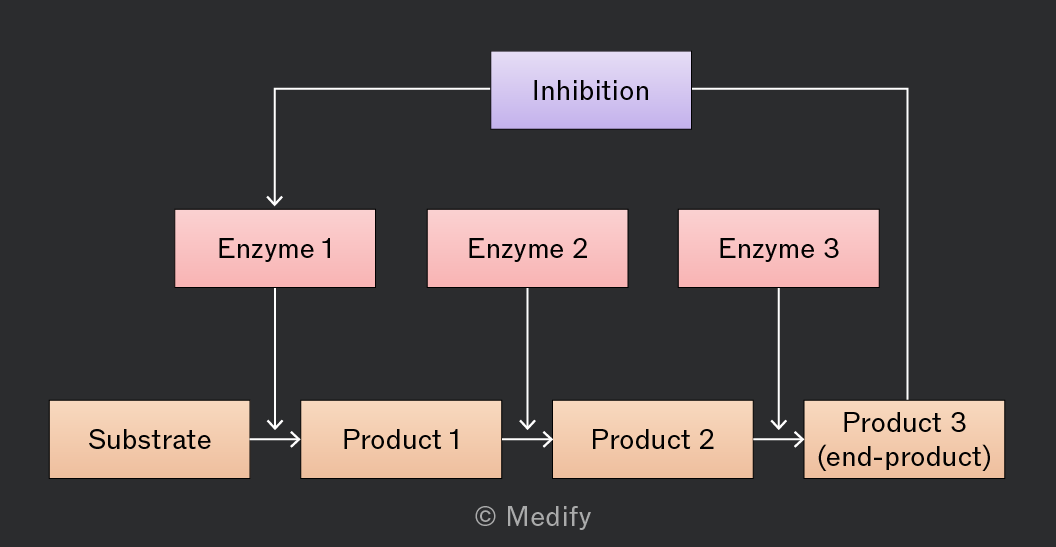
Metabolic pathways can be controlled through end-product inhibition, where the final product of a metabolic pathway acts as a non-competitive, reversible inhibitor.
As the end-product accumulates, it binds to an alternative site on the initial enzyme, altering its active site and reducing or stopping its catalytic activity by decreasing the formation of enzyme–substrate complexes.
If the end-product concentration falls, it detaches from the enzyme, restoring the enzyme’s activity. This feedback loop allows catalysis to resume as product levels decrease.
Irreversible inhibitors bind to an enzyme permanently. In living cells, this results in the complete inactivation of the enzyme, potentially stopping the biological reaction it catalyses.
To restore enzyme activity, a cell must produce more of the inhibited enzyme through gene transcription and translation.