Module 2: Foundations in biology›Biological molecules (2.1.2)

Water, , is a simple covalent molecule. The central oxygen shares a single covalent bond with each hydrogen.

Water is polar because the oxygen atom attracts the shared electrons more strongly, meaning that it has a partial negative charge, while the hydrogen atoms are partially positive. This polarity results in water molecules interacting with each other through hydrogen bonds.
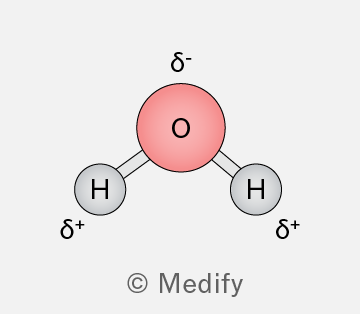
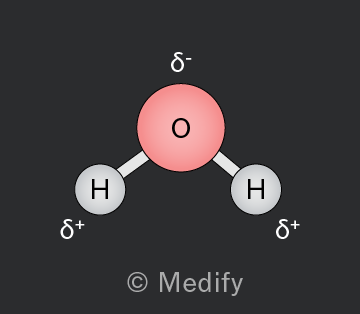
Diagram of a water molecule showing one oxygen atom (O) in the center with a red circle, connected to two hydrogen atoms (H) with gray circles. The oxygen atom has a delta negative (δ-) label above it, indicating partial negative charge. Each hydrogen atom has a delta positive (δ+) label beside it, indicating partial positive charge. The image is credited to Medify.
Add to favourites

Hydrogen bonds are strong electrostatic intermolecular interactions. They form between water molecules as the partially positively charged hydrogen atom is attracted to the lone electron pair of the electronegative oxygen atom.

Hydrogen bonds are responsible for some unique properties of water, such as cohesion, adhesion, heat capacity, and surface tension.
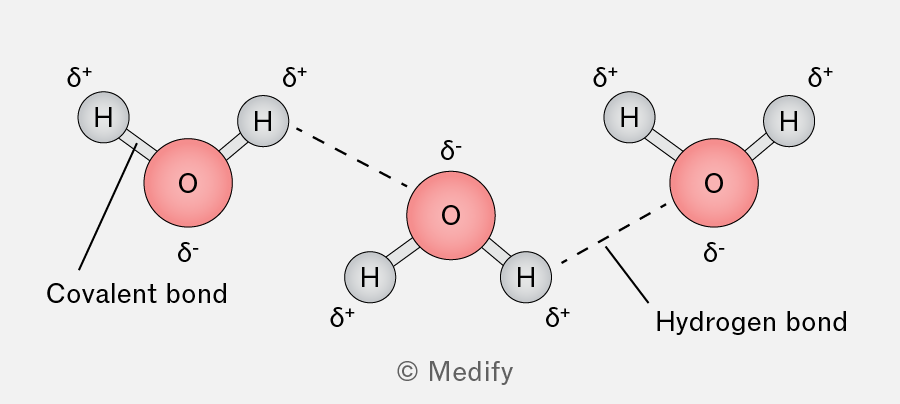
The image shows three water molecules, each with an oxygen atom labeled as 'O' and hydrogen atoms labeled as 'H'. The oxygen atoms are in red, and the hydrogen atoms are in gray. Each oxygen atom is connected to two hydrogen atoms with solid lines labeled 'Covalent bond'. The oxygen atoms have a delta negative (δ-) sign, and the hydrogen atoms have a delta positive (δ+) sign. Dashed lines labeled 'Hydrogen bond' connect the hydrogen atoms of one water molecule to the oxygen atom of another, indicating hydrogen bonding between molecules. The layout illustrates the polar nature of water molecules and the formation of hydrogen bonds between them.
Add to favourites

Water is a polar molecule, so it interacts with charged species, behaving as a solvent. This property facilitates numerous metabolic reactions that occur in aqueous environments.
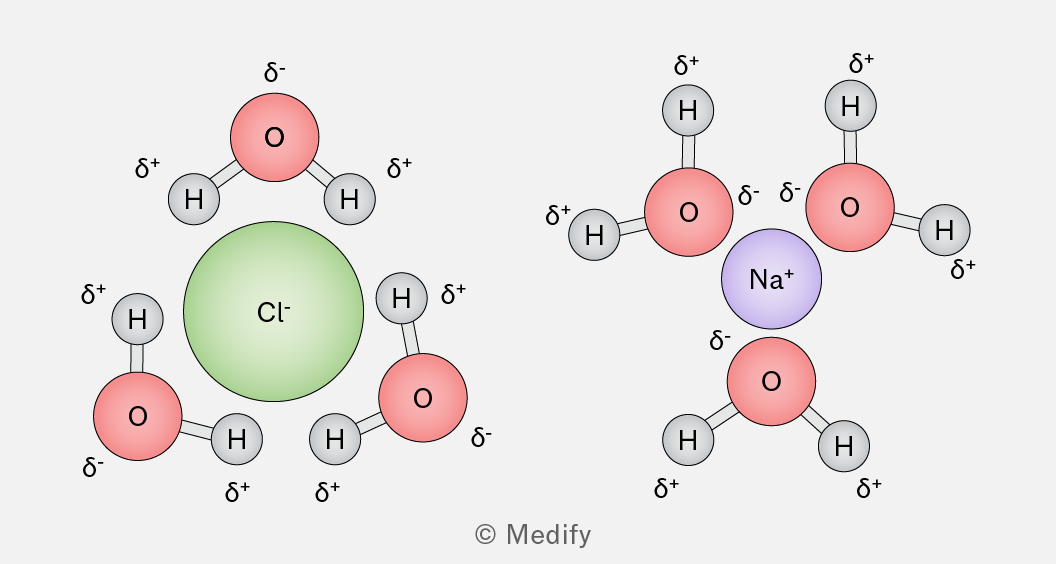
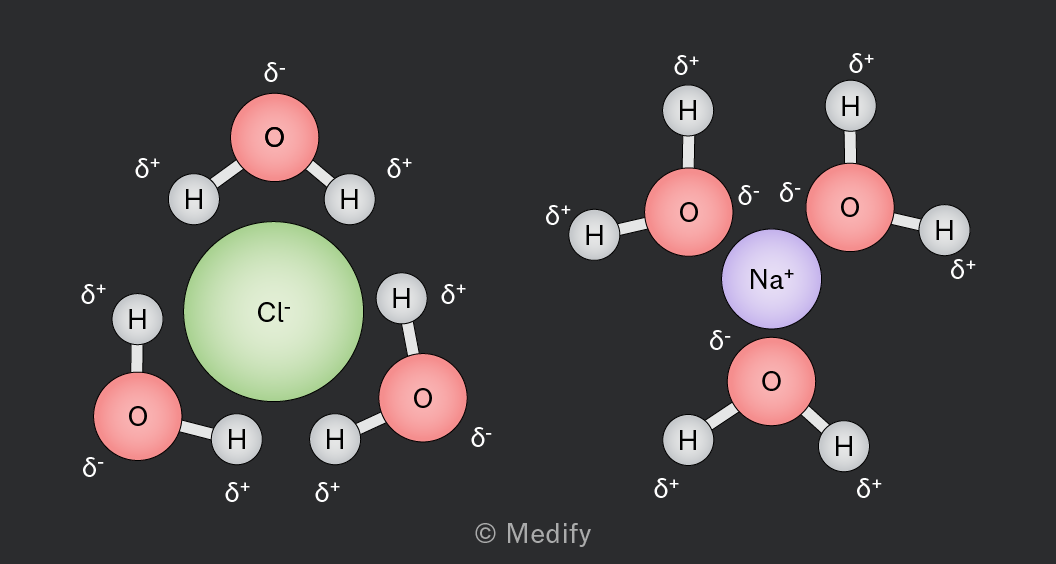
The image shows two diagrams of ions surrounded by water molecules. On the left, a green chloride ion (Cl⁻) is surrounded by three water molecules. Each water molecule has a red oxygen atom labeled with δ⁻ and two gray hydrogen atoms labeled with δ⁺. The hydrogen atoms are oriented towards the chloride ion. On the right, a purple sodium ion (Na⁺) is surrounded by three water molecules. Each water molecule has a red oxygen atom labeled with δ⁻ and two gray hydrogen atoms labeled with δ⁺. The oxygen atoms are oriented towards the sodium ion.

In ionic compounds such as sodium chloride, the positive ions are attracted to the partially negative oxygen of the water molecules, while ions are attracted to the partially positive hydrogens.

Add to favourites

As water freezes, it becomes less dense as hydrogen bonds lock the molecules into a fixed crystalline structure, where there is increased spacing between molecules. This reduced density causes ice to float.

A lot of energy is needed to break the hydrogen bonds between water molecules, which means that the structure of water also results in a high boiling point.
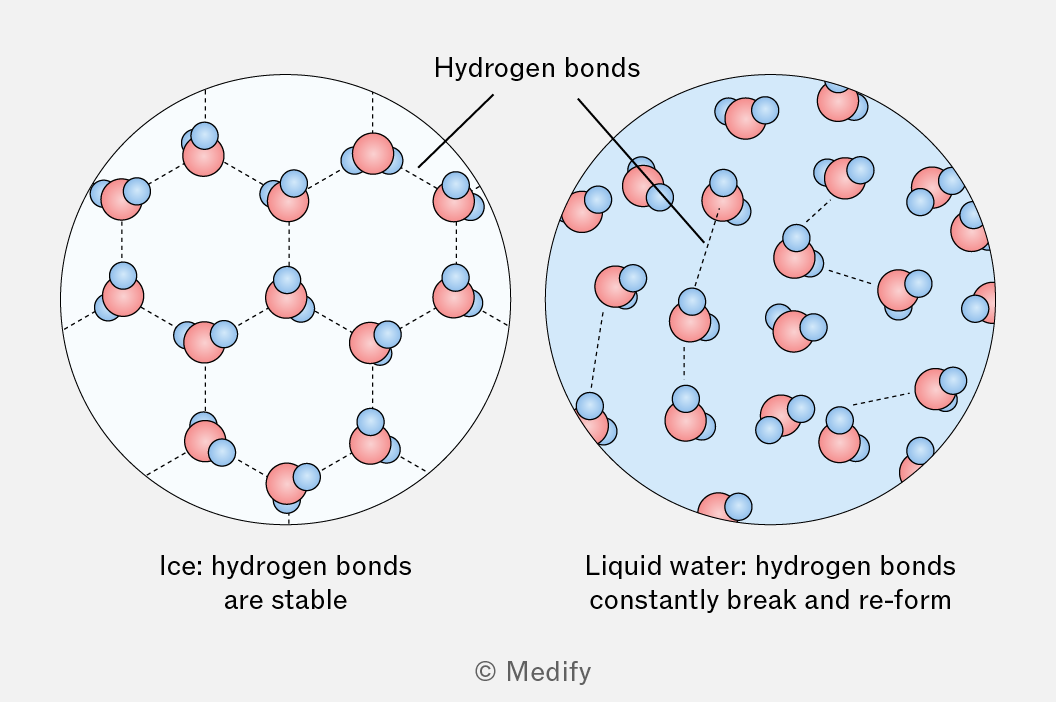
A diagram comparing the molecular structure of ice and liquid water. On the left, ice is depicted with stable hydrogen bonds between molecules, while on the right, liquid water shows hydrogen bonds that constantly break and reform.
Add to favourites

Most organisms (but particularly small ones) require a stable temperature range to survive.

The specific heat capacity of water is the amount of heat energy required to raise the temperature of 1 of water by 1 .

Water’s high specific heat capacity means it resists temperature changes, providing a stable environment. This stability makes large water bodies, such as oceans and lakes, thermally stable habitats, ideal for aquatic life.

Add to favourites

Cohesion is the attraction between molecules of the same substance. In water, hydrogen bonding causes strong cohesion, allowing water molecules to form continuous columns for transport in the xylem during transpiration.

Cohesion also contributes to water’s high surface tension, enabling small organisms to move across the water surface.

Add to favourites

Adhesion is the attraction between molecules of different substances. In plants, water molecules adhere to the walls of xylem vessels, helping maintain a continuous column of water and aiding its movement against gravity during transpiration. Adhesion also contributes to capillary action.

Add to favourites

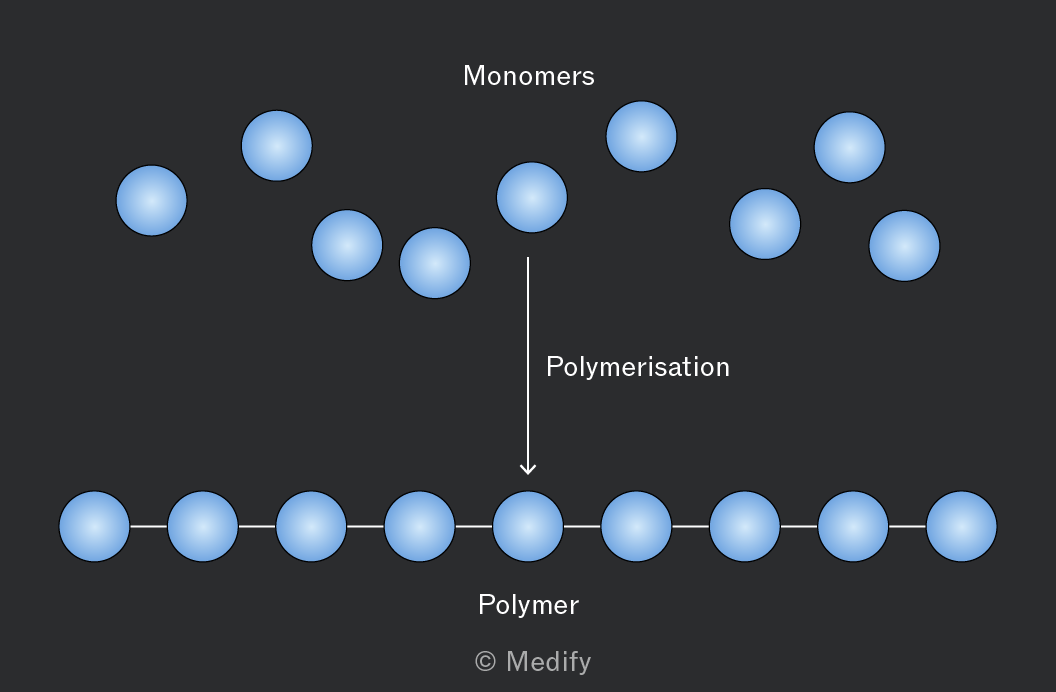
A monomer is a small, single molecule that can bind chemically to other monomers to form a larger structure.

A polymer is a large chain molecule composed of repeating units of monomers that are bonded together. Polymers play a crucial role in the formation of complex biological macromolecules.

Examples of monomers and polymers include:

  • Amino acids link together to form proteins.
  • Nucleotides join to create nucleic acids like DNA and RNA.
  • Monosaccharides, such as glucose, bond to form polysaccharides as starch and cellulose.
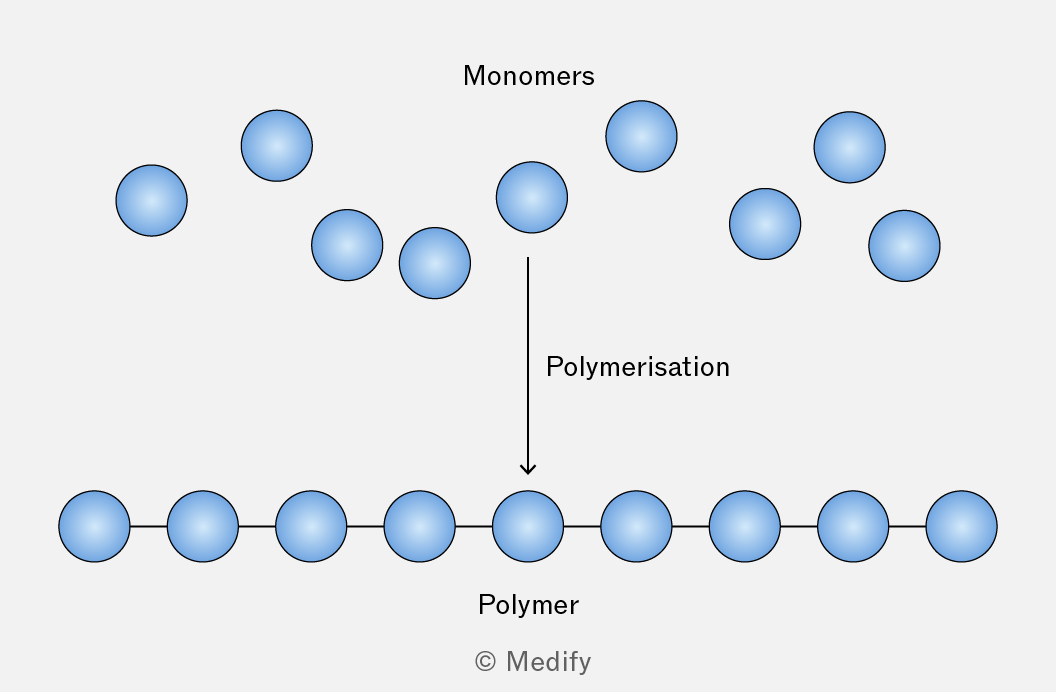
The image depicts a diagram of polymerization. At the top, there are several individual blue circles labeled 'Monomers'. An arrow labeled 'Polymerisation' points downward, leading to a horizontal chain of blue circles connected by lines, labeled 'Polymer'.
Add to favourites

Condensation reactions occur when two molecules combine to form a larger molecule, releasing one molecule of water ().

These reactions are essential for the synthesis of many biological polymers. For example, peptide bonds form between amino acids through condensation reactions to make polypeptides.

Add to favourites

Hydrolysis reactions involve splitting a large molecule into smaller molecules by adding one molecule of water ().

These reactions are the reverse of condensation reactions and are essential for breaking down polymers into their monomer components. For example, the peptide bonds in a dipeptide can be broken by adding water in a hydrolysis reaction to produce two amino acid monomers.
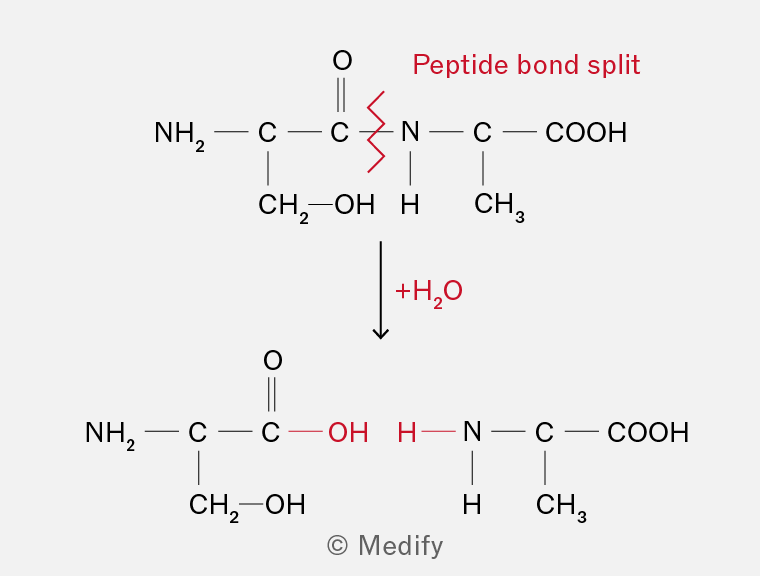
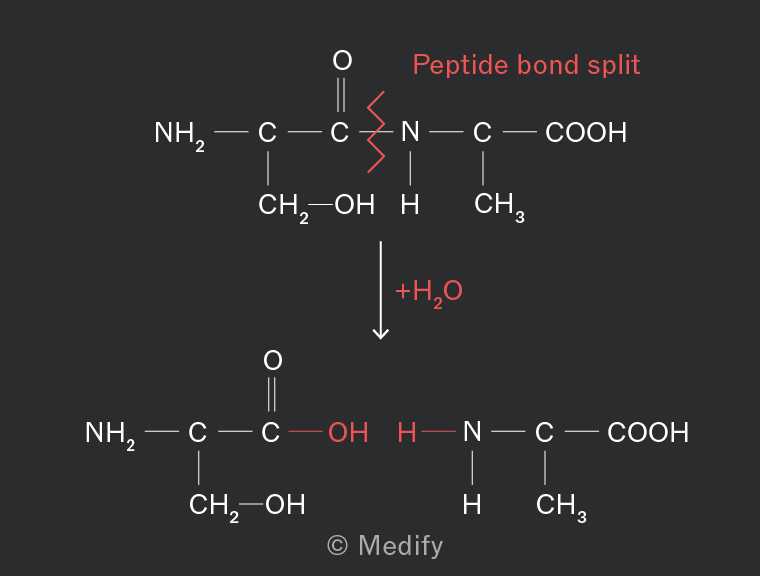
The image shows a chemical reaction involving the splitting of a peptide bond. At the top, the structure includes: an amino group (NH2) bonded to a carbon (C) double-bonded to oxygen (O), and a CH2OH group. This carbon is single-bonded to another carbon (C) which has a zigzag red line indicating a bond split with a nitrogen (N) atom, followed by a carbon (C) with a carboxyl group (COOH) and a CH3 group. The label 'Peptide bond split' is in red above the zigzag line. An arrow pointing downwards shows the reaction direction, labeled '+H2O' in red. Below, the resulting structures show the addition of OH to the carbon and H to the nitrogen, completing the two separate molecules.
Add to favourites

There are four groups of biological macromolecules: carbohydrates, lipids, proteins, and nucleic acids consisting of the following chemical elements:

  • carbohydrates –
  • lipids –
  • proteins –
  • nucleic acids –
Add to favourites

Carbohydrates are biological molecules made from sugars.

Monosaccharides are the simplest form of sugar, consisting of a single monomer. Examples include glucose, fructose, and galactose.

Two monosaccharides join via a condensation reaction to form a disaccharide. Many monosaccharides join via condensation reactions to form a polysaccharide.

Add to favourites

Monosaccharides can be classified by the number of carbon atoms they contain:

  • trioses ()
  • pentoses ()
  • hexoses ().

Monosaccharides are polar molecules and are therefore soluble in water. Pentose and hexose monosaccharides usually exist as ring structures in solution, with the carbon atoms numbered for identification.

Glucose () contains six carbon atoms and is therefore a hexose monosaccharide.

Add to favourites

Glucose exists in two isomeric forms: -glucose and -glucose. They have the same chemical formula but different structures and properties.

In -glucose, the (hydroxyl) group on carbon 1 is on the opposite side of the ring from the group, whereas in -glucose it is on the same side.
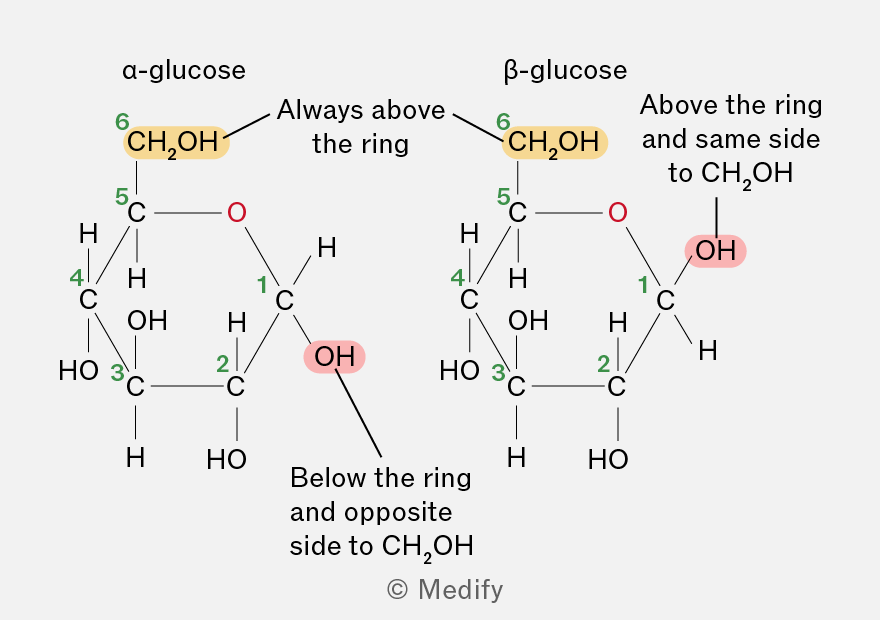
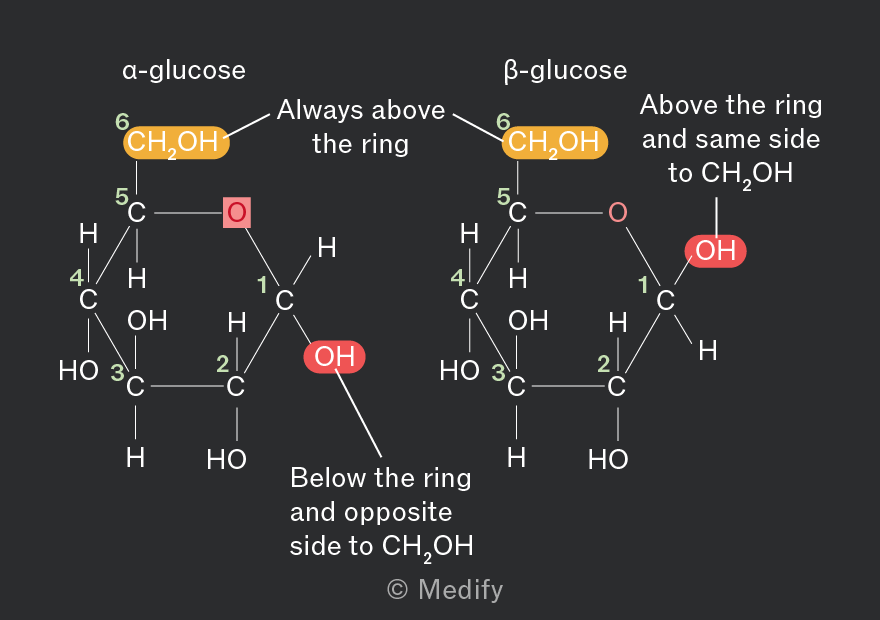
The image shows the chemical structures of α-glucose and β-glucose. Both structures are cyclic forms of glucose with six carbon atoms. In α-glucose, the hydroxyl group (OH) on carbon 1 is below the plane of the ring, while in β-glucose, the OH group is above the plane. Both structures are labeled with numbers 1 to 6 indicating carbon atoms. In α-glucose, carbon 6 is connected to a CH2OH group above the ring, and the OH group on carbon 1 is labeled 'Below the ring and opposite side to CH2OH.' In β-glucose, the CH2OH group on carbon 6 is also above the ring, and the OH group on carbon 1 is labeled 'Above the ring and same side to CH2OH.' Additional labels highlight the position of the CH2OH group as 'Always above the ring.'
Add to favourites

Ribose and deoxyribose are pentose monosaccharides, meaning they have five carbon atoms.

They are found in the nucleotide monomers that form RNA (ribonucleic acid) and DNA (deoxyribonucleic acid).

Ribose and deoxyribose are very similar in their structure, but deoxy ribose lacks an oxygen atom at carbon 2.
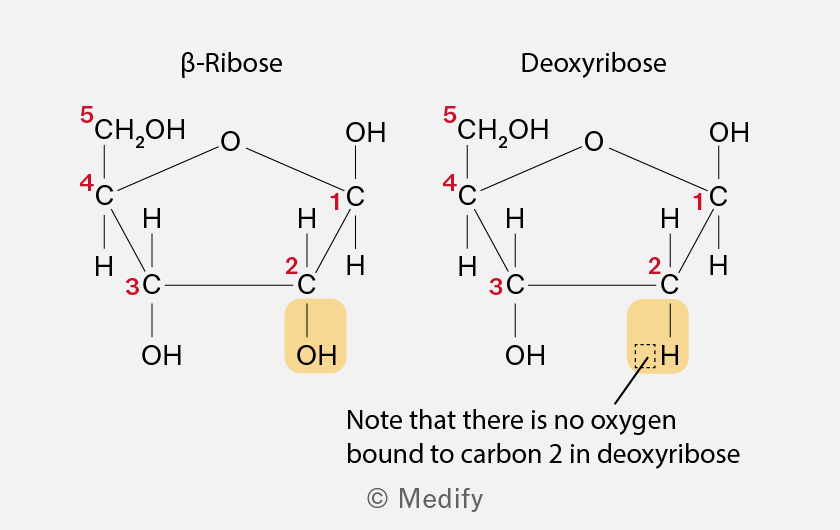
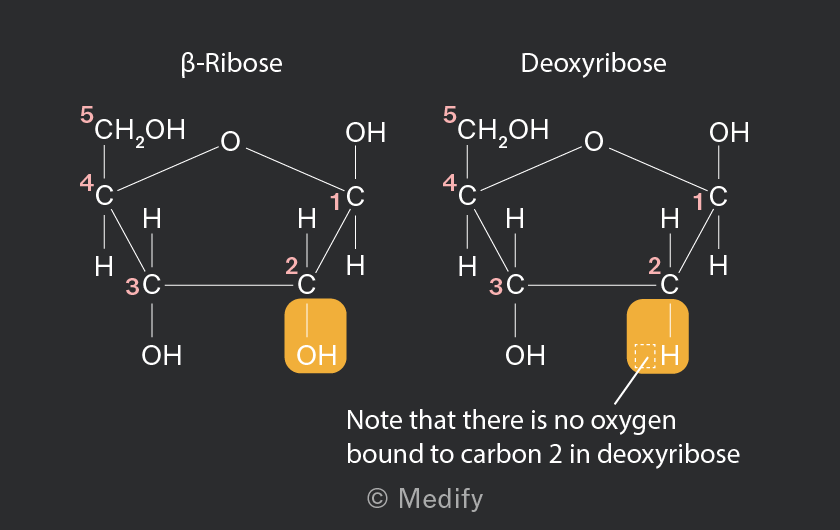
The image displays two chemical structures labeled as β-Ribose and Deoxyribose. β-Ribose is on the left, showing a five-carbon ring with an oxygen atom at the top right. The carbons are numbered 1 to 5 in red. Carbon 1 is bonded to an OH group, carbon 2 to an OH group highlighted in yellow, carbon 3 to an OH group, carbon 4 to an H, and carbon 5 to a CH2OH group. Deoxyribose is on the right, similarly structured, but carbon 2 is only bonded to an H atom, highlighted in yellow, instead of an OH group. A note below states, 'Note that there is no oxygen bound to carbon 2 in deoxyribose.'
Add to favourites

Monosaccharides are linked by glycosidic bonds, which form in a condensation reaction between hydroxyl () groups on adjacent monosaccharides, releasing a molecule of water.

The name of the glycosidic bond indicates the carbon atoms involved in the linkage. For example, an 1,4 glycosidic bond forms between carbon 1 of one -glucose molecule and carbon 4 of another.

Two -glucose molecules combine to form the disaccharide maltose, joined by an 1,4 glycosidic bond.
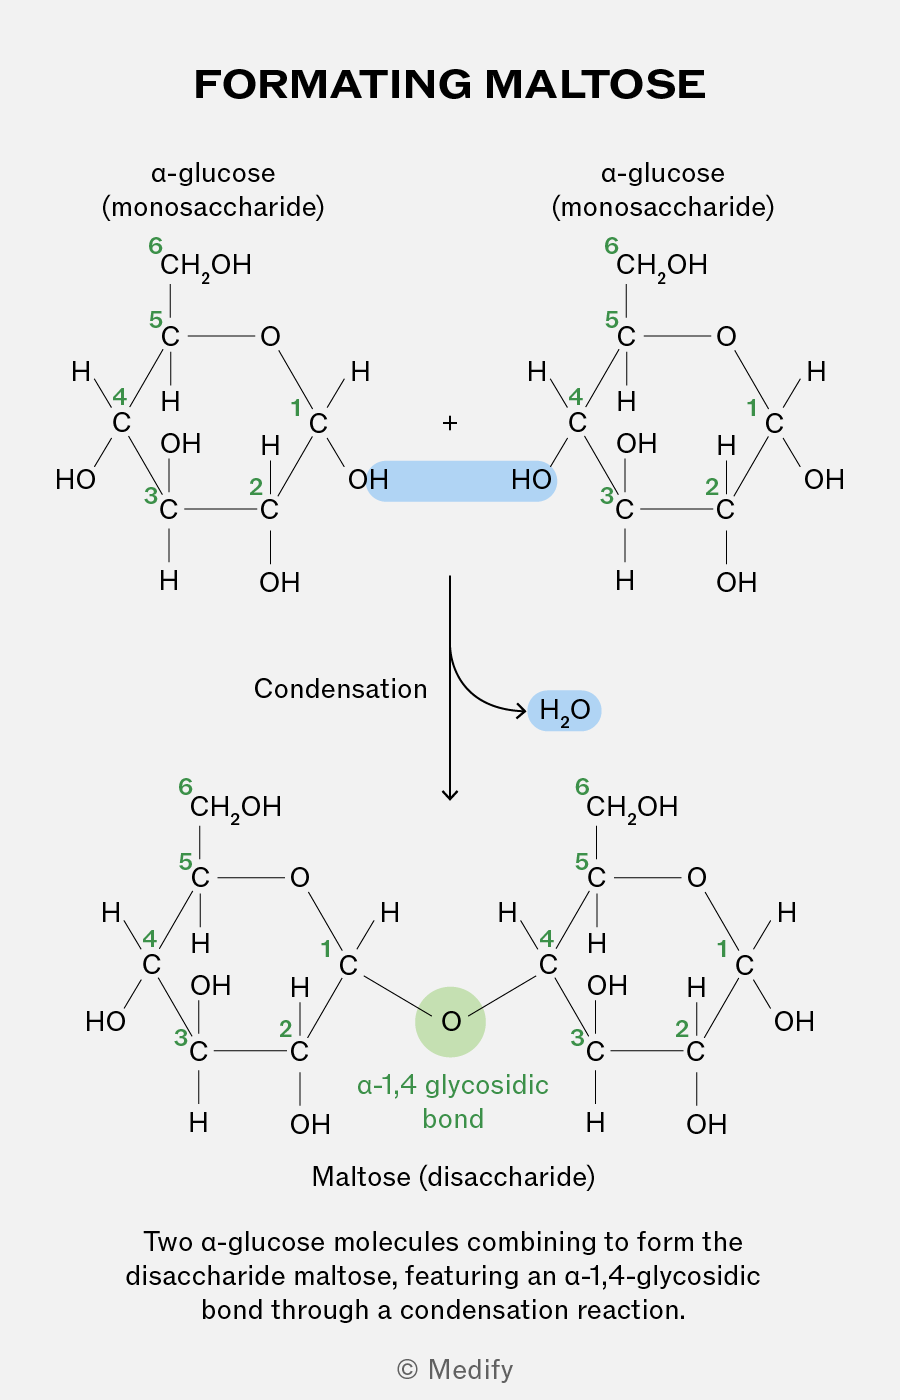
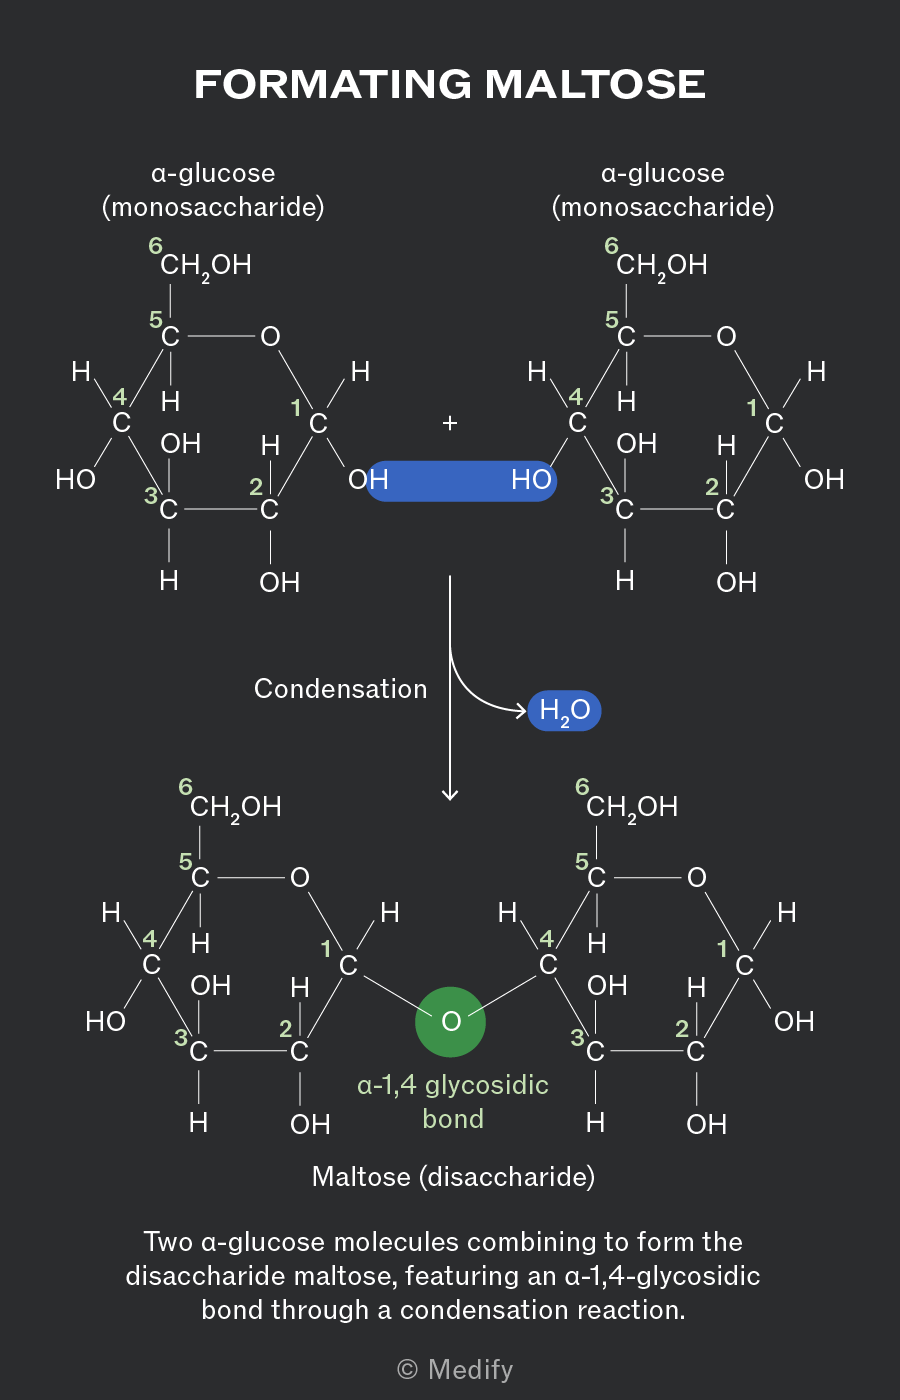
The image illustrates the formation of maltose from two alpha-glucose molecules. At the top, two alpha-glucose structures labeled as 'alpha-glucose (monosaccharide)' are shown. Each glucose molecule has carbon atoms numbered 1 through 6, with hydroxyl (OH) and hydrogen (H) groups attached. The two glucose molecules are linked by a blue highlighted area between the OH groups of one glucose's carbon 1 and the other glucose's carbon 4. An arrow labeled 'Condensation' points downward to the formation of maltose, labeled 'Maltose (disaccharide).' In the maltose structure, the glucose units are linked by an 'alpha-1,4 glycosidic bond,' highlighted in green. A blue label 'H2O' indicates the release of water during the reaction. Additional text reads, 'Two alpha-glucose molecules combining to form the disaccharide maltose, featuring an alpha-1,4-glycosidic bond through a condensation reaction.'
Add to favourites

Two monosaccharides bonded together via a glycosidic bond form disaccharides:

  • Maltose = -glucose + -glucose
  • Sucrose = -glucose + -fructose
  • Lactose = -galactose + glucose.
Add to favourites

The glycosidic bonds between monosaccharides can be broken down through hydrolysis reactions, where one molecule of water is added to break the bond.

Hydrolysis is crucial in biological processes, such as digestion and the breakdown of stored carbohydrates for cellular respiration.
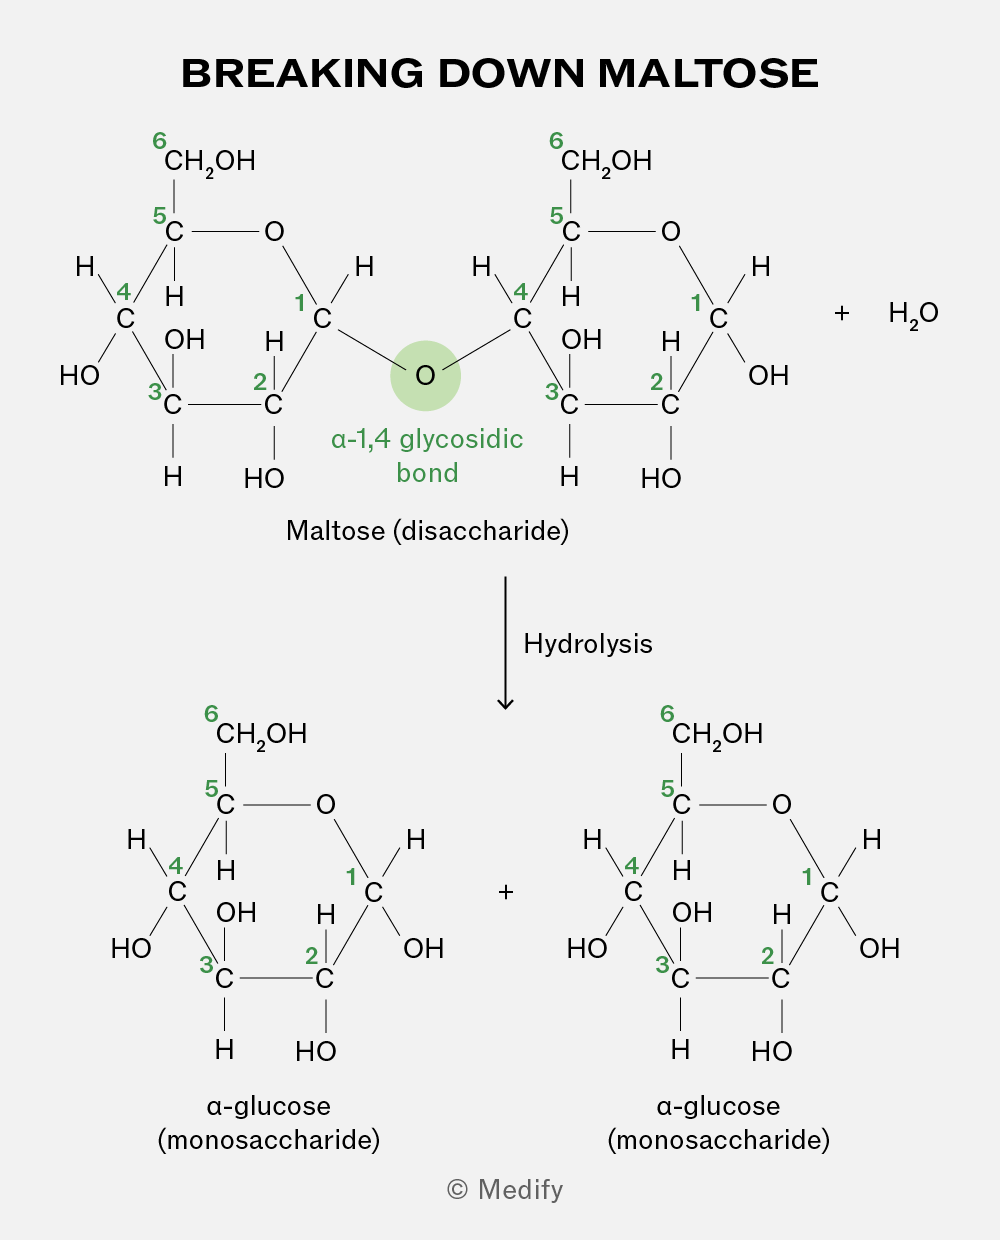
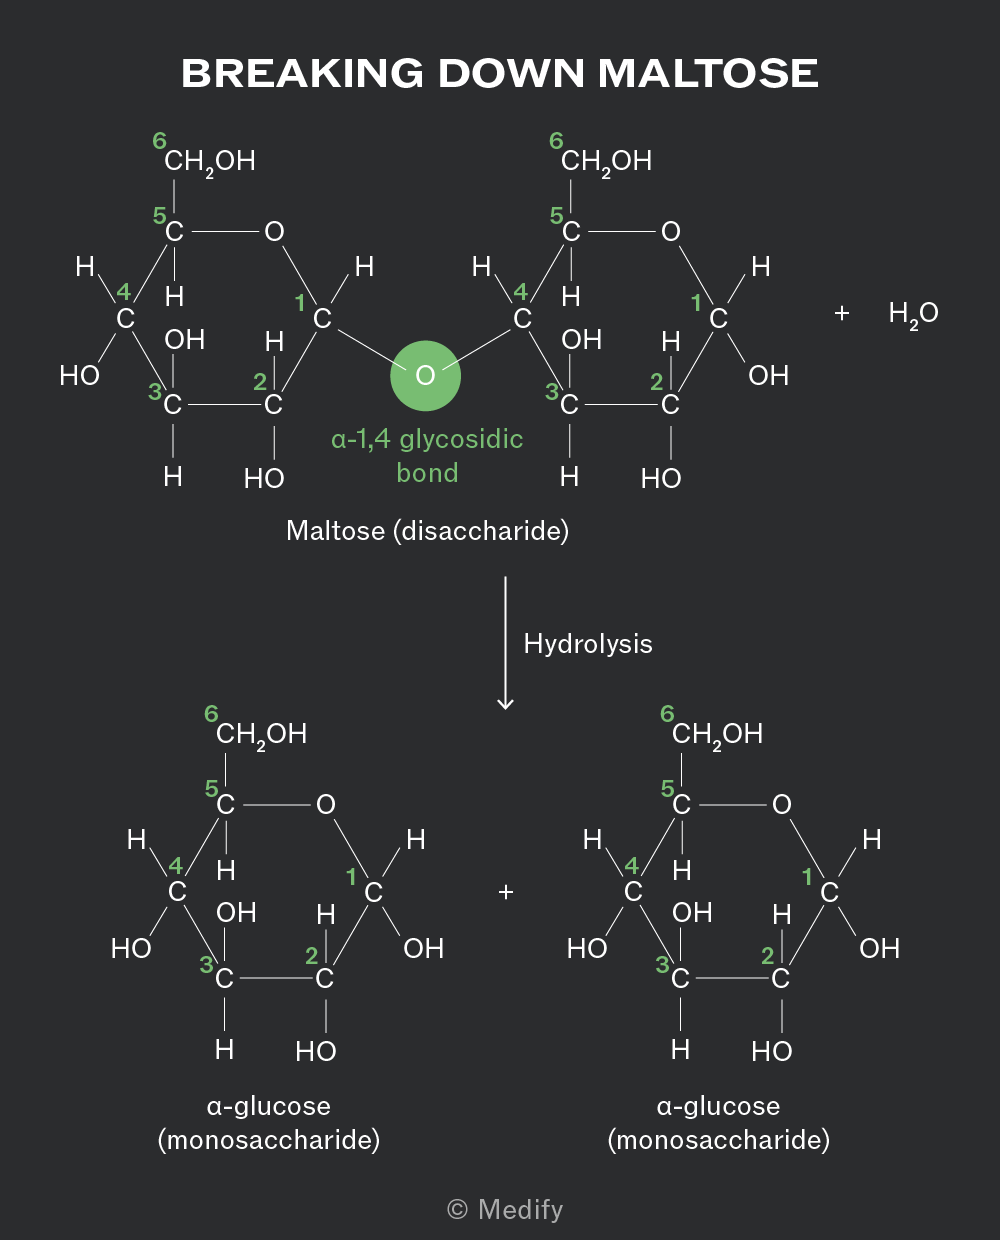
The image titled 'Breaking Down Maltose' shows the chemical structure of maltose, a disaccharide, which is composed of two α-glucose (monosaccharide) units. In the top section, two glucose rings are joined by an α-1,4 glycosidic bond, highlighted in green, between the oxygen of the first glucose and the carbon of the second glucose. Each glucose molecule has carbon atoms numbered from 1 to 6. The left glucose has a CH2OH group at carbon 6, an OH group at carbon 4, and HO at carbon 3. The right glucose is similar. The reaction shows hydrolysis, where water (H2O) is added, breaking the glycosidic bond and resulting in two separate α-glucose molecules. Each glucose molecule has the same structure, with CH2OH at carbon 6, OH at carbon 4, and HO at carbon 3. The process is indicated by a downward arrow labeled 'Hydrolysis'.
Add to favourites

Starch is the insoluble, primary storage polysaccharide in plants and is formed from a few hundred to a few thousand -glucose monosaccharides bonded together. It is made from a mixture of two polysaccharides.

Add to favourites

The two polysaccharides which form starch are:

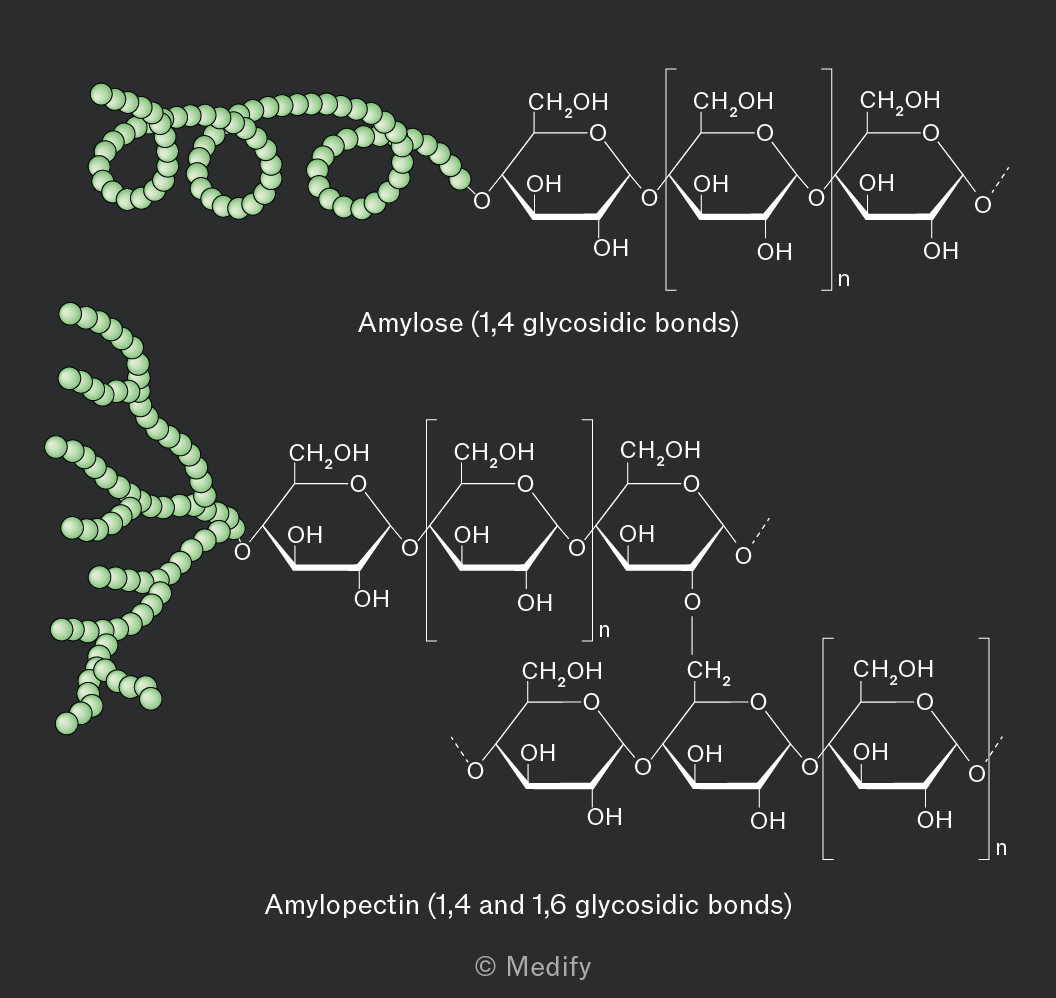
  • Amylose constitutes 10–30 of starch and has an unbranched, helix-shaped chain of -glucose molecules linked by 1,4 glycosidic bonds.
  • Amylopectin constitutes 70–90 of starch and has both 1,4 glycosidic bonds and 1,6 glycosidic bonds, creating a branched molecule. Enzymes involved in breaking down these molecules can simultaneously work at multiple branch points, leading to rapid release of glucose for energy. More accessible hydroxyl groups make amylopectin more soluble in water.
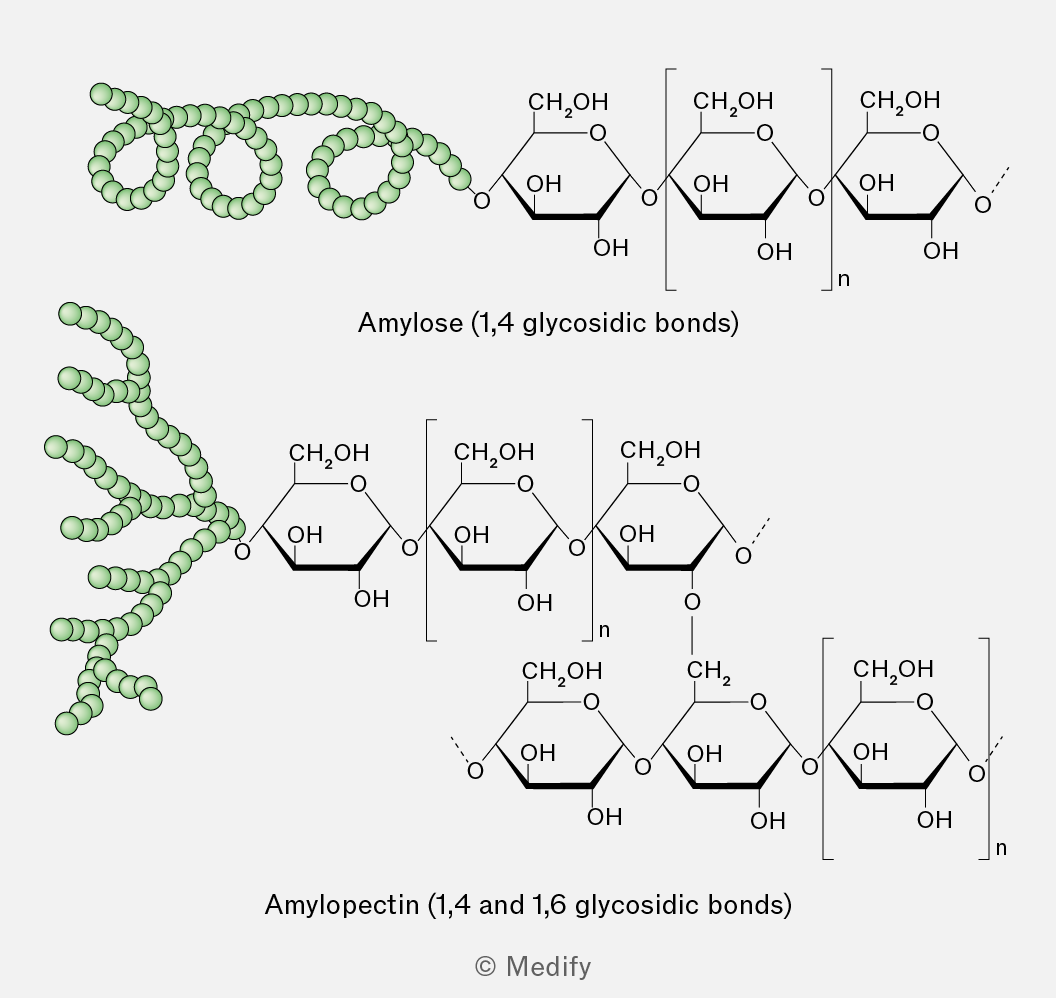
The image shows two types of polysaccharides, amylose and amylopectin. The top section illustrates amylose, labeled 'Amylose (1,4 glycosidic bonds)', with a coiled structure on the left and a linear chain of glucose units on the right. Each glucose unit is depicted with hydroxyl (OH) groups and an oxygen bridge indicating 1,4 glycosidic bonds. The bottom section shows amylopectin, labeled 'Amylopectin (1,4 and 1,6 glycosidic bonds)', with a branched structure on the left and a glucose chain on the right. The chain includes glucose units connected by 1,4 glycosidic bonds with occasional 1,6 branching points. Each glucose unit is similarly depicted with hydroxyl groups and connections indicating glycosidic bonds. The illustration uses green spheres to represent the coiled and branched structures of the polysaccharides.
Add to favourites

Glycogen is the primary storage polysaccharide in animals and fungi, characterised by a highly branched and uncoiled structure.

The highly branched structure of glycogen means there are numerous terminal glucose units leading to rapid release of glucose for energy. Branched polysaccharides with more accessible hydroxyl groups are also more soluble in water.

Glycogen’s structure is similar to amylopectin, but its branching is more extensive. This makes it more water-soluble and its terminal glucose molecules more accessible to enzymes.
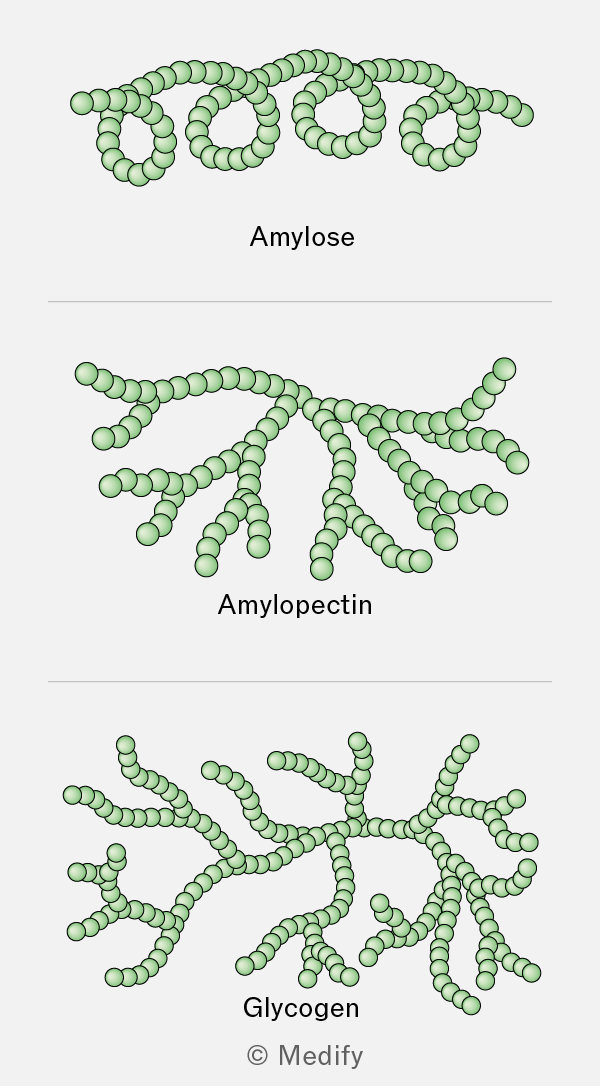
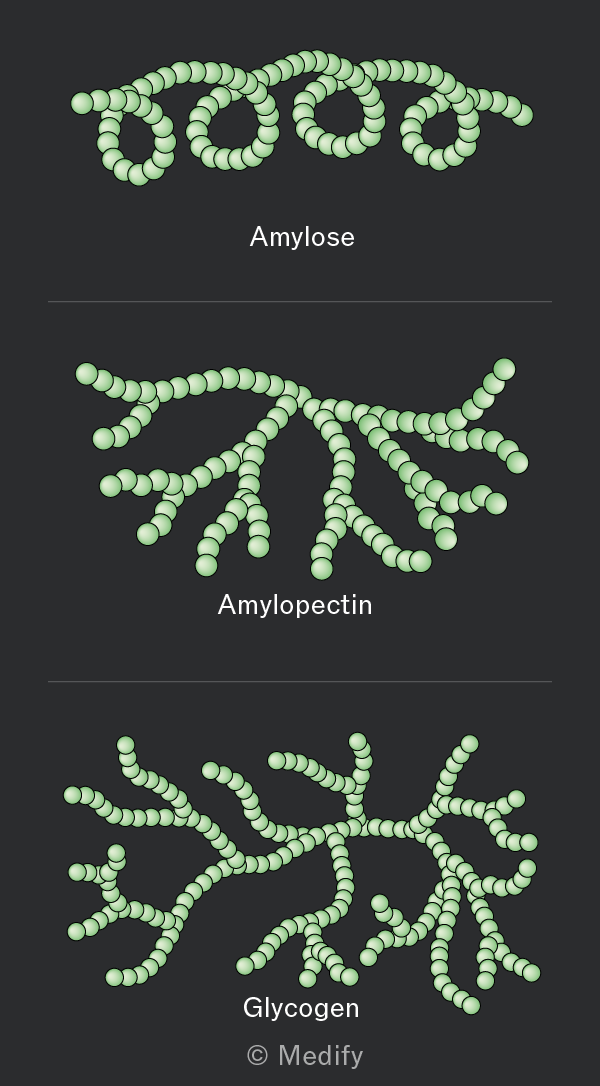
The image contains three diagrams of polysaccharide structures. The top diagram is labeled 'Amylose' and shows a linear chain of green spheres coiled into a helix. The middle diagram is labeled 'Amylopectin' and depicts a branched structure with a main chain of green spheres and several branching chains. The bottom diagram is labeled 'Glycogen' and illustrates a highly branched structure with green spheres forming multiple short, branching chains. The bottom of the image includes the copyright label '© Medify'.
Add to favourites

Amylose is coiled, making it insoluble and compact which is ideal for storage.

Amylopectin and glycogen are both highly branched molecules, making them compact and allowing more energy to be stored. Their branches provide multiple free ends where glucose molecules can be rapidly added in condensation reactions or removed in hydrolysis reactions, enabling quick adaptation to cellular energy demands.

Add to favourites

Glucose is stored in plants and animals until it’s needed for respiration. Storage molecules can be broken down by hydrolysis to provide glucose, which is converted from biochemical energy (oxidised) to usable energy (ATP) for cells.

Add to favourites

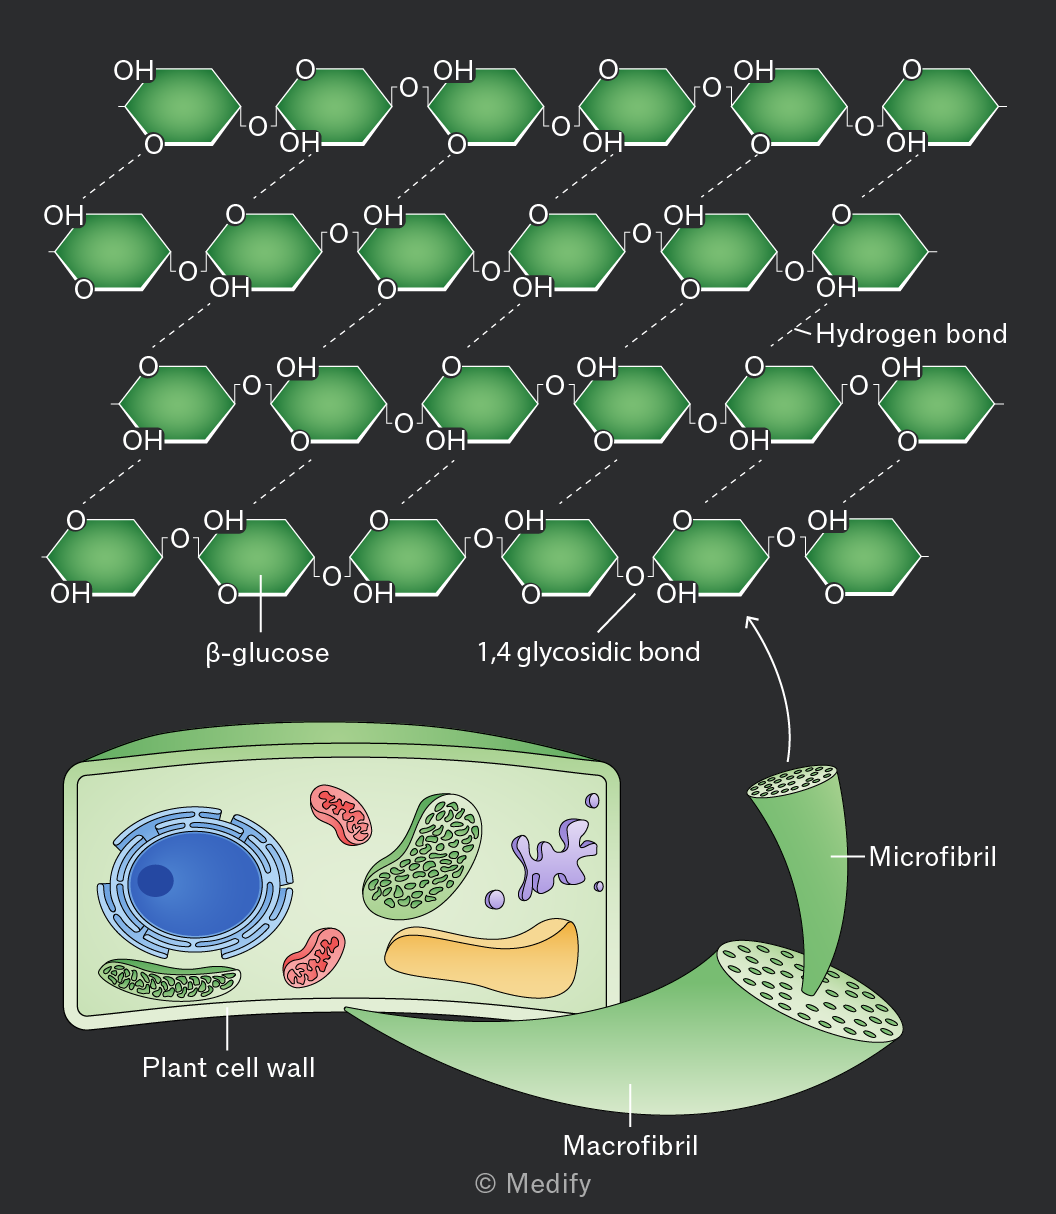
Cellulose is a structural polysaccharide in plants. It is composed of long, linear chains of -glucose molecules joined by 1,4 glycosidic bonds.

Every other -glucose molecule in cellulose is inverted, producing a linear structure with extensive hydrogen bonding within and between polysaccharide chains.

Cellulose’s high tensile strength is a combined result of several key structural features:

  • The strong 1,4 glycosidic bonds within a polysaccharide chain.
  • There hydrogen bonding between polysaccharide chains within a microfibril.
  • The alignment of microfibrils into macrofibrils.
  • The alignment of macrofibrils into fibres.
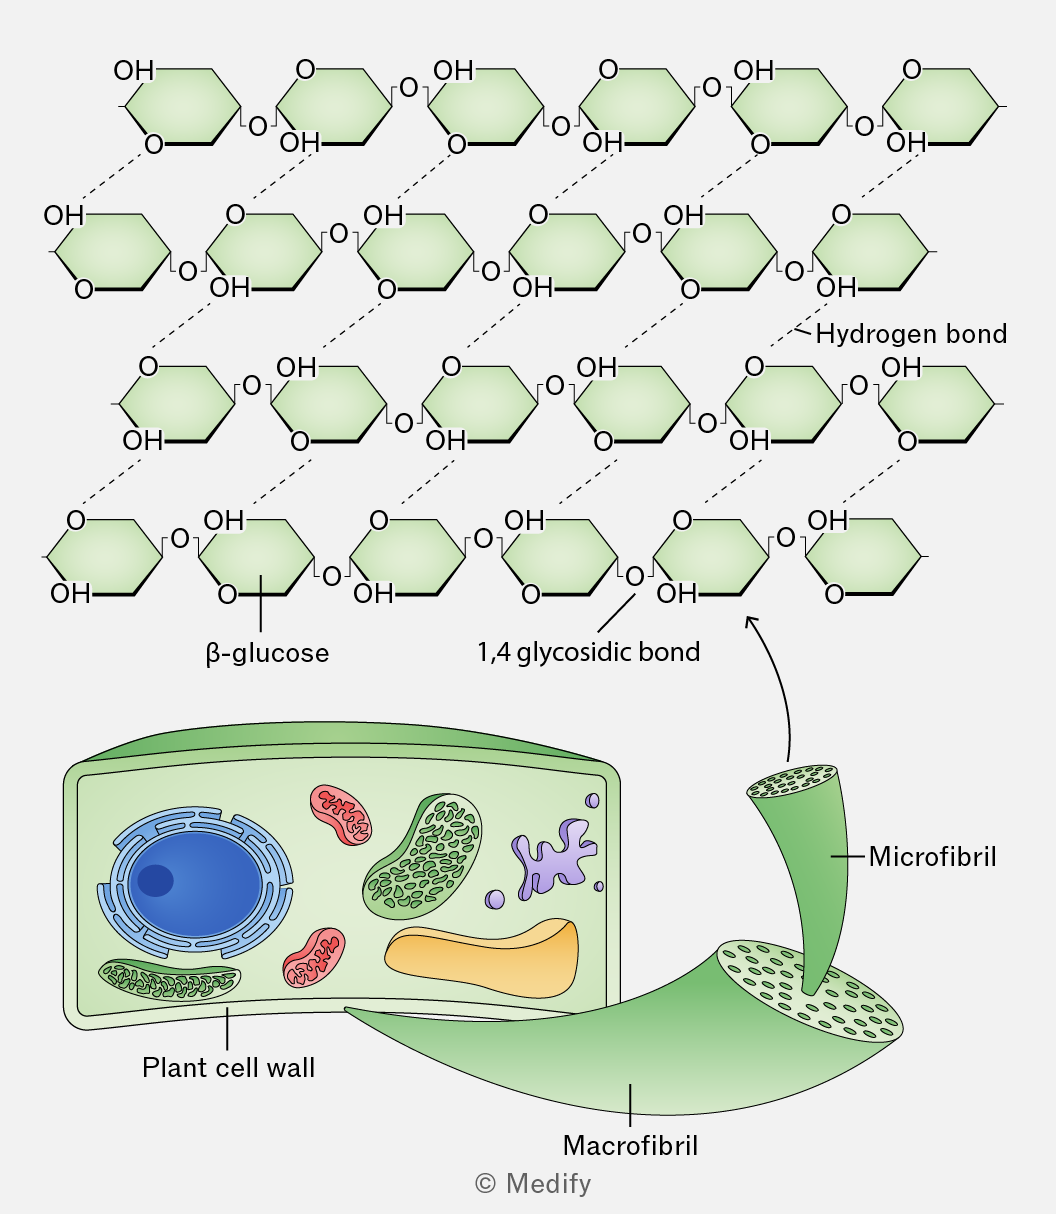
The image shows a structural diagram of cellulose, with multiple rows of β-glucose units linked by 1,4 glycosidic bonds and interconnected by dashed lines labeled 'Hydrogen bond'. The structure consists of hexagonal glucose units with 'OH' groups and oxygen atoms shown. Below the cellulose structure, a labeled illustration of a 'Plant cell wall' features a cross-section of a green wall and an inset diagram of a plant cell with visible organelles. A section of the cell wall is expanded to show a 'Macrofibril', which further expands to a smaller 'Microfibril' structure composed of aligned cellulose chains.
Add to favourites

Individual cellulose chains are held together by hydrogen bonds to form microfibrils.

Microfibrils are organised into larger macrofibrils, further stabilised by additional hydrogen bonds.
The alignment of macrofibrils can vary depending on their role within a plant.

Add to favourites

Cellulose is the main structural component of plant cell walls. The cell wall matrix includes other molecules such as lignin, to further increase cell wall strength.

Its structure gives it the following properties:

  • Its high tensile strength enables cell walls to withstand turgor pressure and maximise leaf surface area for light absorption.
  • Spaces between macrofibrils make cellulose fibres permeable to water and solutes, facilitating diffusion into and out of plant cells.
  • Cellulose is a source of dietary fibre (roughage). Few organisms have the enzyme cellulase, which hydrolyses cellulose, meaning that it is not absorbed during digestion.
Add to favourites

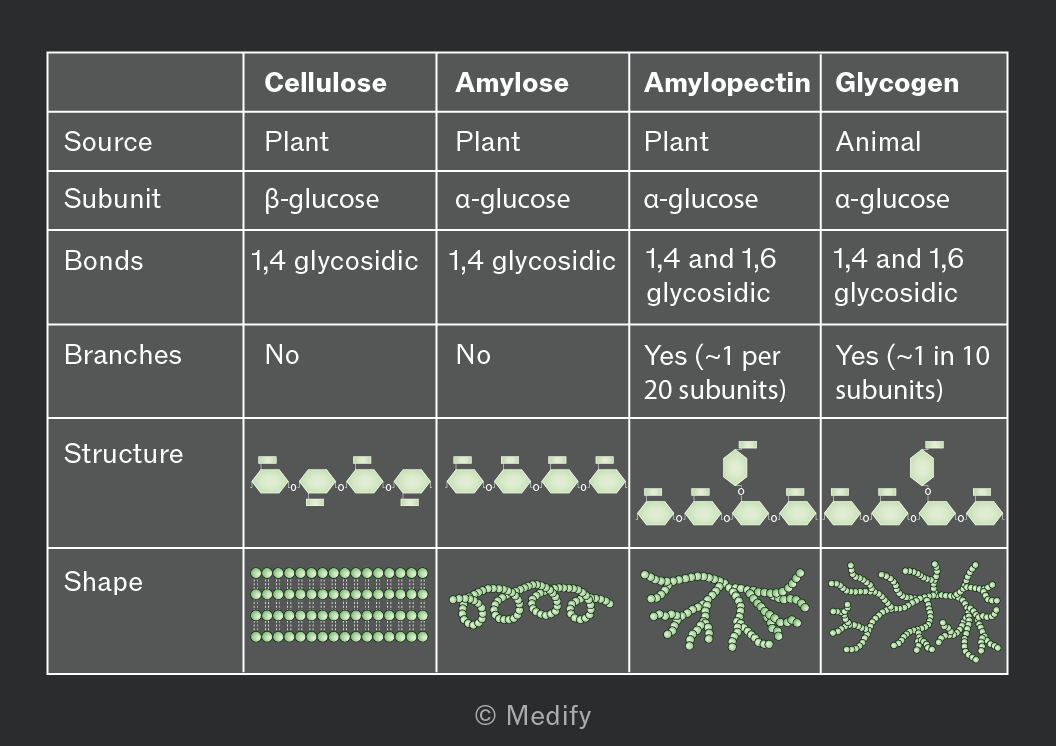
The bonding and structure of the key polysaccharides in plants and animals are summarised below.
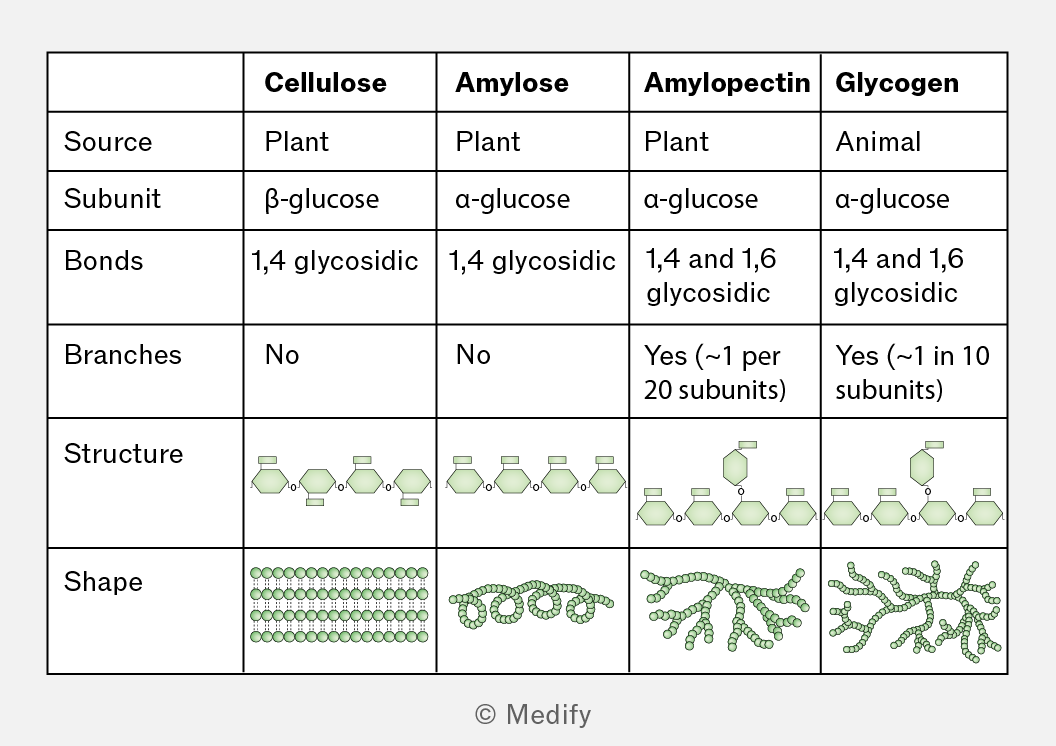
A table comparing the characteristics of cellulose, amylose, amylopectin, and glycogen. The columns are labeled: Cellulose, Amylose, Amylopectin, and Glycogen. The rows are labeled: Source, Subunit, Bonds, Branches, Structure, and Shape. 

- Source: Cellulose (Plant), Amylose (Plant), Amylopectin (Plant), Glycogen (Animal).
- Subunit: Cellulose (β-glucose), Amylose (α-glucose), Amylopectin (α-glucose), Glycogen (α-glucose).
- Bonds: Cellulose (1,4 glycosidic), Amylose (1,4 glycosidic), Amylopectin (1,4 and 1,6 glycosidic), Glycogen (1,4 and 1,6 glycosidic).
- Branches: Cellulose (No), Amylose (No), Amylopectin (Yes, approximately 1 per 20 subunits), Glycogen (Yes, approximately 1 in 10 subunits).
- Structure: Depicts linear chains for cellulose and amylose, branched chains for amylopectin and glycogen.
- Shape: Cellulose (parallel lines of circles), Amylose (spiral of circles), Amylopectin (branched cluster of circles), Glycogen (highly branched cluster of circles).
Add to favourites

Lipids are non-polar macromolecules.

Unlike other biological macromolecules, lipids are not classed as polymers because they are not composed solely of monomer subunits.

Liquid lipids are classed as oils whereas solid lipids are fats.

Add to favourites

Triglycerides are non-polar, hydrophobic molecules consisting of one glycerol molecule (an alcohol) and three fatty acid chains. They are the main components of fats and oils and are insoluble in water, but soluble in organic solvents, e.g., ethanol.

Fatty acids have a methyl group () at one end of a hydrocarbon chain (R group) and a carboxyl group () at the other end.
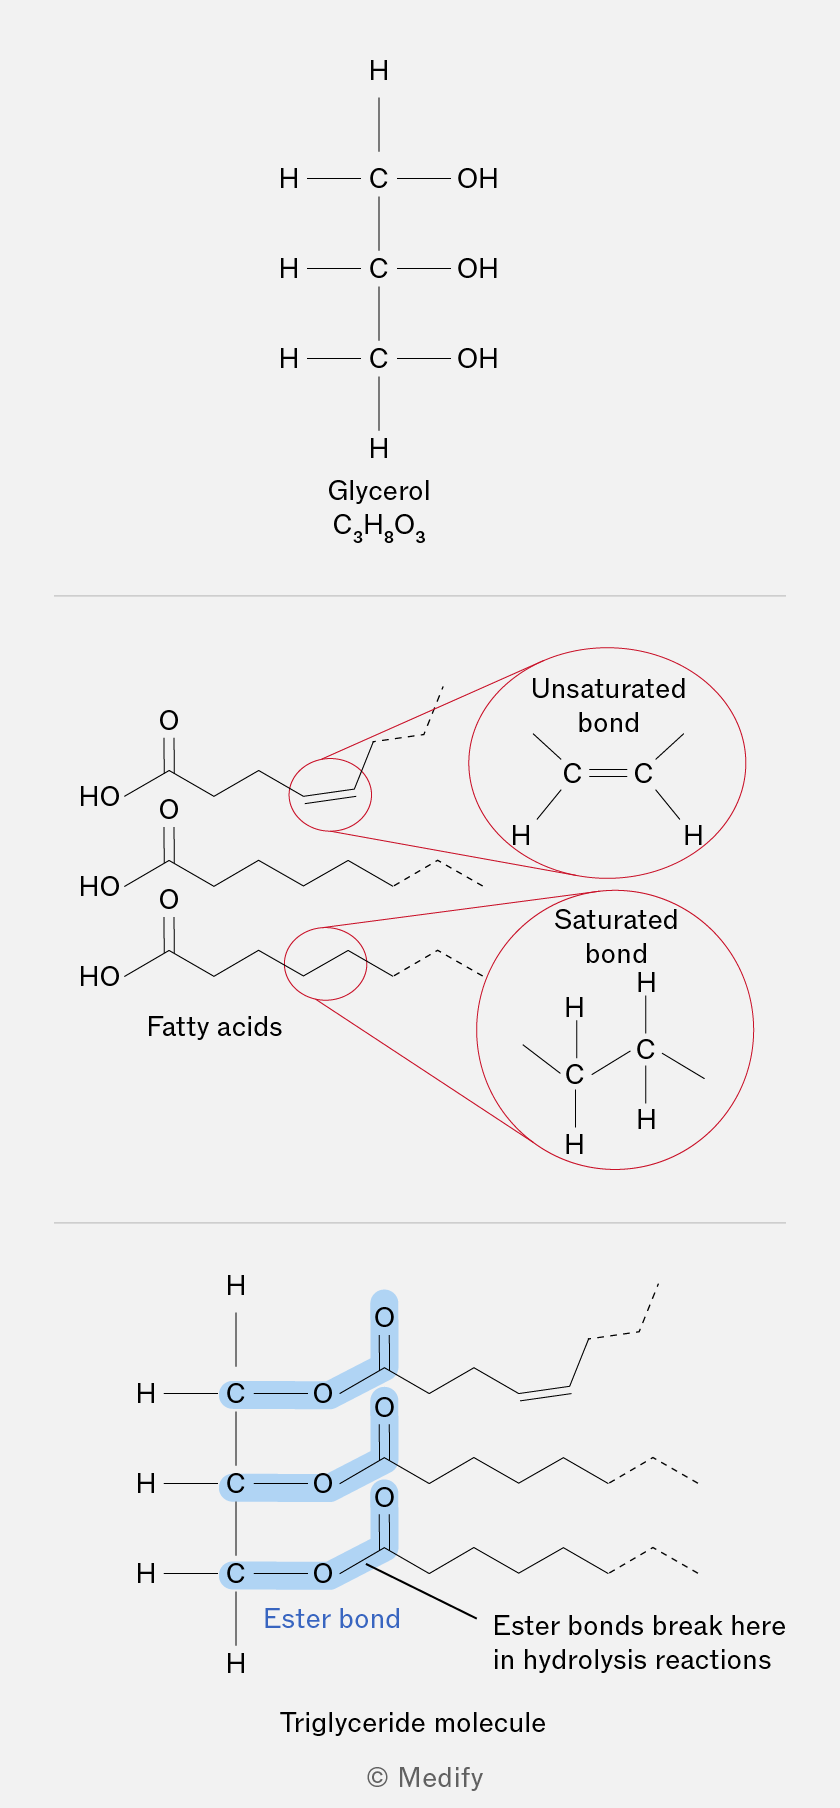
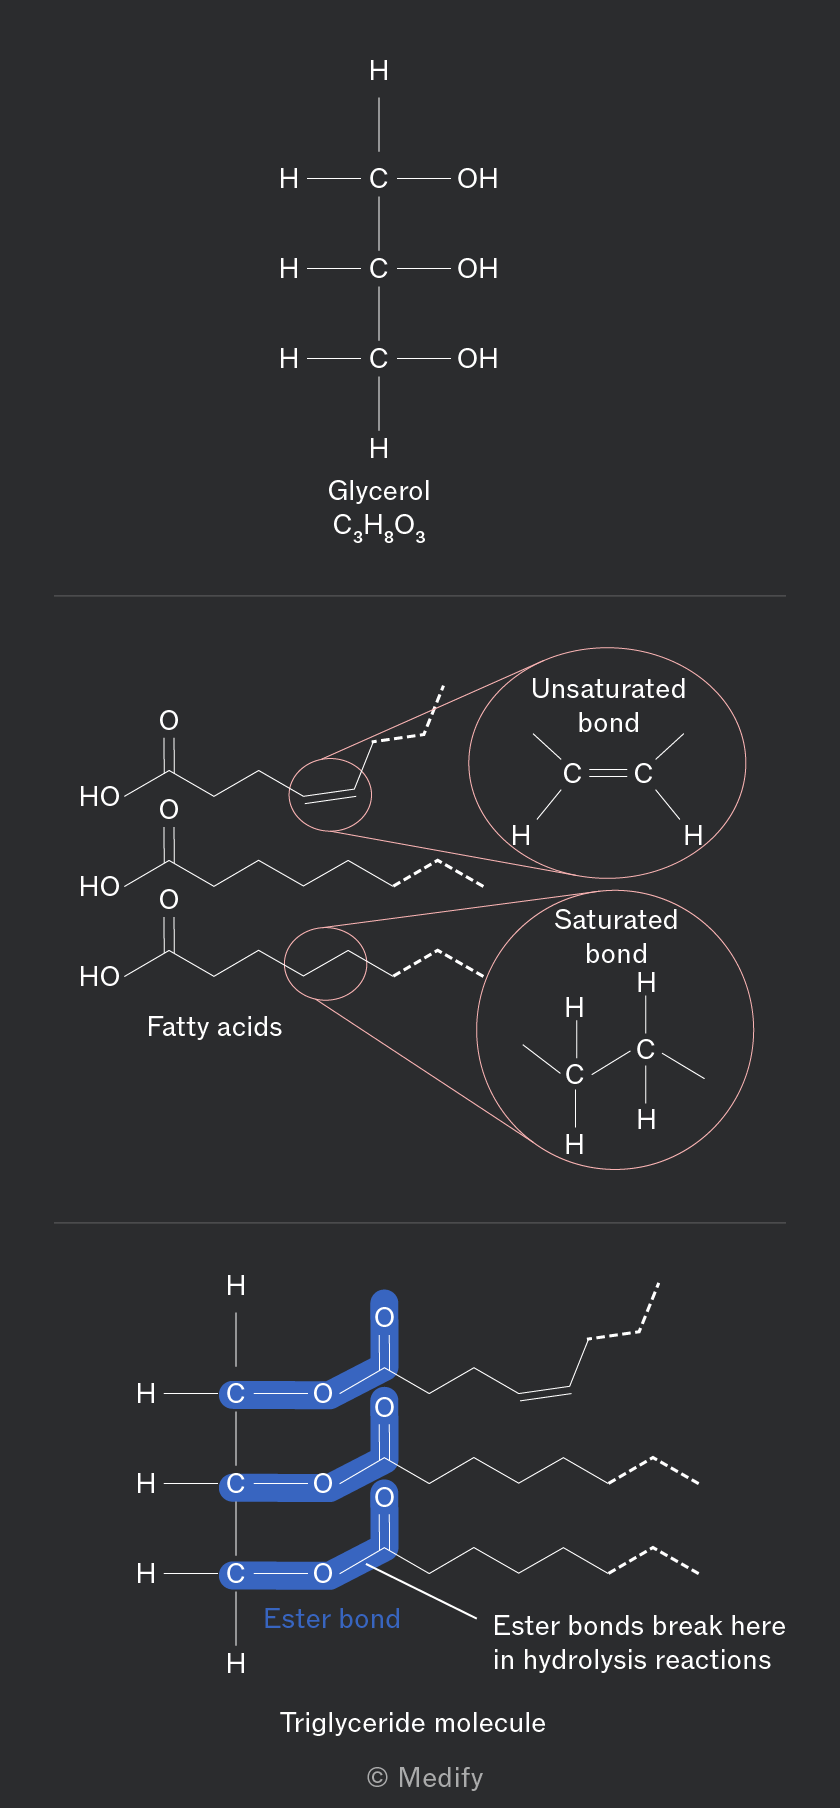
The image is divided into three sections. The top section shows the structure of glycerol with three carbon atoms each bonded to a hydroxyl group (OH) and hydrogen atoms, labeled as 'Glycerol C3H8O3'. The middle section depicts fatty acids with two zoomed-in circles showing an unsaturated bond (C=C) labeled 'Unsaturated bond', and a saturated bond (C-C) labeled 'Saturated bond'. The bottom section illustrates a triglyceride molecule where three fatty acid chains are connected to a glycerol backbone, highlighting 'Ester bond' in blue. The text 'Ester bonds break here in hydrolysis reactions' is annotated next to the ester bonds, and below is the label 'Triglyceride molecule'.
Add to favourites

Triglycerides are formed through a condensation reaction where each hydroxyl group () of glycerol reacts with a carboxyl group () of a fatty acid to form an ester bond.

Three fatty acids are attached to one glycerol molecule, three water molecules are released per triglyceride formed.

Ester bonds are broken during the digestion of the triglyceride molecule through hydrolysis reactions consuming three water molecules per triglyceride hydrolysed.
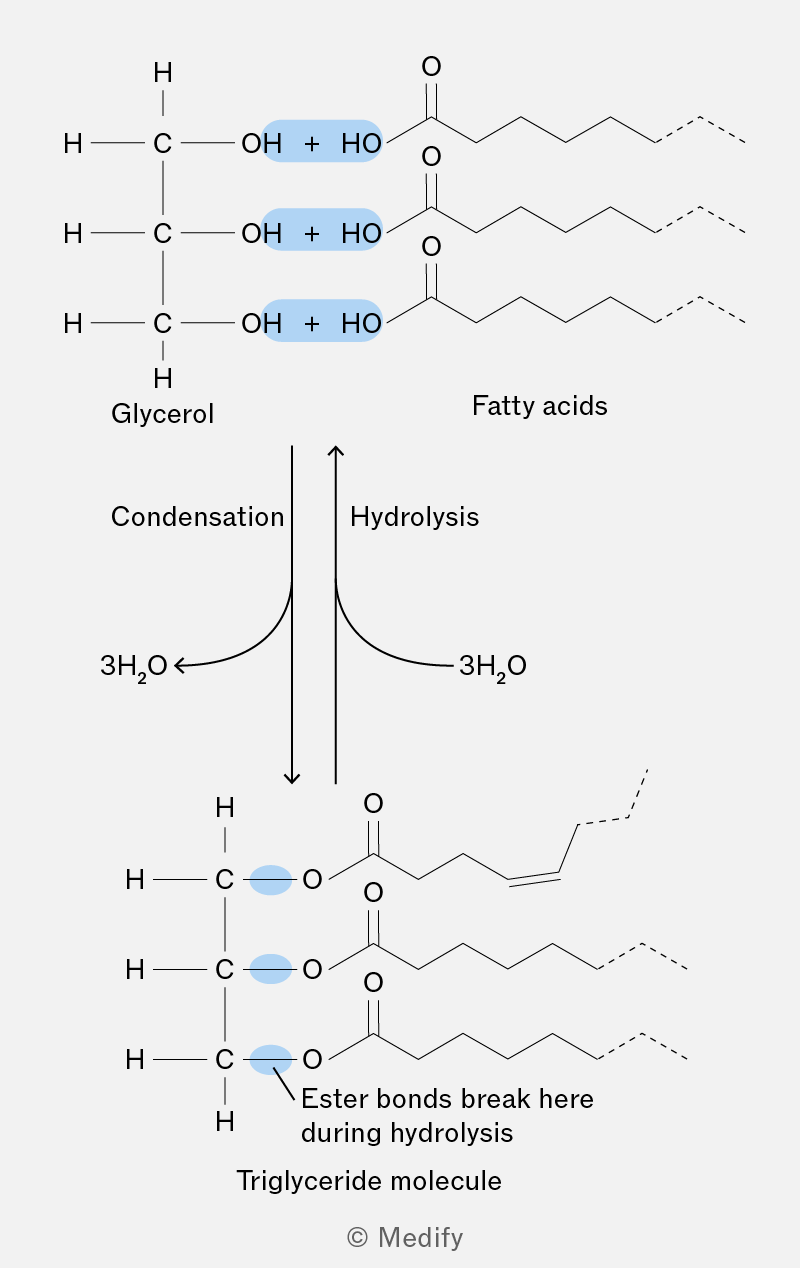
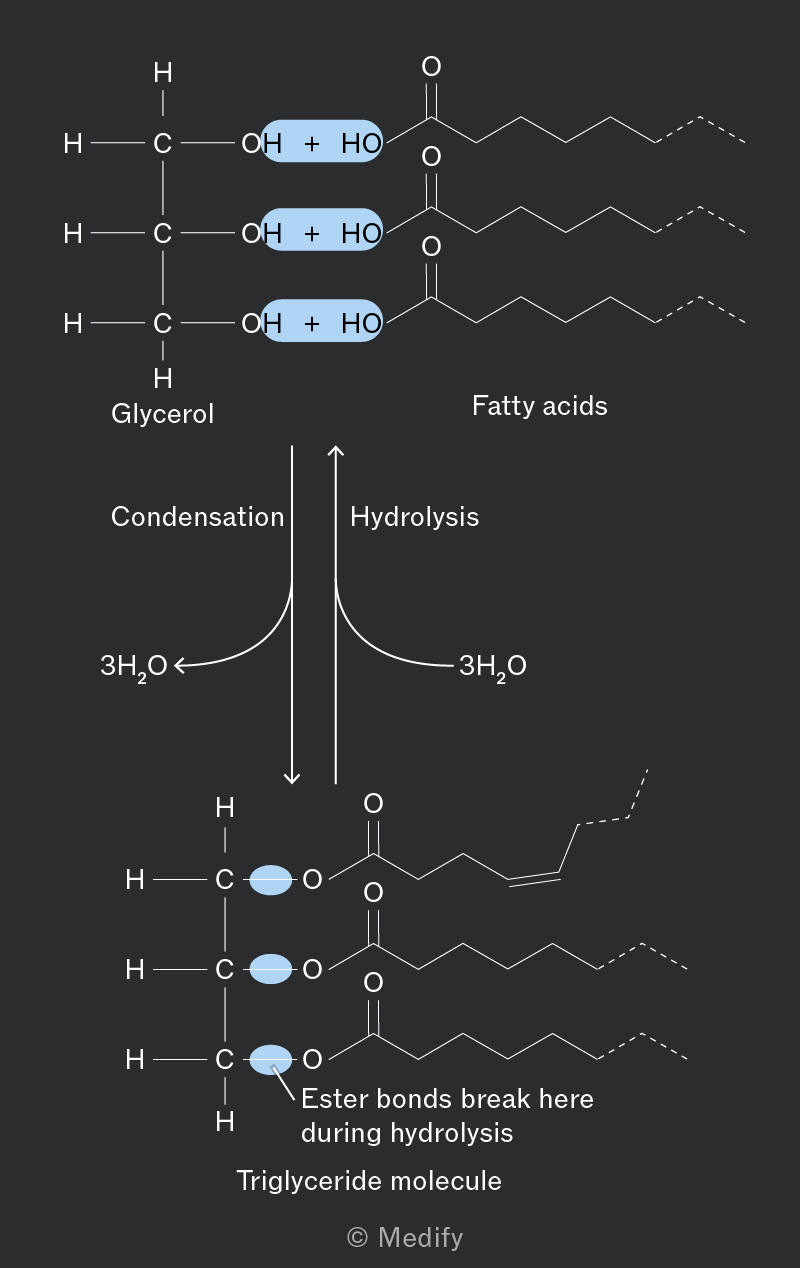
The image shows a chemical diagram illustrating the formation and breakdown of a triglyceride molecule. At the top, there are structures labeled 'Glycerol' and 'Fatty acids'. Glycerol is depicted with three hydroxyl (OH) groups, each paired with a plus sign and a hydroxyl group (HO) from the fatty acids, highlighted in blue. To the right, fatty acids are shown with long hydrocarbon chains and carboxyl groups (C=O). Below this, arrows labeled 'Condensation' and 'Hydrolysis' point downwards and upwards, respectively, with '3H2O' indicated for both processes. The bottom section shows a triglyceride molecule, where the glycerol and fatty acids are connected by ester bonds, highlighted in blue. An annotation states 'Ester bonds break here during hydrolysis'. The molecule is labeled 'Triglyceride molecule'.
Add to favourites

Fatty acids can differ in hydrocarbon chain length (R group) and in their saturation.

Saturated fatty acids have no double bonds. They form a straighter structure and pack tightly together, resulting in higher melting points and being in a solid state at room temperature. They are primarily found in animal fats.

Unsaturated fatty acids contain one (monounsaturated) or more (polyunsaturated) double bonds, leading to ‘kinks’ in the hydrocarbon chains that prevent tight packing. This lowers the melting point, so they are usually liquids at room temperature. They are typically found in vegetable oils.
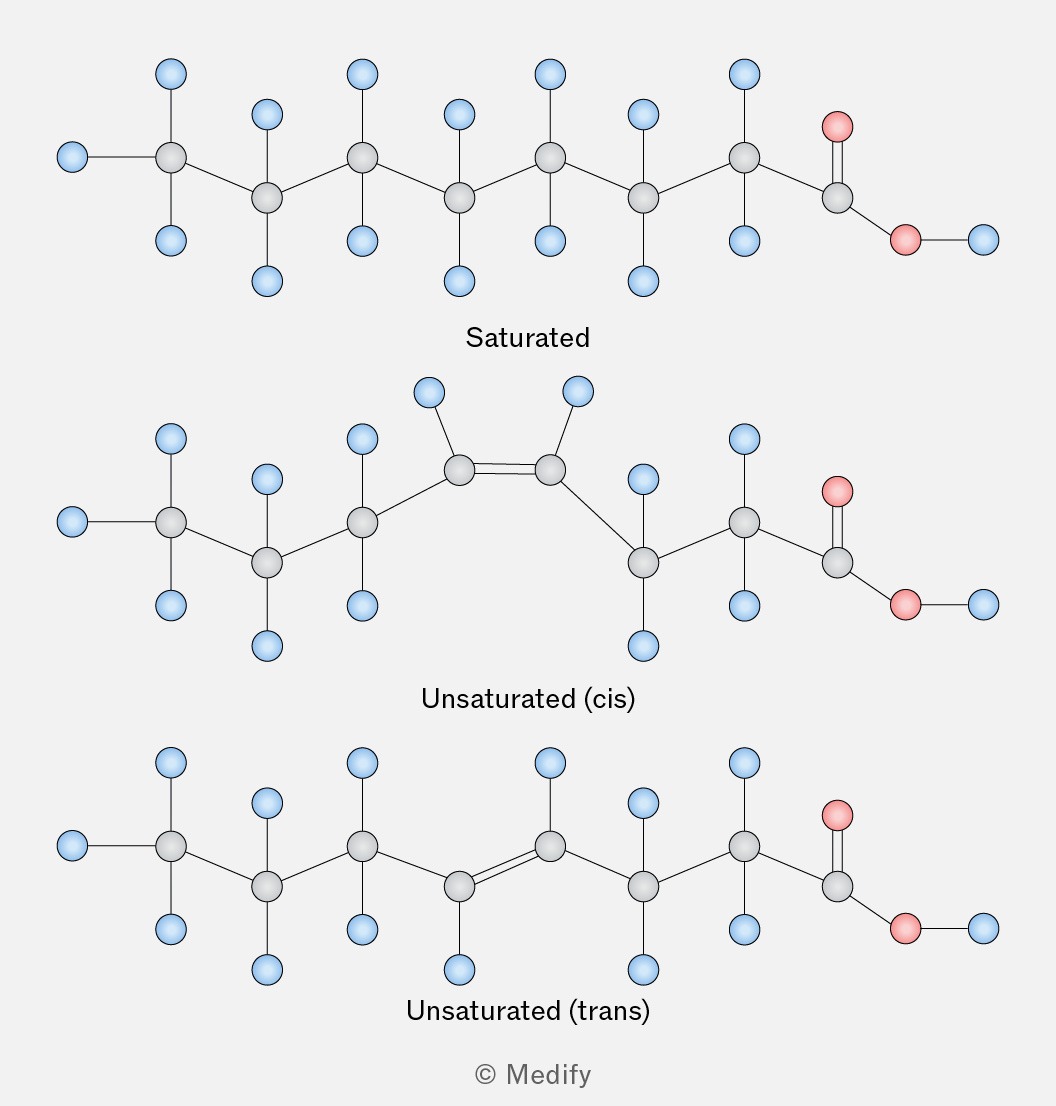
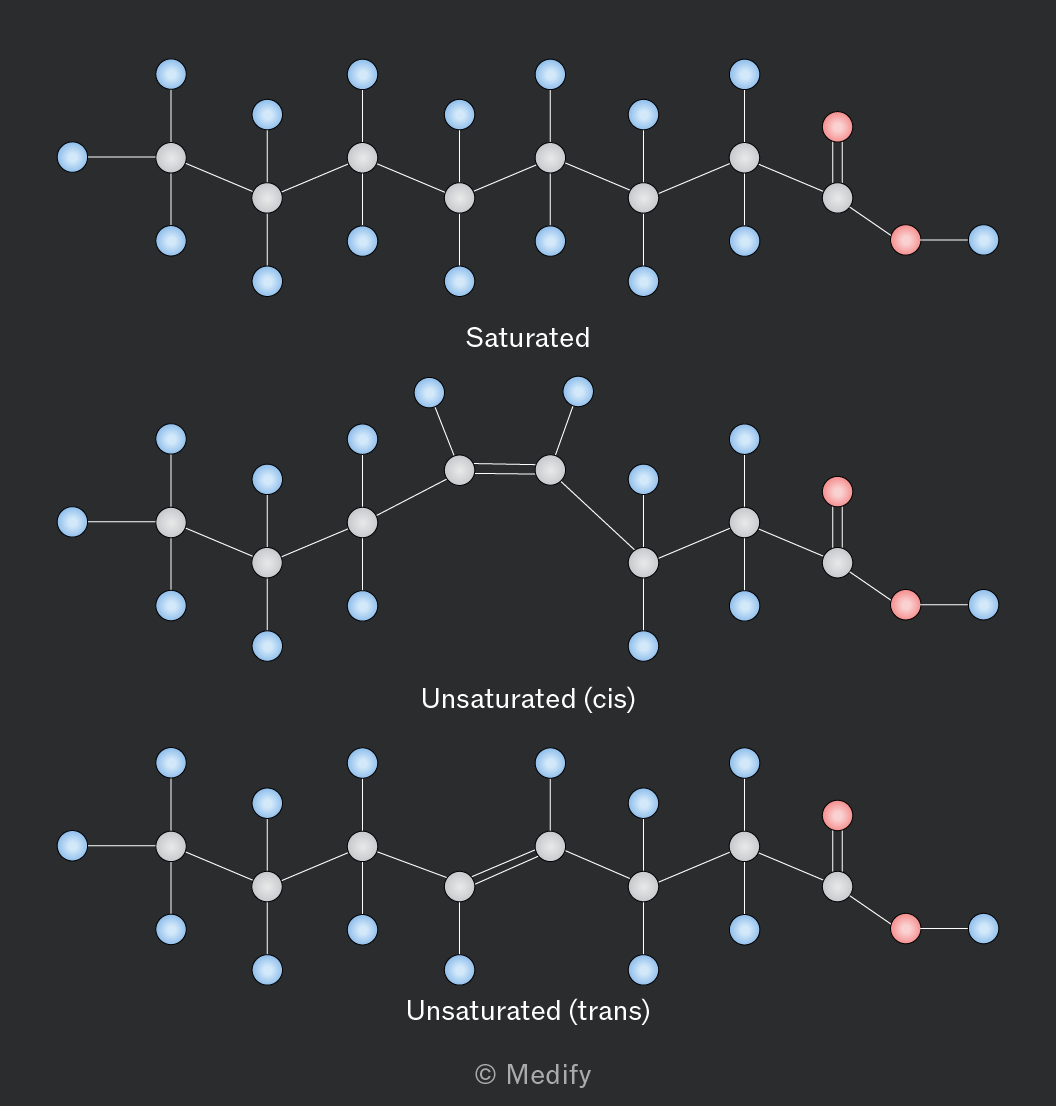
The image shows three chemical structures labeled as 'Saturated,' 'Unsaturated (cis),' and 'Unsaturated (trans).' The 'Saturated' structure is a linear chain of carbon atoms with single bonds, featuring hydrogen atoms (blue) and a carboxyl group (red) at one end. The 'Unsaturated (cis)' structure has a similar chain with one double bond creating a kink in the chain. The 'Unsaturated (trans)' structure also has a double bond but maintains a straighter chain due to the trans configuration. Each structure has labeled carbon and hydrogen atoms and a carboxyl group in red at the end.
Add to favourites

Phospholipids are essential components of cell membranes.

The structure of phospholipids is similar to triglycerides: glycerol plus two fatty acid chains and one phosphate. This results in a hydrophilic polar ‘head’ and two hydrophobic fatty acid ‘tails’.
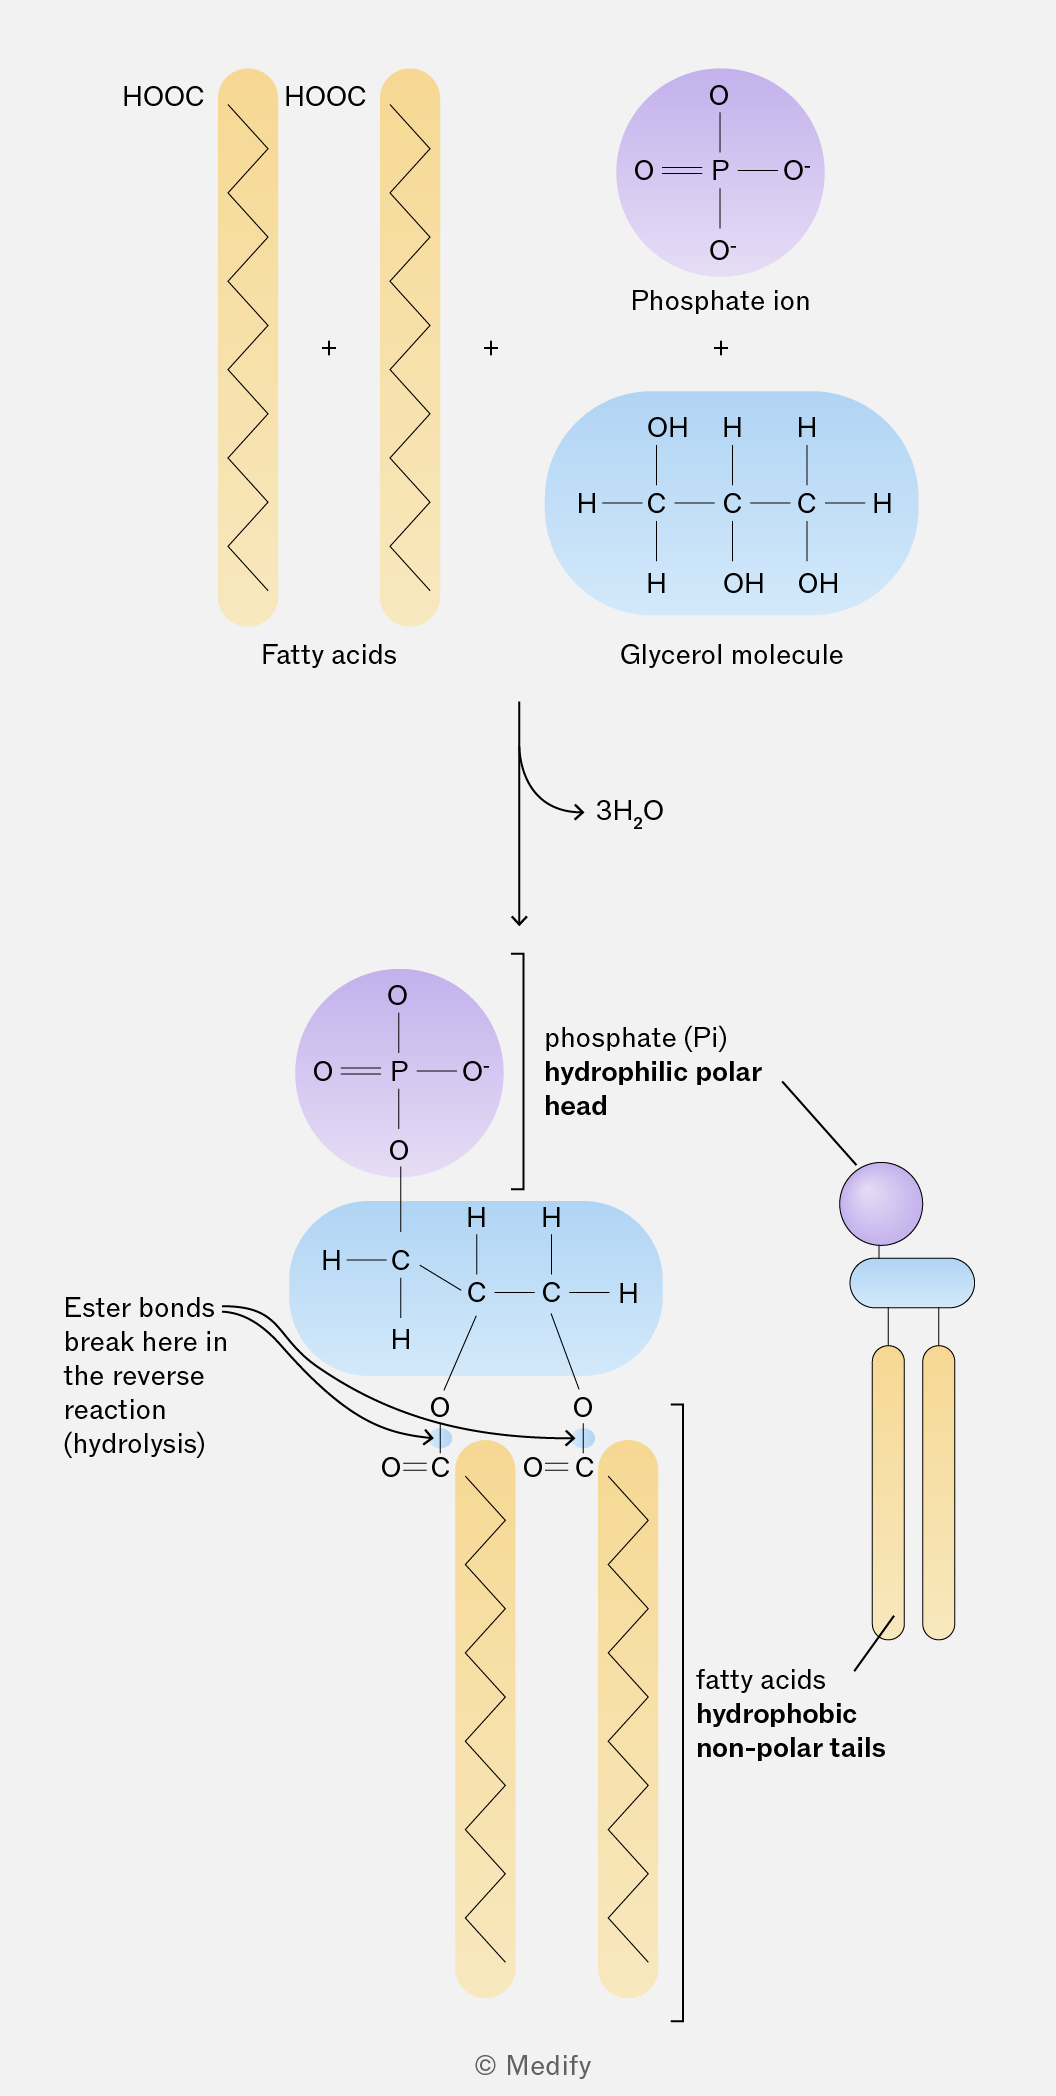
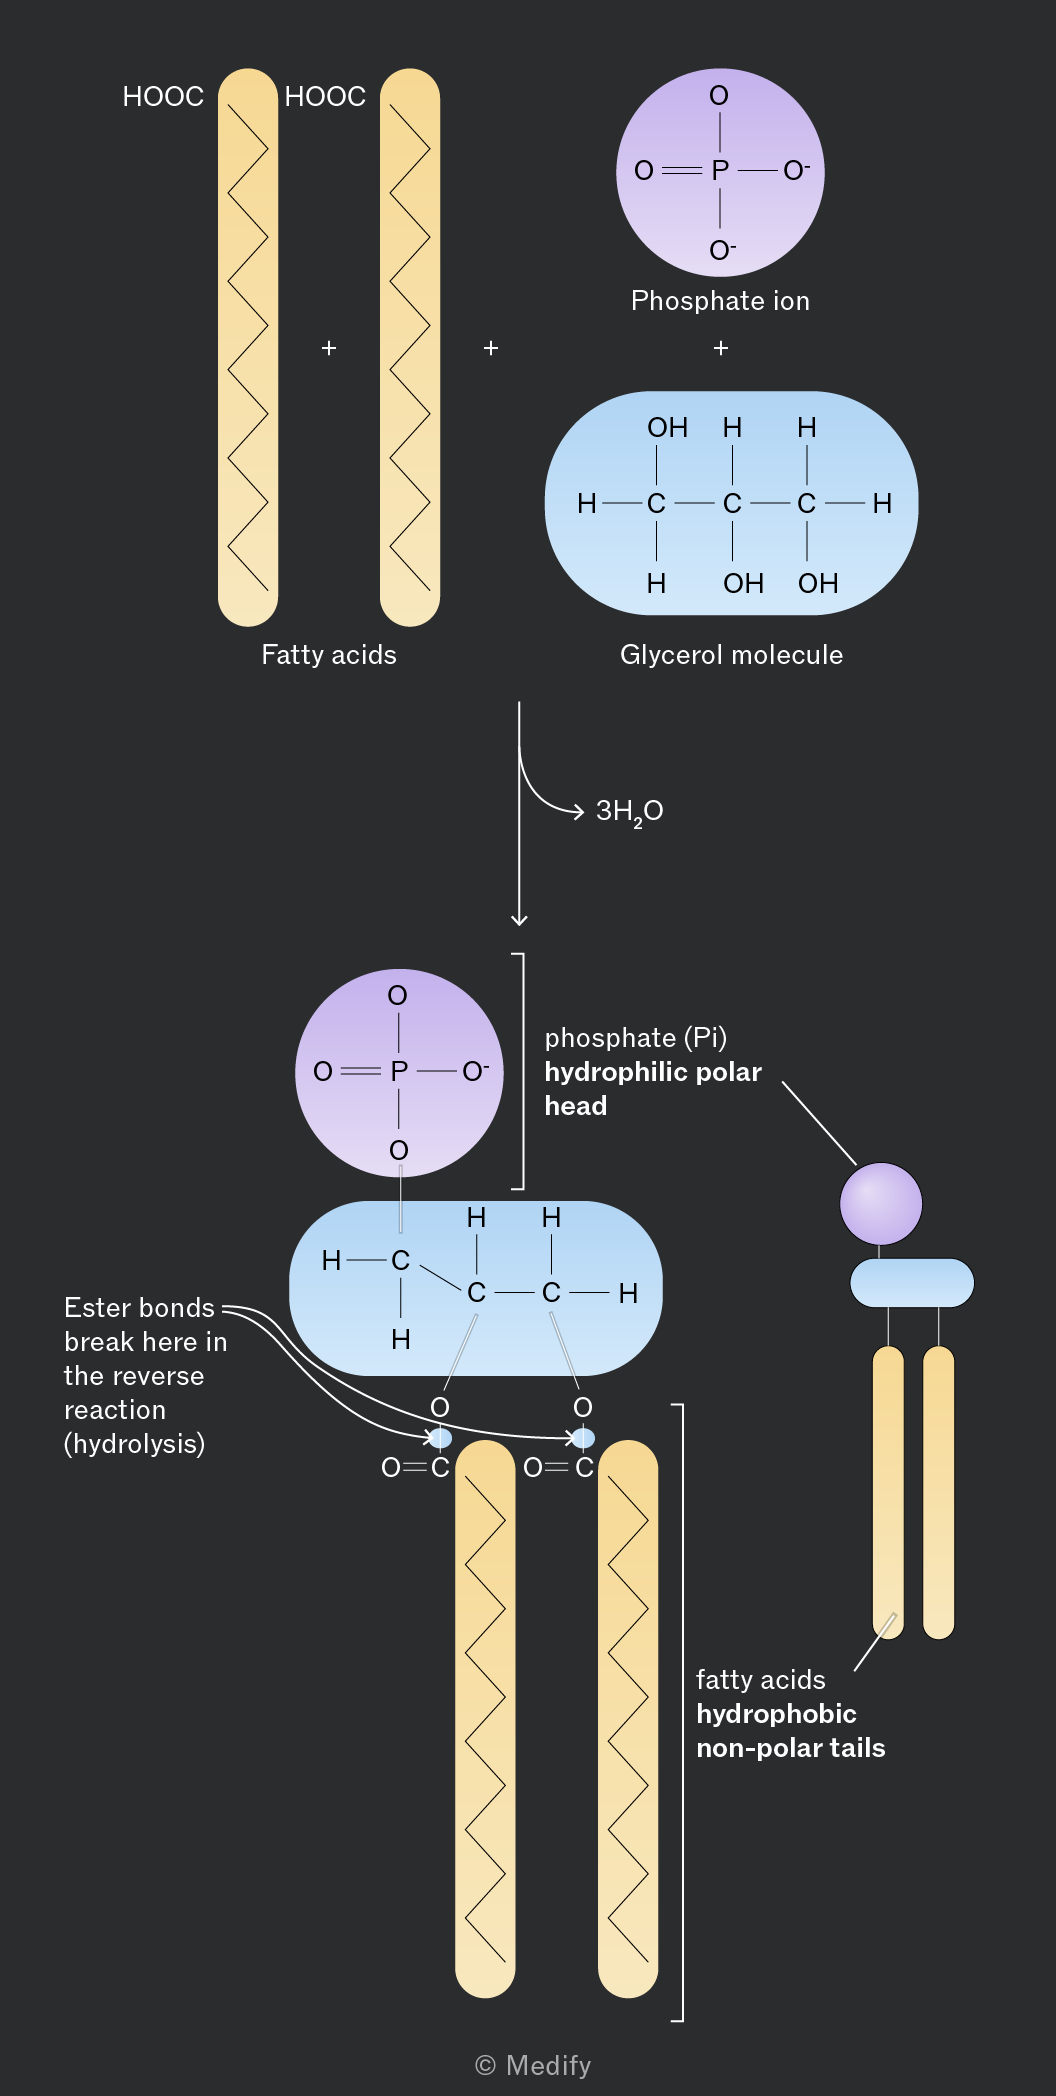
The image illustrates the formation of a phospholipid from fatty acids, a glycerol molecule, and a phosphate ion. On the left, two vertical yellow zigzag lines represent fatty acids labeled 'HOOC' at the top. To the right, a purple circle represents a phosphate ion with 'O', 'O-', and a double-bonded 'O' connected to 'P'. Below this is a blue oval representing a glycerol molecule, showing three carbon atoms bonded to hydroxyl groups ('OH') and hydrogen atoms ('H'). An arrow points downward to a combined structure: a phosphate group linked to the glycerol backbone with fatty acid chains attached. Annotations indicate 'Ester bonds break here in the reverse reaction (hydrolysis)', 'phosphate (Pi) hydrophilic polar head', and 'fatty acids hydrophobic non-polar tails'. A side illustration shows a simplified phospholipid with a purple circle head and two yellow tails. The reaction shows the release of '3H2O'.
Add to favourites

Phospholipids act as surfactants (surface-active agents) that reduce surface tension between immiscible substances such as oil and water.

Their hydrophilic phosphate heads interact with water, while their hydrophobic fatty acid tails interact with non-polar substances.
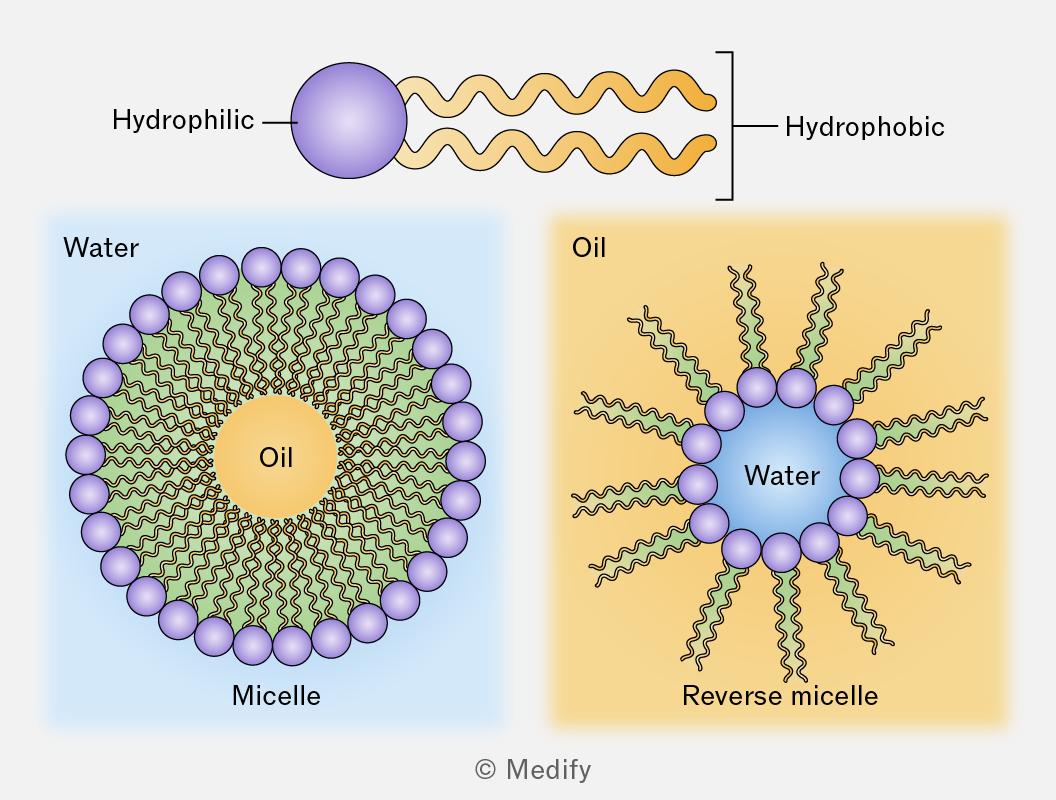
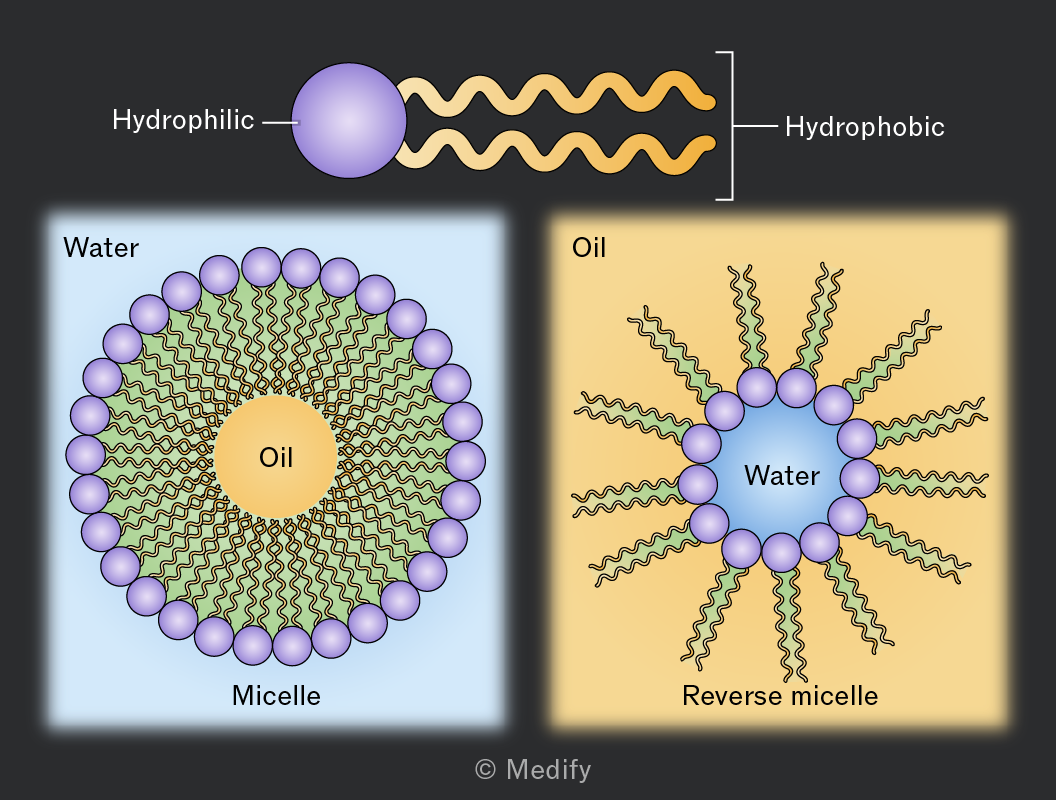
The image depicts a structure of a surfactant molecule with a hydrophilic head and hydrophobic tail. Below, there are two diagrams: on the left, a micelle in water with hydrophilic heads facing outward and oil in the center; on the right, a reverse micelle in oil with hydrophilic heads facing inward and water in the center. Both diagrams have labels indicating 'Water,' 'Oil,' 'Micelle,' and 'Reverse micelle.'
Add to favourites

Phospholipids are amphipathic. In aqueous environments, phospholipids spontaneously arrange into a bilayer with the hydrophilic heads facing outwards, facing the surrounding water and the hydrophobic tails facing inward. This arrangement forms the basic structure of cell-surface membranes.
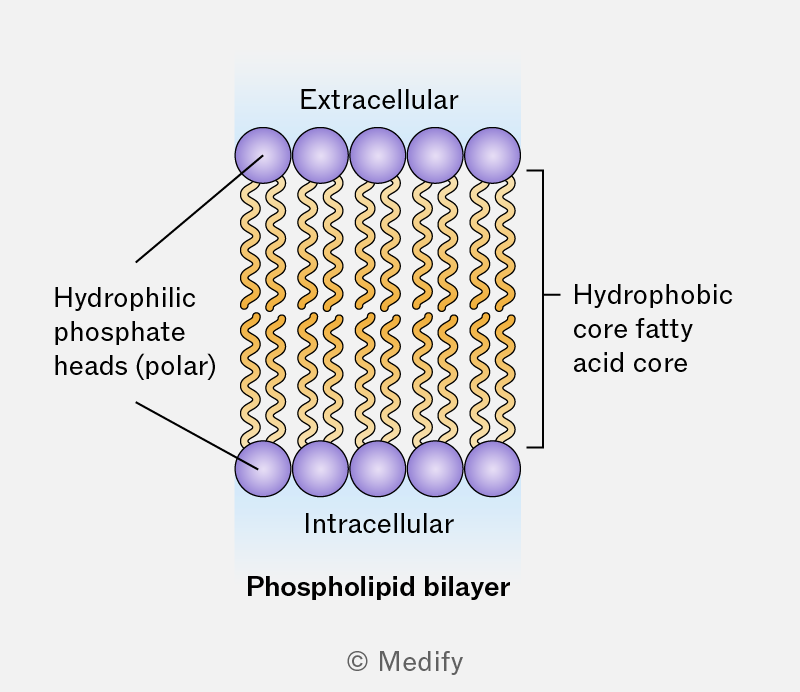
The image illustrates a phospholipid bilayer. At the top, it is labeled 'Extracellular', and at the bottom, 'Intracellular' with a light blue background. The bilayer consists of two rows of purple circles representing hydrophilic phosphate heads, labeled on the left as 'Hydrophilic phosphate heads (polar)'. The interior of the bilayer shows orange wavy lines indicating the hydrophobic core fatty acid tails, labeled on the right as 'Hydrophobic core fatty acid core'. The entire structure is labeled below as 'Phospholipid bilayer'.
Add to favourites

Cholesterol is a sterol, a bulky organic molecule with an alcohol functional group, found within the phospholipid bilayer of cell membranes.
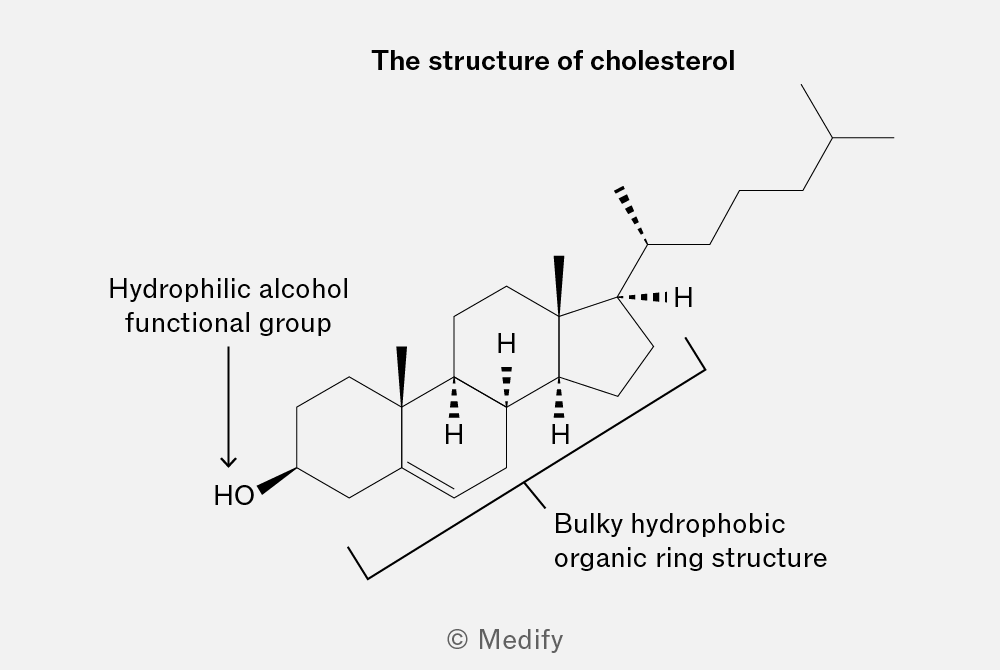
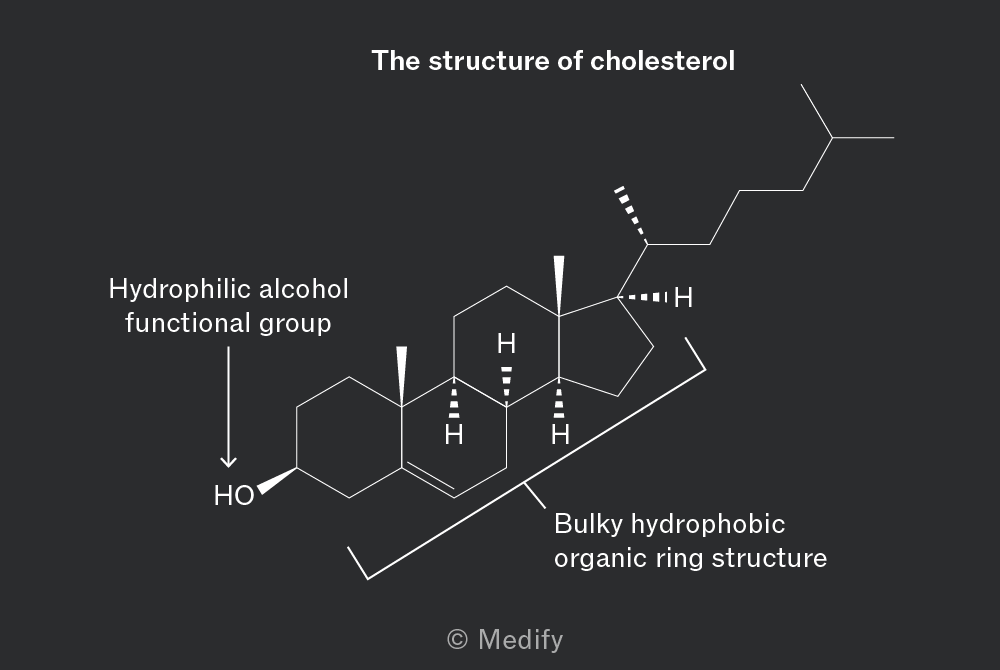
The image shows the chemical structure of cholesterol. It is a complex organic molecule with a bulky hydrophobic organic ring structure and a hydrocarbon tail. The structure includes a hydrophilic alcohol functional group labeled 'HO' at the end of the ring structure. There are labels indicating 'Hydrophilic alcohol functional group' pointing to the hydroxyl group and 'Bulky hydrophobic organic ring structure' pointing to the main ring system. Hydrogen atoms are shown at certain positions with solid and dashed lines indicating stereochemistry. The title at the top reads 'The structure of cholesterol.'

Cholesterol is amphipathic with a hydrophilic hydroxyl group and hydrophobic steroid rings. It fits between phospholipids in animal cell membranes, helping maintain membrane stability and fluidity by preventing excessive movement at high temperatures and tight packing at low temperatures.

Cholesterol is also a precursor of steroid hormones, vitamin D and bile salts.

Add to favourites

Triglycerides are energy storage molecules with a high energy density due to their many carbon–hydrogen bonds.

They are insoluble, so can be stored without affecting water potential. Plants often store triglycerides as oils, while animals store them as fat in adipose tissue.

They also provide thermal insulation, protection and buoyancy. Oxidation of triglycerides releases metabolic water, which is important in some desert animals.

Add to favourites

Amino acids are the monomers from which polypeptides and proteins are made.

Polypeptides are linear chains of more than two amino acids, whereas proteins consist of one or more polypeptides folded into a specific 3D functional structure.

Add to favourites

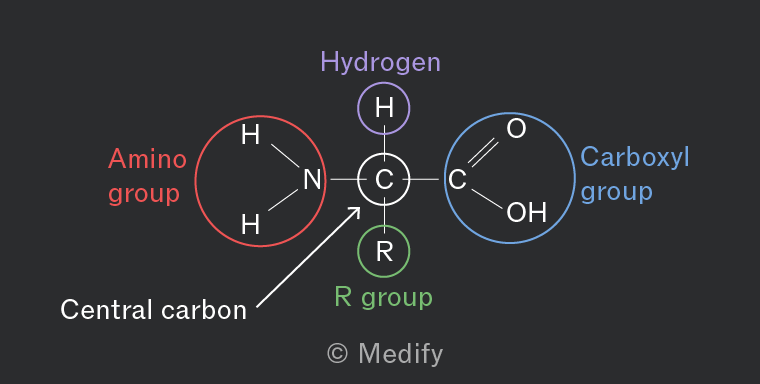
Amino acids contain a central carbon atom, attached to a hydrogen atom, an amino group (), a carboxylic acid group () and a variable side chain group (R group).

There are 20 amino acids common to all organisms and they differ only by their R group.

Essential amino acids come from the diet and non-essential ones can be synthesized in the body.
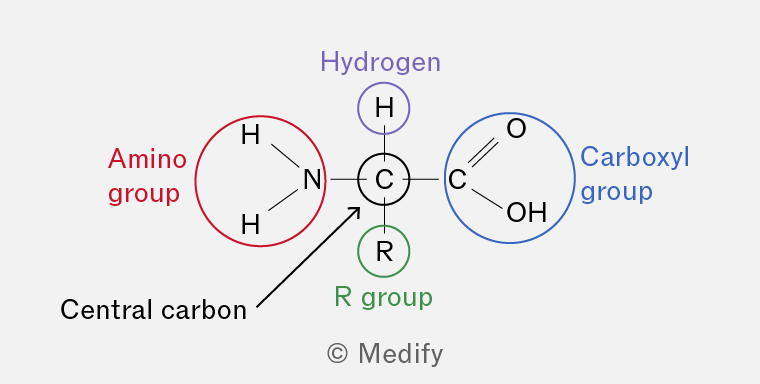
The image shows a structural diagram of an amino acid with a central carbon atom labeled 'Central carbon'. The central carbon is connected to four groups: an amino group, a hydrogen atom, a carboxyl group, and an R group. The amino group, labeled in red as 'Amino group', consists of a nitrogen atom bonded to two hydrogen atoms. The hydrogen atom is labeled in purple as 'Hydrogen'. The carboxyl group, labeled in blue as 'Carboxyl group', consists of a carbon atom double-bonded to an oxygen atom and single-bonded to a hydroxyl group (OH). The R group is labeled in green as 'R group'.
Add to favourites

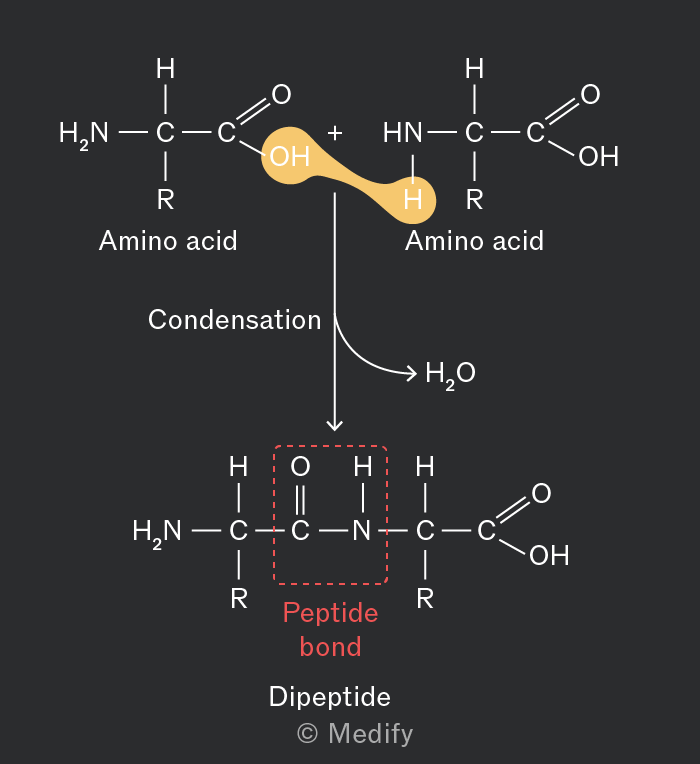
Polypeptides are formed when amino acid monomers are linked to each other during condensation reactions by peptide bonds (strong covalent bonds).

The peptide bond is formed between the carboxyl group of one amino acid and the amino group of another amino acid.

The reaction is catalysed by peptidyl transferase.
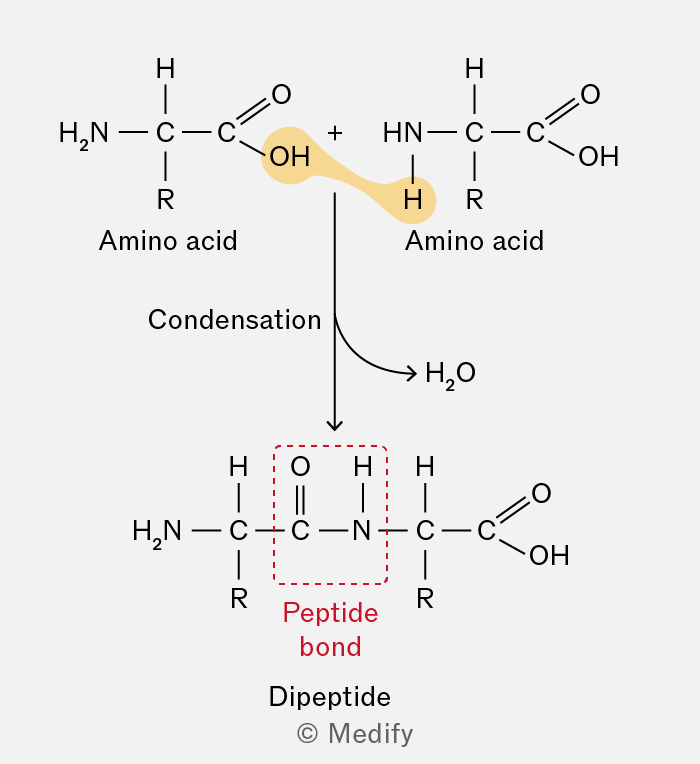
The image shows a chemical reaction diagram of two amino acids undergoing condensation to form a dipeptide. At the top, two amino acids are depicted. The left amino acid has the structure: H2N-C(R)-C(=O)-OH, and the right amino acid has the structure: HN-C(R)-C(=O)-OH. The 'R' represents a side chain. A highlighted bond between the OH group of the left amino acid and the H of the NH group of the right amino acid, indicating water (H2O) is removed. The label ‘Condensation’ with an arrow points downward to a dipeptide structure. The dipeptide has the structure: H2N-C(R)-C(=O)-NH-C(R)-C(=O)-OH. A red dashed box highlights the peptide bond between C(=O) and NH, labeled ‘Peptide bond’ in red. The term 'Dipeptide' is labeled below the structure. An arrow points to 'H2O', indicating the removal of water. The diagram includes the text labels 'Amino acid', 'Condensation', 'Peptide bond', and 'Dipeptide'.
Add to favourites

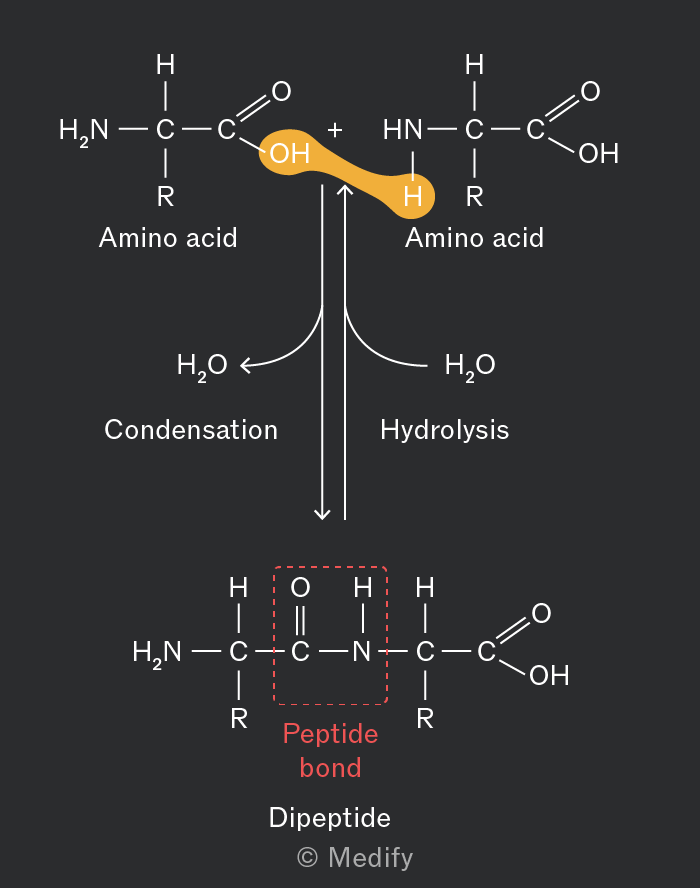
Peptide bonds can be broken down by hydrolysis reactions. These reactions use one molecule of water to break the covalent peptide bond between two amino acid monomers.

This reaction is catalysed by proteases.
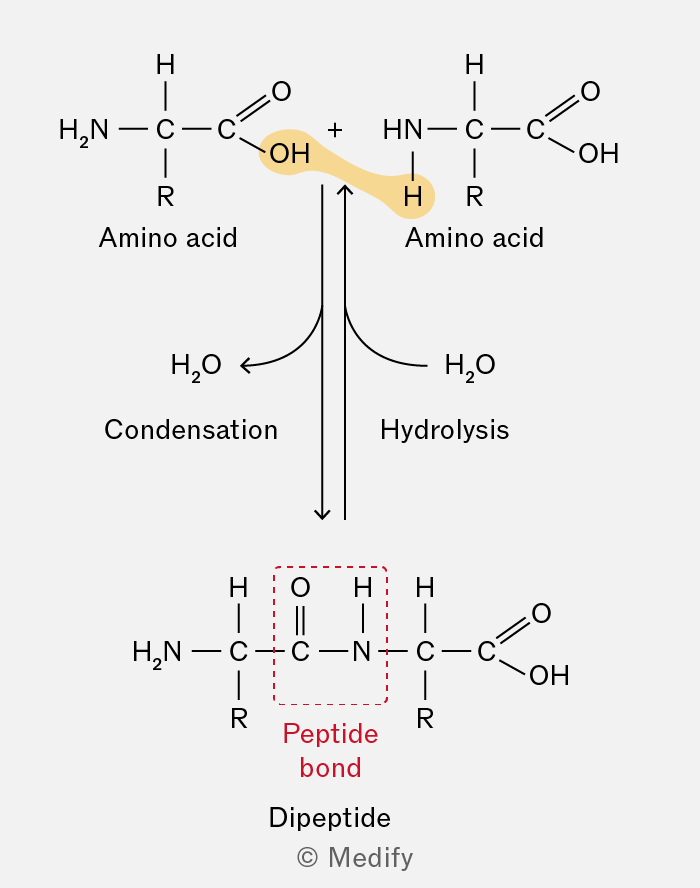
The image shows a chemical reaction between two amino acids forming a dipeptide through condensation and breaking it through hydrolysis. On the top left, an amino acid is depicted with the structure: H2N-CHR-C(=O)OH, labeled 'Amino acid'. On the top right, another identical amino acid structure is shown. An arrow labeled 'Condensation' points downward, showing the removal of H2O (depicted between the amino acids) to form the dipeptide. Below, the dipeptide structure is displayed: H2N-CHR-C(=O)-NH-CHR-C(=O)OH, with a red dashed box labeled 'Peptide bond' highlighting the bond between C(=O) and NH. Another arrow labeled 'Hydrolysis' points upward from the dipeptide, indicating the addition of H2O to break the bond back into two amino acids.
Add to favourites

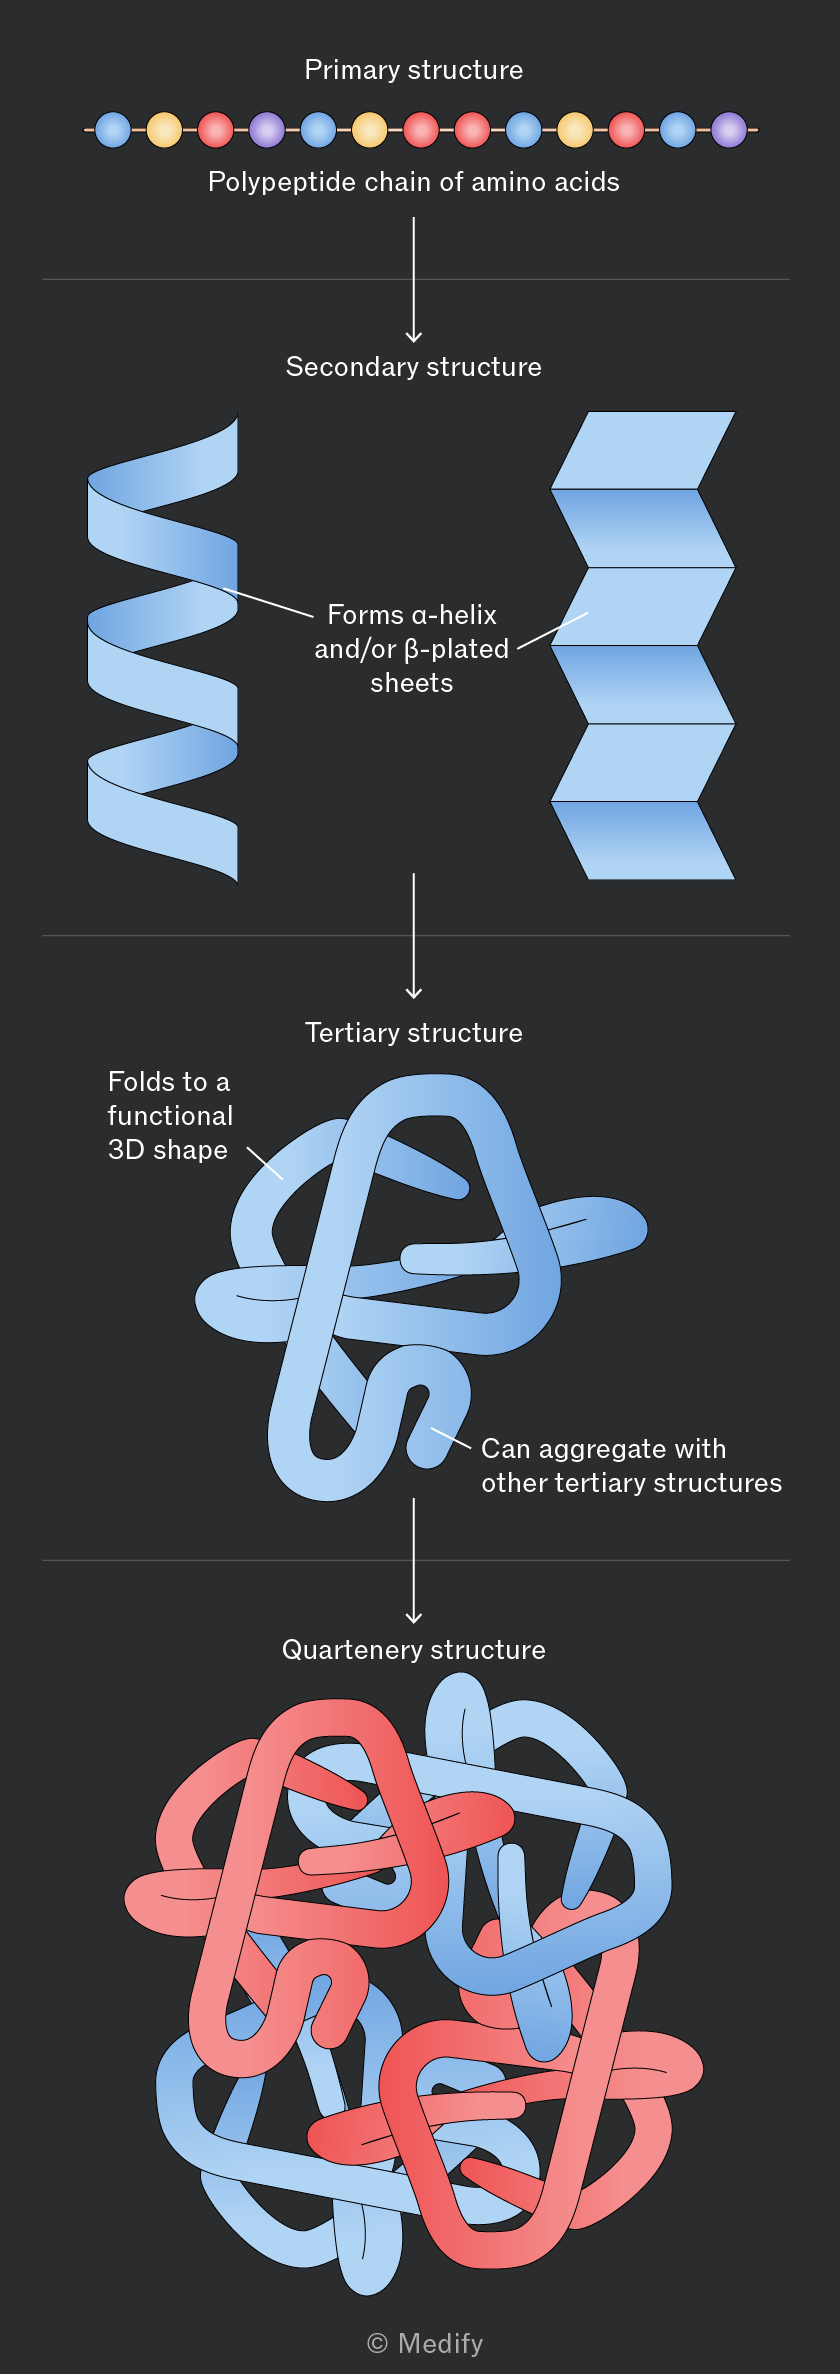
There are four levels of protein structure:
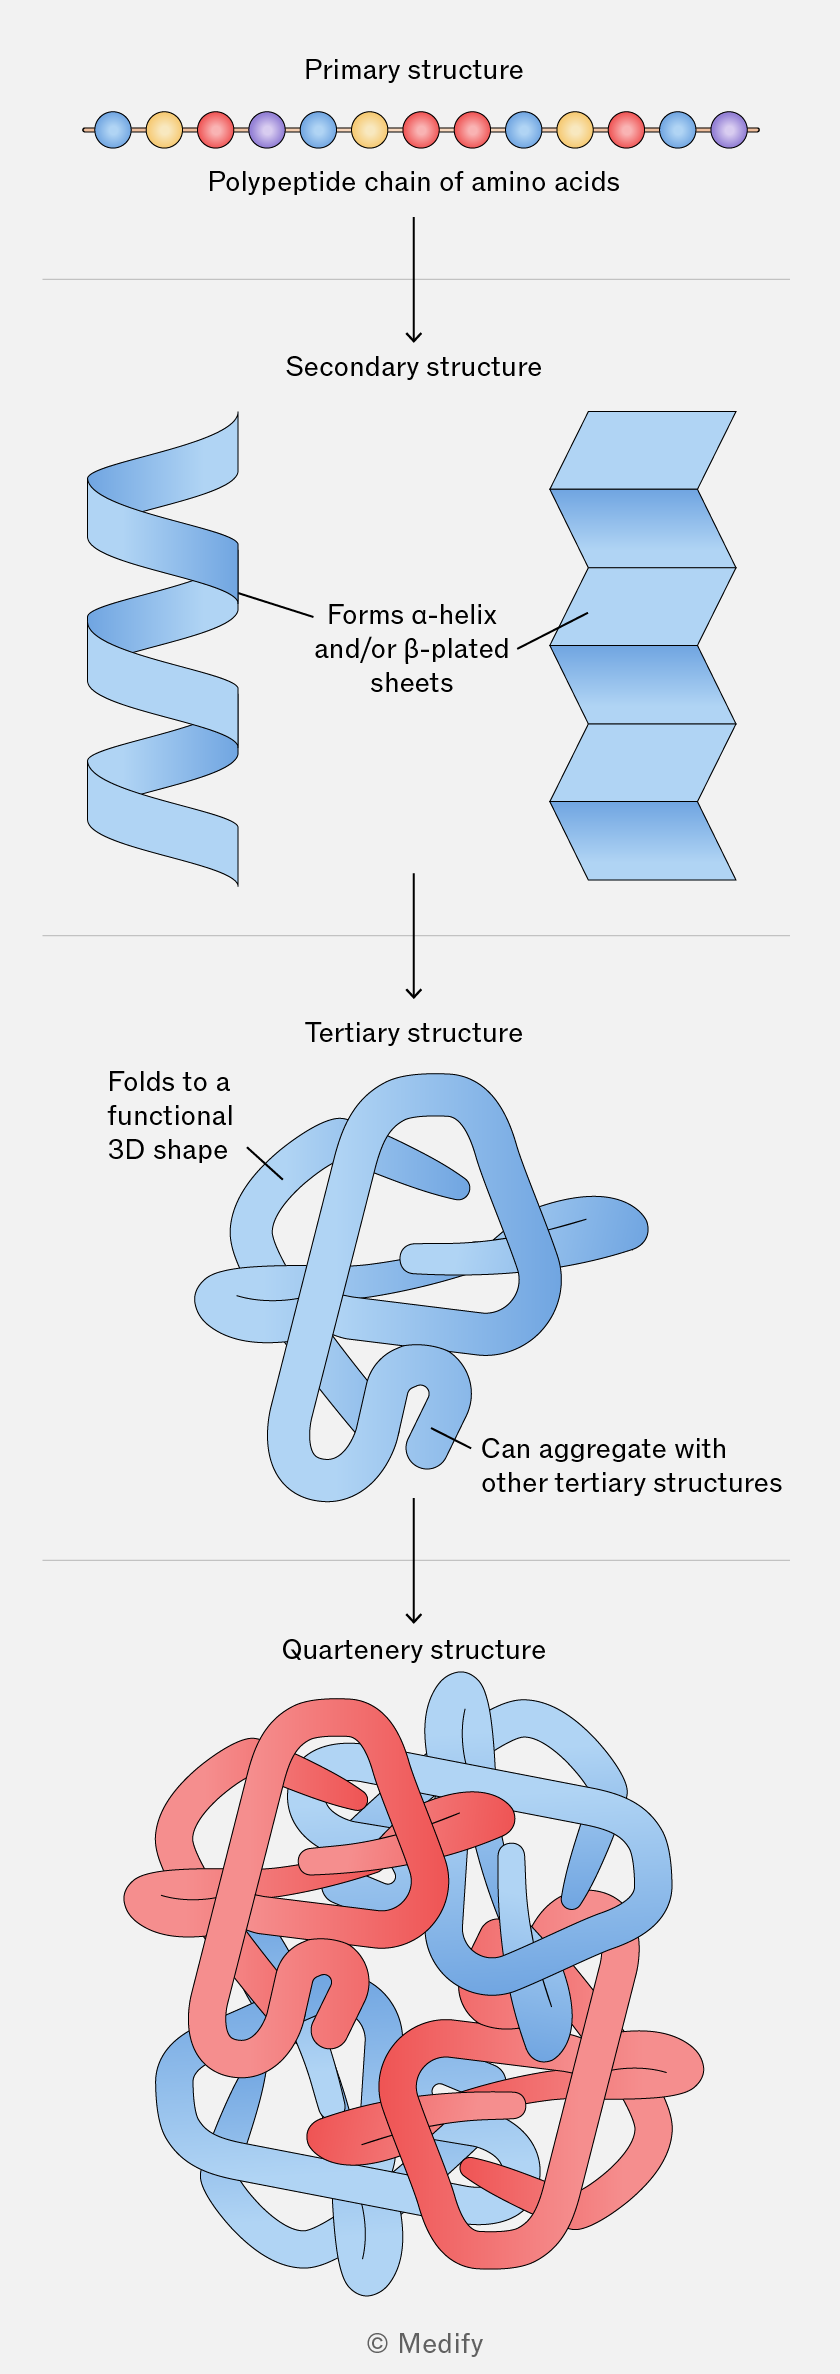
Diagram illustrating the four levels of protein structure. At the top is the 'Primary structure', shown as a linear 'Polypeptide chain of amino acids' with colored circles. An arrow points down to the 'Secondary structure', featuring a blue alpha-helix and beta-plated sheet with the label 'Forms α-helix and/or β-plated sheets'. Another arrow points down to the 'Tertiary structure', depicting a blue folded shape labeled 'Folds to a functional 3D shape'. A further arrow leads to the 'Quaternary structure', showing a complex of intertwined red and blue shapes labeled 'Can aggregate with other tertiary structures'. The diagram is credited to © Medify.
Add to favourites

Primary structure refers to the specific sequence and number of amino acids in a polypeptide chain, determined by the DNA base sequence.

This linear sequence determines how the protein folds into its three-dimensional structure and therefore its function. A change in the amino acid sequence can alter the protein’s structure and affect its function.
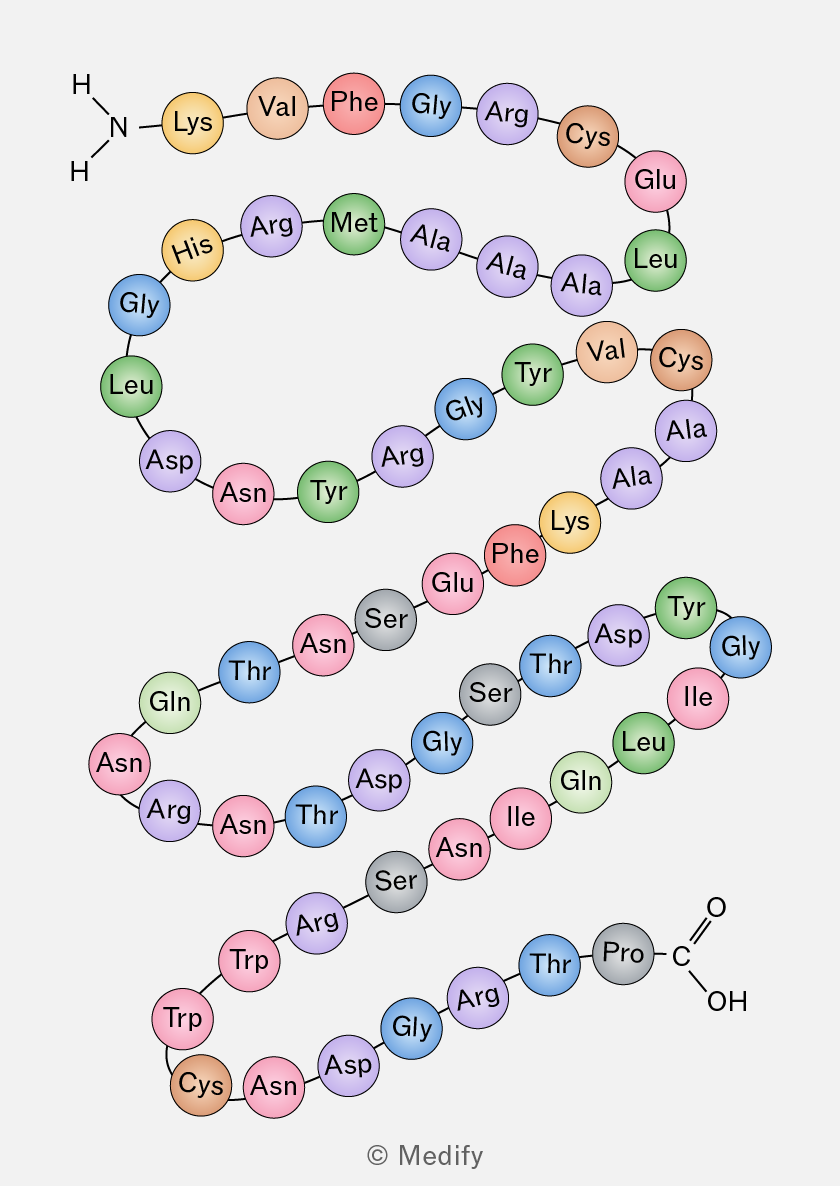
A diagram of a protein structure showing a sequence of amino acids represented as colored circles connected by lines. The sequence starts with an NH2 group and includes the following amino acids: Lys, Val, Phe, Gly, Arg, Cys, Glu, Leu, Ala, Ala, Ala, Met, Arg, His, Gly, Leu, Asp, Asn, Tyr, Arg, Gly, Tyr, Val, Cys, Ala, Ala, Lys, Phe, Glu, Ser, Asn, Thr, Asn, Gln, Leu, Ile, Gly, Asp, Tyr, Ser, Thr, Ser, Gly, Asp, Thr, Asn, Arg, Asn, Gln, Leu, Ile, Gly, Thr, Arg, Gly, Thr, Pro, Cys, Asn, Asp, Gly, Arg, Trp, Trp, and ends with a COOH group.
Add to favourites

Secondary structure refers to the localised folding of a polypeptide chain into -helices and -pleated sheets

In an -helix, hydrogen bonds form between atoms in the polypeptide backbone, causing the chain to coil into a spiral.

In a -pleated sheet, several polypeptide chains lie parallel to one another and are held together by hydrogen bonds. These hydrogen bonds stabilise the secondary structure of the protein.
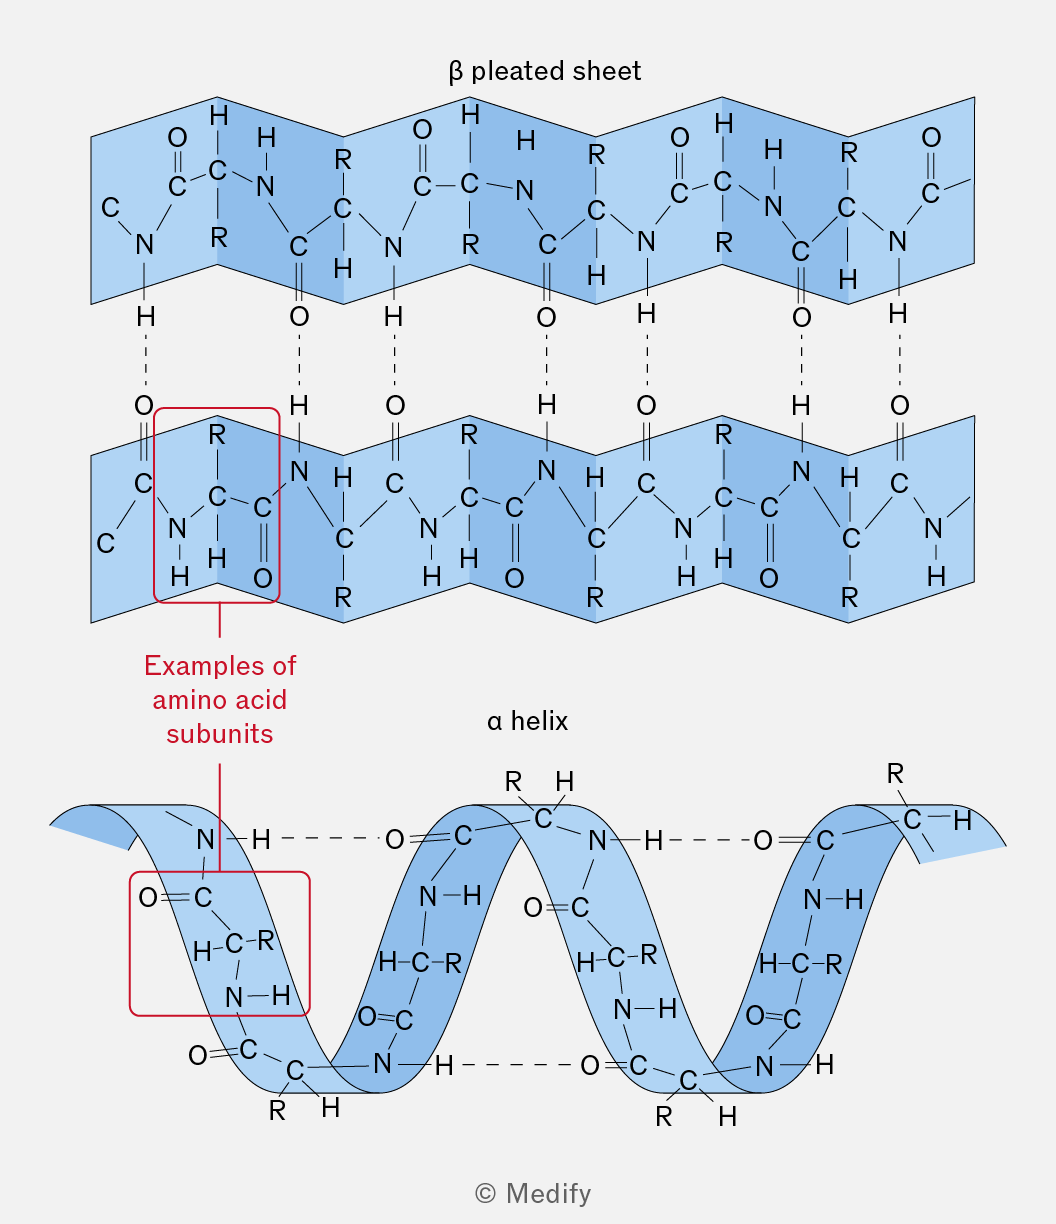
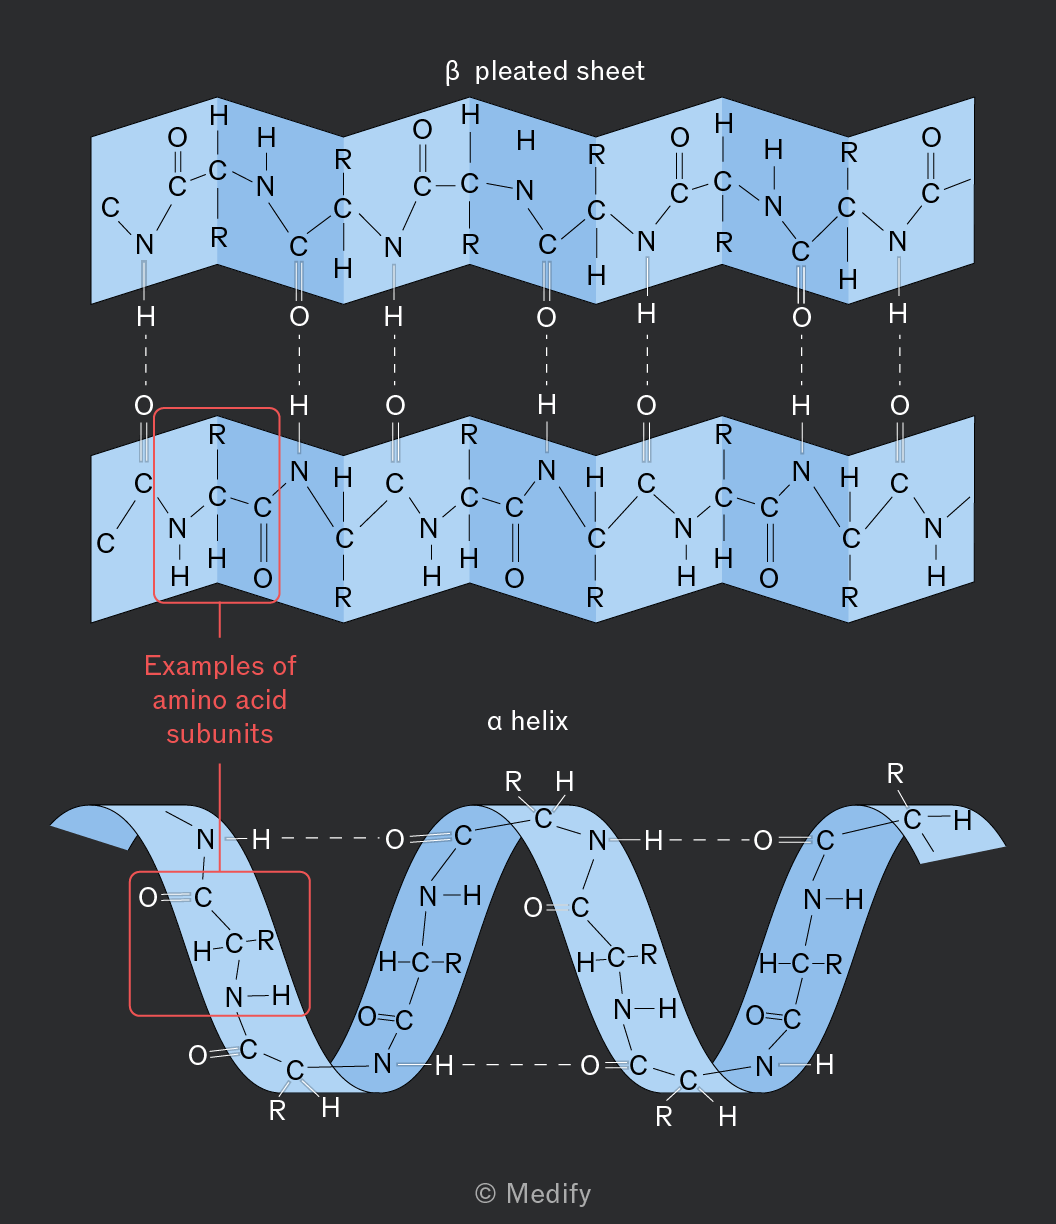
The image shows two diagrams representing protein structures. The top diagram is labeled 'β pleated sheet' and consists of two parallel zigzag patterns. Each zigzag pattern includes repeating units with nitrogen (N), carbon (C), hydrogen (H), and oxygen (O) atoms, connected by dashed lines representing hydrogen bonds. An annotation on the left highlights a section labeled 'Examples of amino acid subunits' with a red box around one of the repeating units. The bottom diagram is labeled 'α helix' and features a coiled ribbon structure. The coil is composed of similar repeating units with N, C, H, and O atoms, with dashed lines indicating bonds. Both diagrams contain labels for atomic groups, such as 'R' for side chains, and show the characteristic folding patterns of secondary protein structures.
Add to favourites

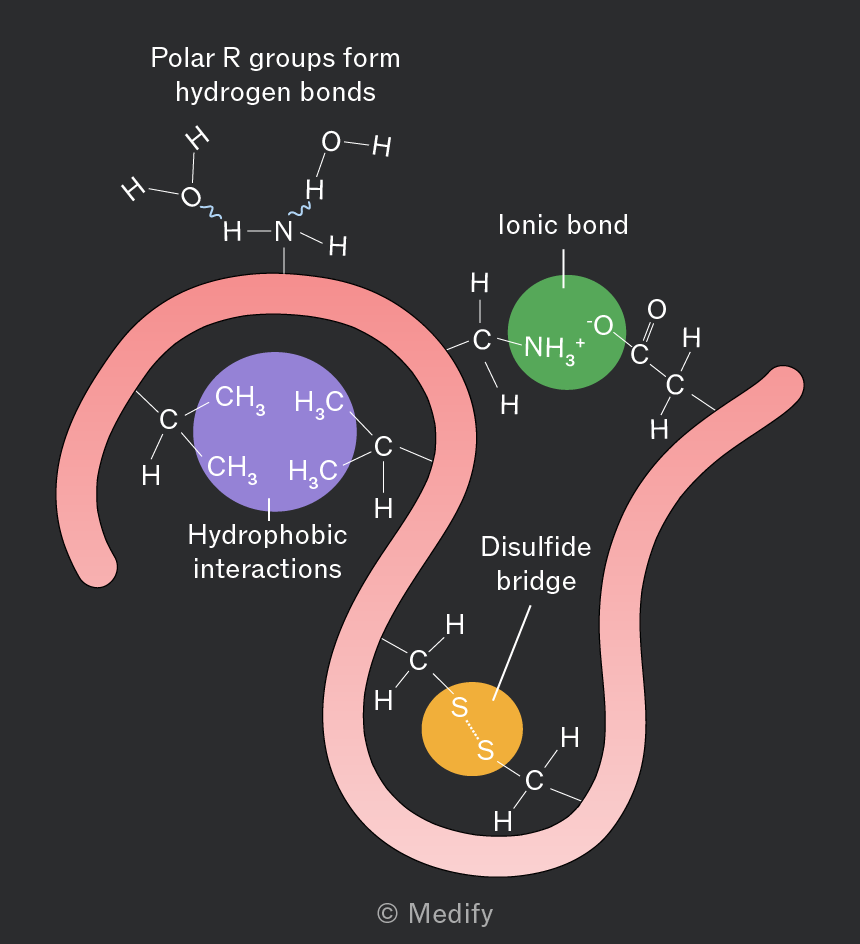
Tertiary structure is the overall three-dimensional shape of a protein, determined by interactions between the R groups of amino acids. The shape of a protein is closely related to its function.

Tertiary structure is stabilised by:

  • Hydrogen bonds between polar R groups.
  • Ionic bonds between oppositely charged R groups (impacted by ).
  • Disulfide bonds / bridges are covalent bonds between cysteine residues (impacted by ).
  • Hydrophobic interactions, where non-polar R groups cluster together away from water.
  • Hydrophilic interactions, where polar R groups are attracted to water and orientate towards the outside of the protein.
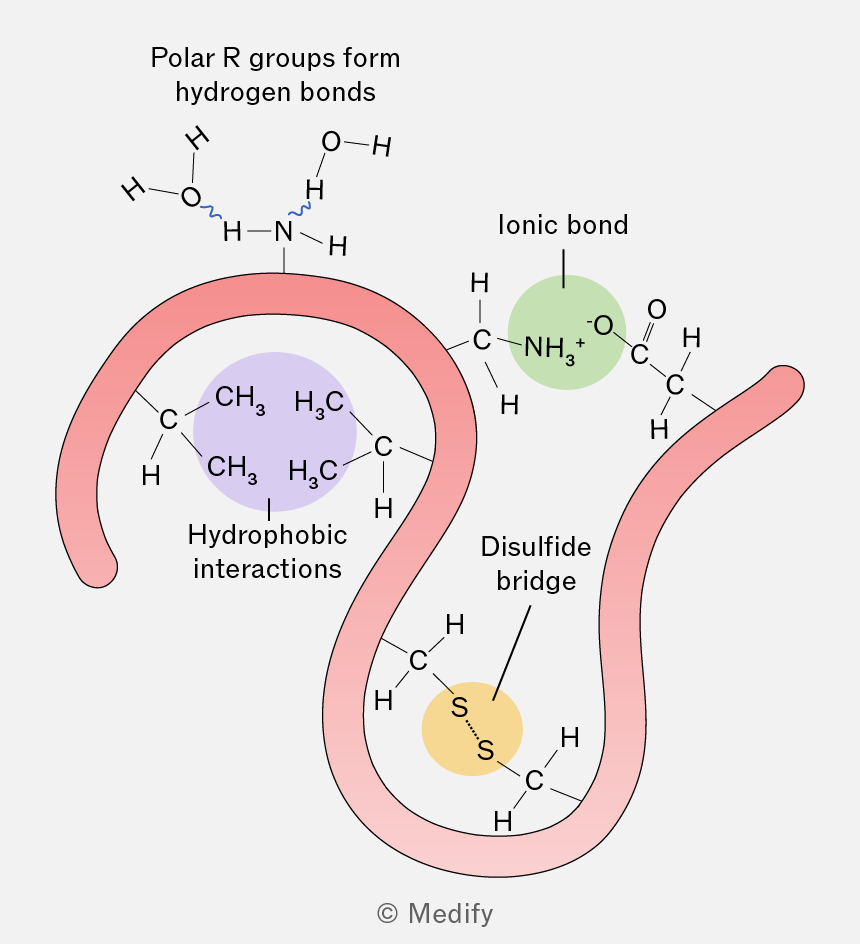
The image illustrates different types of interactions within a protein structure. At the top, there is a depiction of polar R groups forming hydrogen bonds, shown with a hydrogen bond between an OH group and an NH group. On the left, a purple circle labeled 'Hydrophobic interactions' encloses two CH3 groups bonded to a central carbon atom. In the center, a green circle labeled 'Ionic bond' shows an NH3+ group interacting with an O- group. On the right, a yellow circle labeled 'Disulfide bridge' shows two sulfur atoms (S) bonded together. The protein backbone is represented by a pink ribbon winding through these interactions.
Add to favourites

Quaternary structure occurs when two or more polypeptide chains (which may be identical or different) associate to form a functional protein.

The subunits are held together by the same interactions found in tertiary structure (hydrogen bonds, ionic bonds, disulfide bonds and hydrophobic / hydrophilic interactions), but these occur between polypeptides rather than within one polypeptide.

For example, haemoglobin consists of two -globin and two -globin subunits and is only functional when all four polypeptides are associated.

Add to favourites

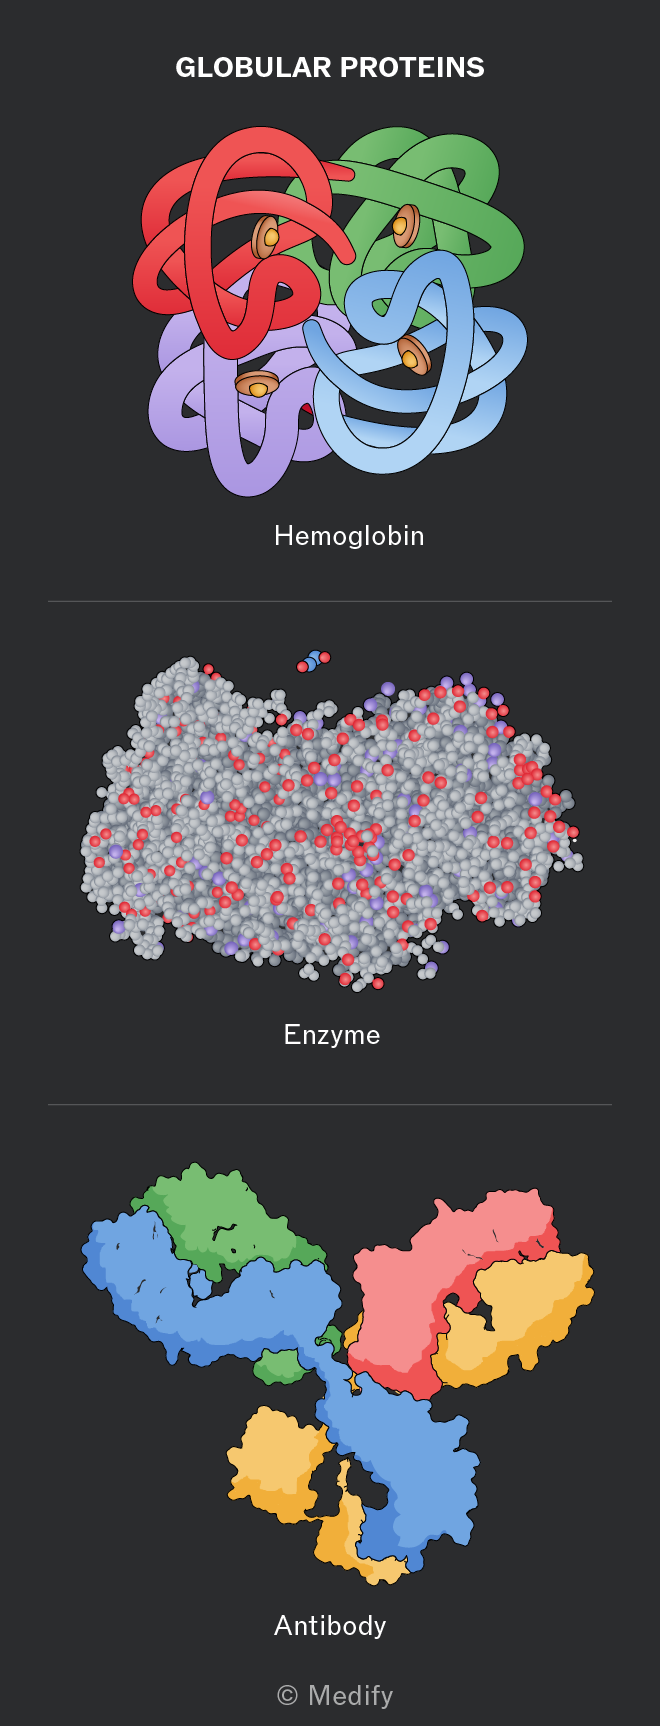
Globular proteins are compact, roughly spherical in shape, and soluble in water meaning that they can be transported in the circulatory system.

Examples include haemoglobin, enzymes and antibodies.
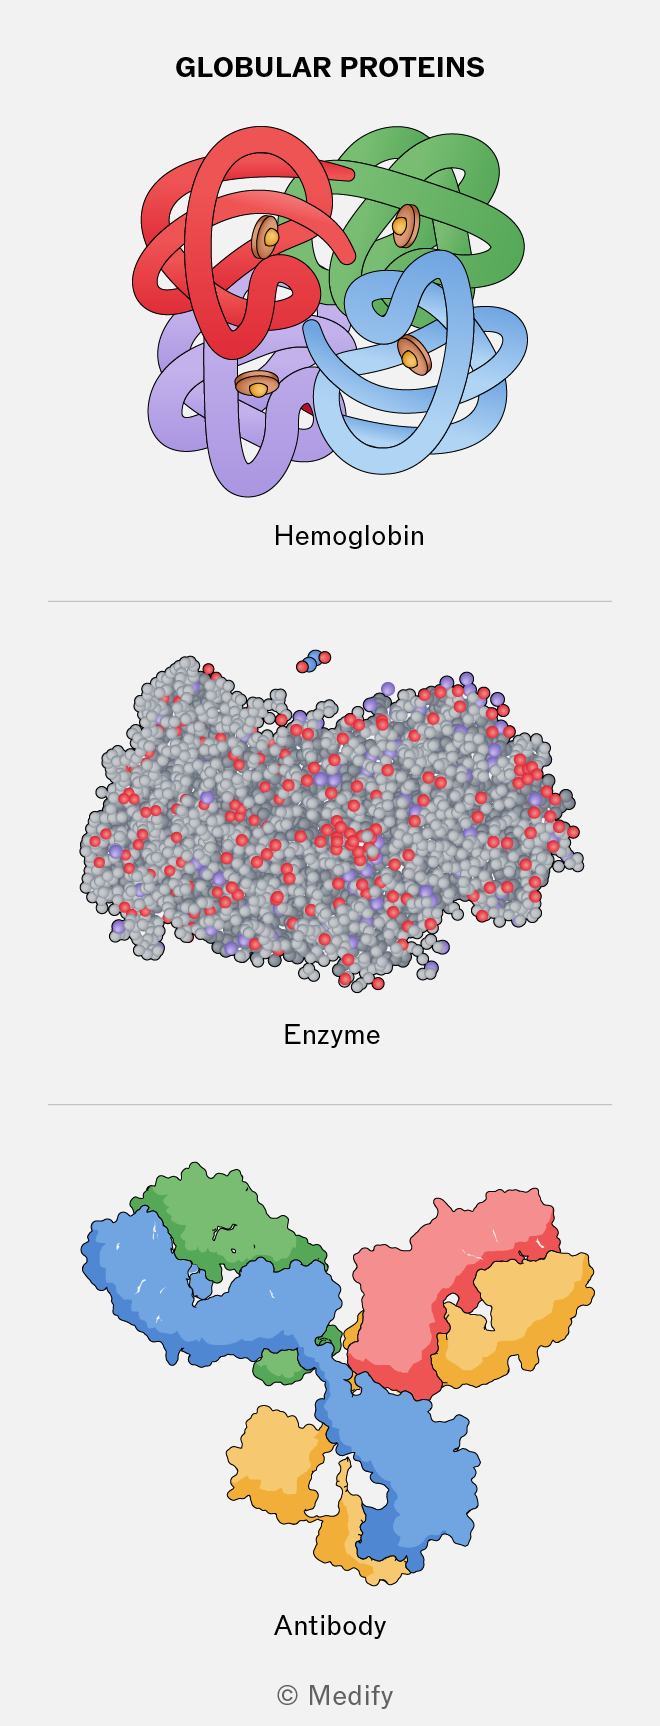
The image shows three illustrations of globular proteins. At the top, labeled 'Hemoglobin,' is a multicolored, knot-like structure with interwoven ribbons in red, green, blue, and purple, with small brown circular elements. In the middle, labeled 'Enzyme,' is a densely packed cluster of gray spheres with red and purple highlights. At the bottom, labeled 'Antibody,' is a structure with interconnected regions in blue, green, red, and yellow, forming a Y-shaped configuration. The title at the top reads 'GLOBULAR PROTEINS' and the bottom is marked © Medify.
Add to favourites

Insulin is a globular protein produced in the pancreas and is essential for regulating blood glucose levels. It is compact, soluble structure allows it to be transported in the blood, and its specific three-dimensional shape enables it to bind to complementary receptors on target cells.
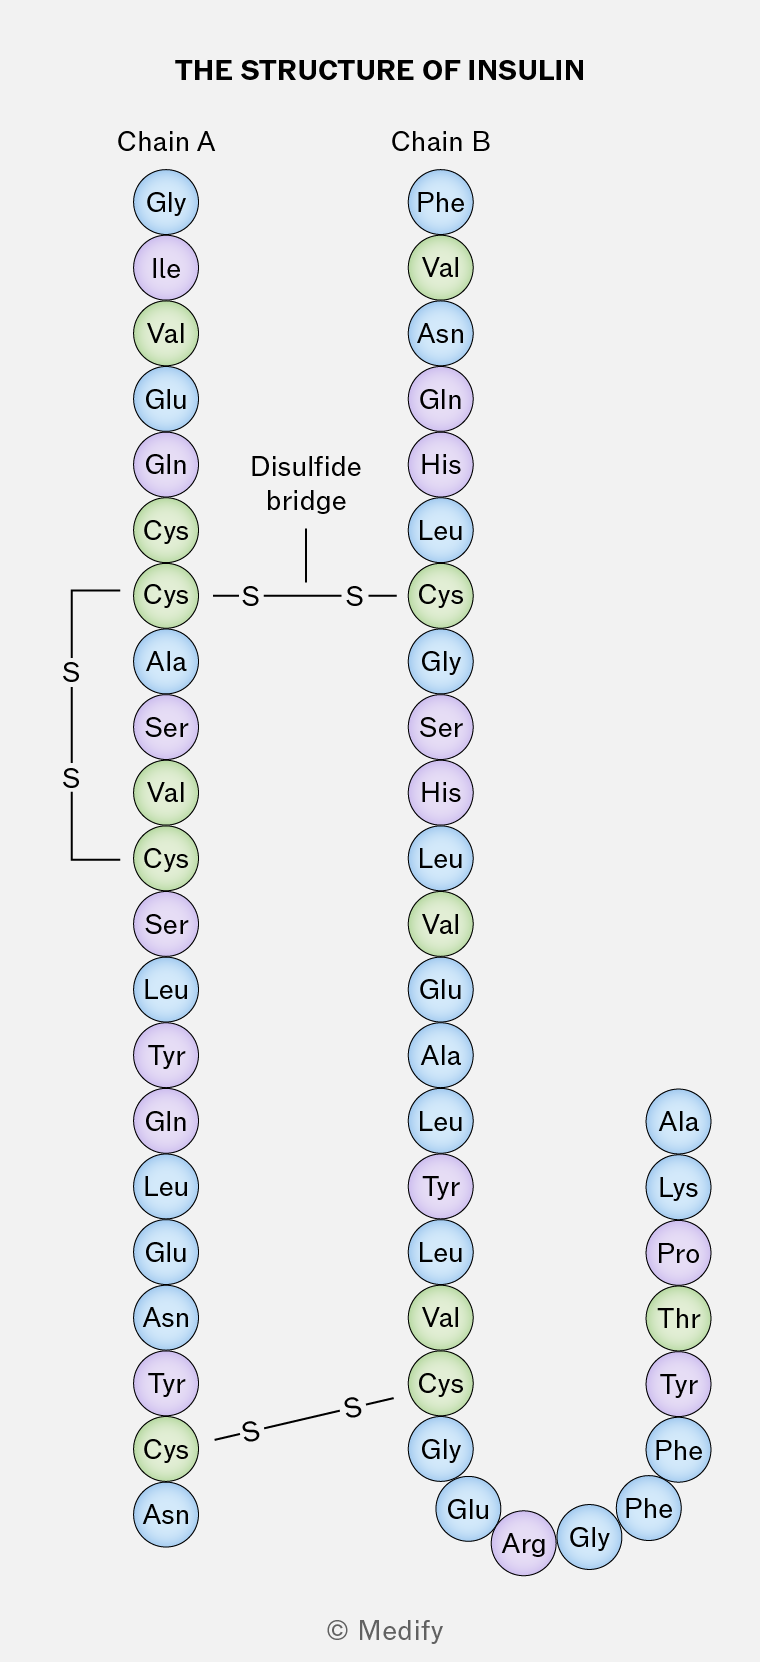
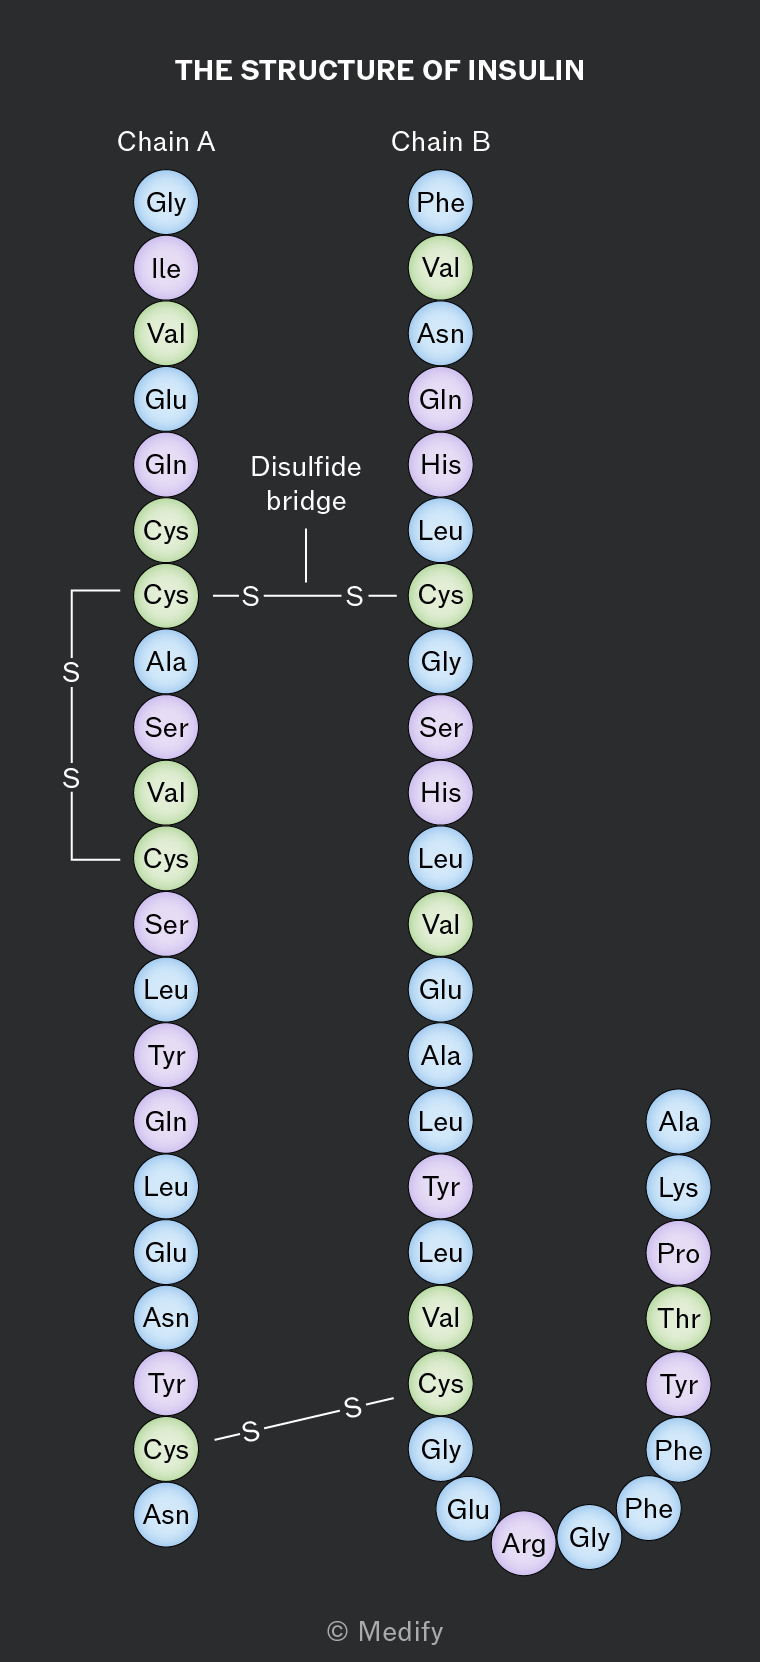
The image depicts the structure of insulin with two chains labeled 'Chain A' and 'Chain B'. Chain A consists of amino acids starting from Glycine (Gly) at the top, followed by Isoleucine (Ile), Valine (Val), Glutamic acid (Glu), Glutamine (Gln), two Cysteines (Cys), Alanine (Ala), Serine (Ser), Valine (Val), Cysteine (Cys), Serine (Ser), Leucine (Leu), Tyrosine (Tyr), Glutamine (Gln), Leucine (Leu), Glutamic acid (Glu), Asparagine (Asn), Tyrosine (Tyr), Cysteine (Cys), and Asparagine (Asn) at the bottom. Chain B starts with Phenylalanine (Phe) at the top, followed by Valine (Val), Asparagine (Asn), Glutamine (Gln), Histidine (His), Leucine (Leu), Cysteine (Cys), Glycine (Gly), Serine (Ser), Histidine (His), Leucine (Leu), Valine (Val), Glutamic acid (Glu), Alanine (Ala), Leucine (Leu), Tyrosine (Tyr), Leucine (Leu), Valine (Val), Cysteine (Cys), Glycine (Gly), Glutamic acid (Glu), Arginine (Arg), Glycine (Gly), Phenylalanine (Phe), Phenylalanine (Phe), Tyrosine (Tyr), Threonine (Thr), Proline (Pro), Lysine (Lys), and Alanine (Ala) at the bottom. The chains are connected by disulfide bridges, indicated by lines labeled 'S', with one labeled as 'Disulfide bridge' between two Cysteine residues.
Add to favourites

Conjugated proteins are globular proteins which require a non-protein component, such as a cofactor or prosthetic group, to function.

Haemoglobin is a conjugated protein because it contains the prosthetic group haem: a ring shaped organic molecule which binds to iron.

Lipoproteins are conjugated proteins containing lipid and protein elements. Similarly, glycoproteins contain a carbohydrate element.

Add to favourites

Haemoglobin is a conjugated protein with a quaternary structure. It is found in red blood cells and consists of two and two polypeptide chains. Each subunit contains a haem group. The haem groups give blood its distinctive red colour.

Haemoglobin’s function is to carry oxygen in the blood. Oxygen reversibly binds to the ion in the haem group. Each haem group bonds with one oxygen molecule, therefore haemoglobin can carry four oxygen molecules in total.
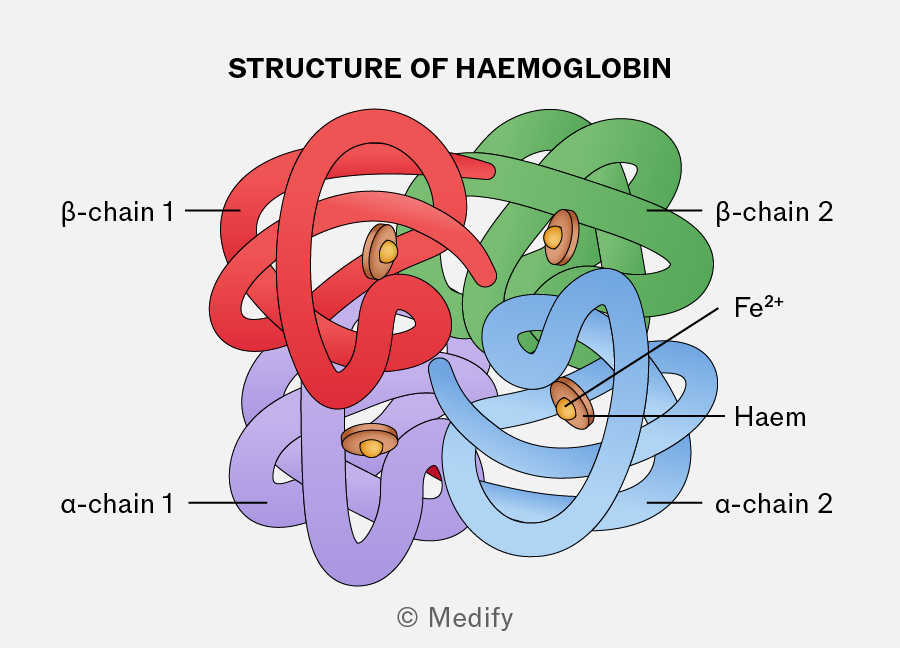
Diagram titled 'STRUCTURE OF HAEMOGLOBIN' showing a complex structure composed of intertwined colored chains labeled as β-chain 1, β-chain 2, α-chain 1, and α-chain 2. The β-chain 1 is colored red, β-chain 2 is green, α-chain 1 is purple, and α-chain 2 is blue. The diagram includes labeled components: 'Fe2+' and 'Haem' associated with circular elements within the structure. The image is credited to Medify.
Add to favourites

Catalase is a conjugated protein that functions as an intracellular enzyme which breaks down hydrogen peroxide (a toxic byproduct of cellular metabolism) into water and oxygen. It contains four haem groups.

Add to favourites

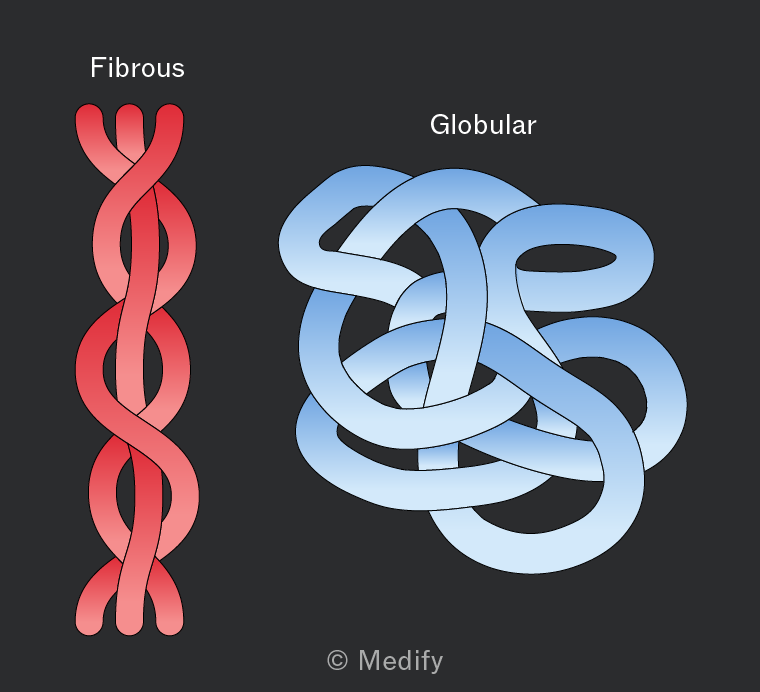
Fibrous proteins are long, insoluble polypeptide chains with structural roles, such as in keratin and collagen.

They are not folded into compact shapes and have repetitive amino acid sequences. Their strength comes from extensive hydrogen bonding and additional cross-links, such as disulfide bonds, between chains.

These proteins form strong fibres and are well suited to support and protection.
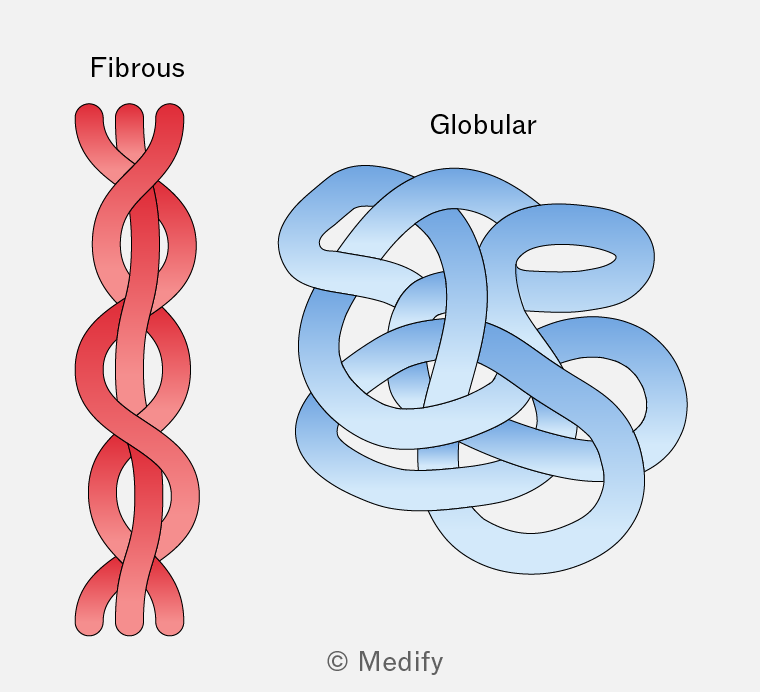
The image displays two structures labeled 'Fibrous' and 'Globular'. The fibrous structure on the left is shown as a red, twisted, rope-like form with long, intertwined strands. The globular structure on the right is depicted as a complex, blue, tangled mass with loops and curves, resembling a knotted ball. Both structures are visually distinct, with fibrous being linear and elongated, while globular is compact and spherical. The credit '© Medify' is at the bottom center of the image.
Add to favourites

Keratins are a group of fibrous proteins found in hair, nails, horns and feathers.

They have a high cysteine content, allowing many disulfide bonds to form between polypeptide chains, giving keratin its strength.

The greater the number of disulfide bonds, the tougher and less flexible the material; for example, nails contain more disulfide bonds than hair.

Add to favourites

Elastin is a fibrous protein present in tissues such as blood vessels, skin and alveoli. The limited crosslinking between polypeptide chains in this protein allows for flexibility and elasticity; the tissues can stretch and recoil to their original shape.

Add to favourites

Collagen is a fibrous protein found in connective tissues such as skin, tendons, ligaments, cartilage and the nervous system.

It consists of three polypeptide chains wound together in a triple helix, like a rope, making it strong yet flexible. The chains are held together by hydrogen bonds and covalent cross-links, and are staggered to avoid weak points.

Collagen molecules form fibrils and fibres and are insoluble in water.

Add to favourites

An ion is an atom or group of atoms with an electrical charge. Ions with a positive charge are cations, while those with a negative charge are anions.

Inorganic ions are crucial in various cellular processes, existing in the cytoplasm and body fluids of organisms. Their concentrations can vary and each type of inorganic ion has a specific role based on its properties.
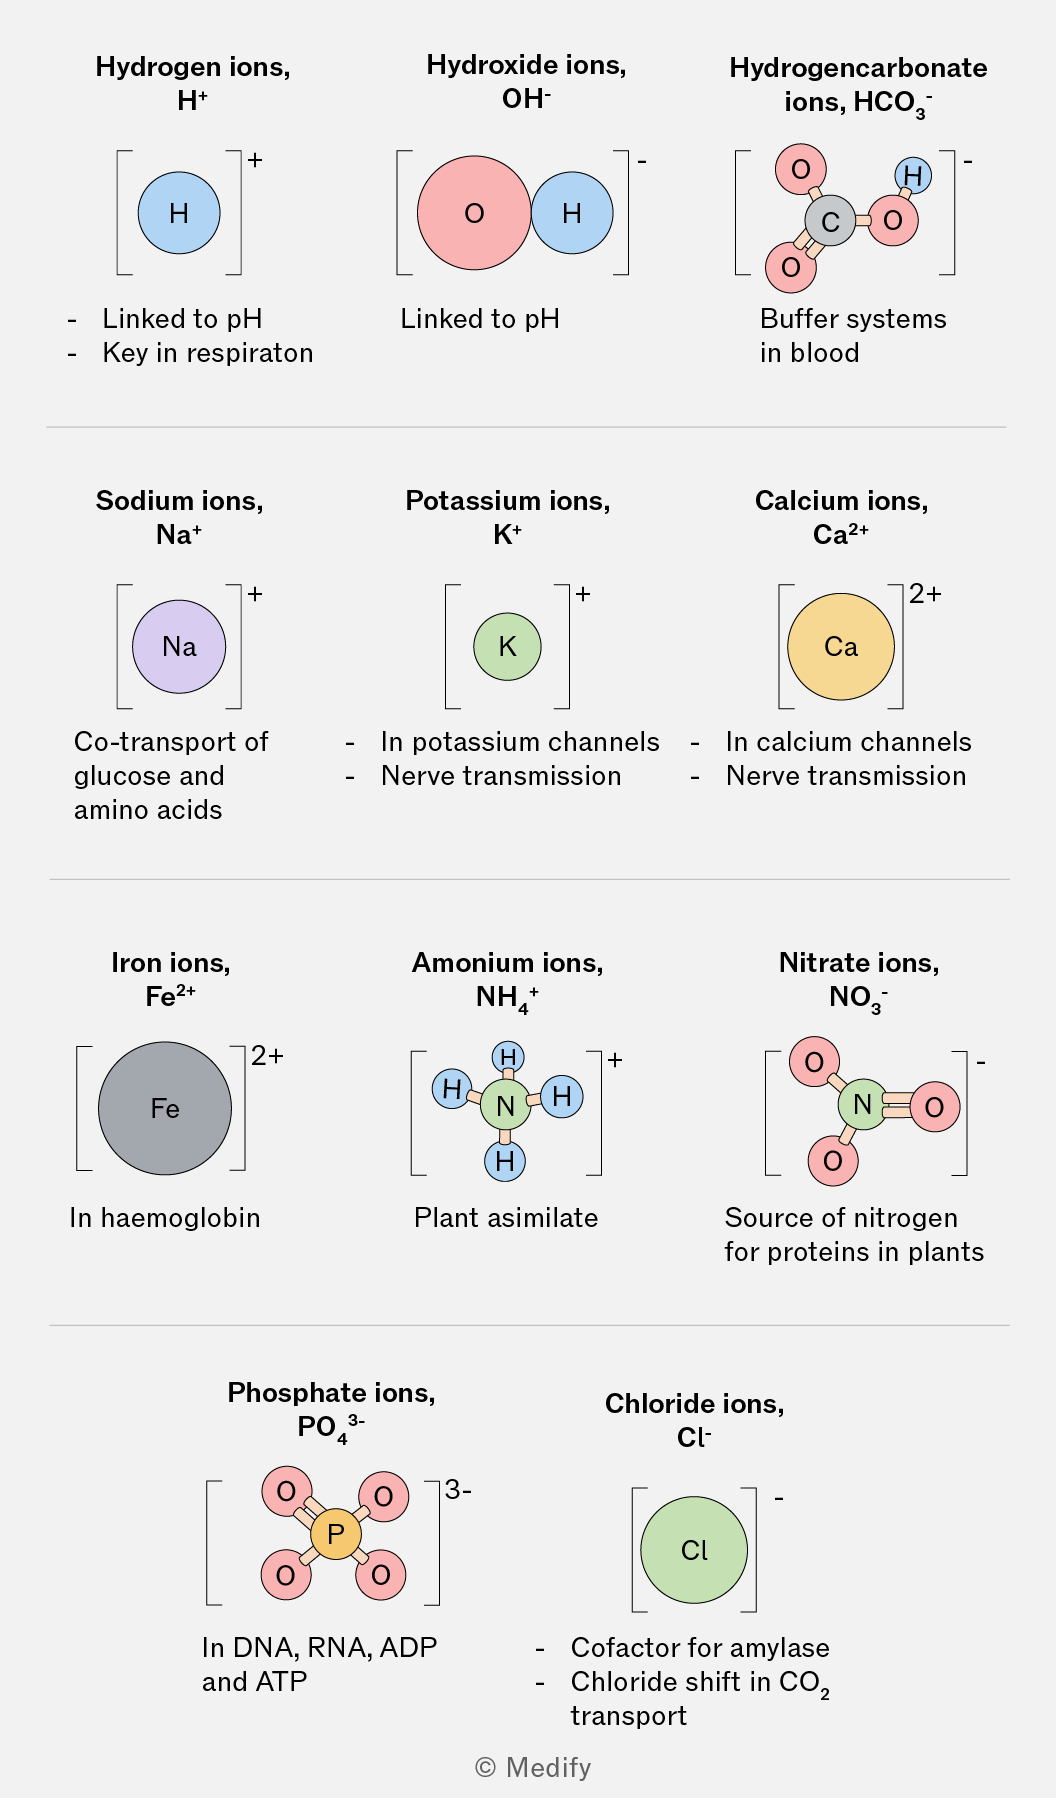
The image is a diagram of various ions with their chemical symbols and charges, each accompanied by a brief description of their biological significance. Top row: 'Hydrogen ions, H+' with a blue circle labeled 'H' and description 'Linked to pH, Key in respiration'. 'Hydroxide ions, OH-' with a red circle labeled 'O' and a blue circle labeled 'H', description 'Linked to pH'. 'Hydrogencarbonate ions, HCO3-' with a central grey circle labeled 'C', surrounded by red circles labeled 'O' and a blue circle labeled 'H', description 'Buffer systems in blood'. Middle row: 'Sodium ions, Na+' with a purple circle labeled 'Na', description 'Co-transport of glucose and amino acids'. 'Potassium ions, K+' with a green circle labeled 'K', description 'In potassium channels, Nerve transmission'. 'Calcium ions, Ca2+' with an orange circle labeled 'Ca', description 'In calcium channels, Nerve transmission'. Bottom row: 'Iron ions, Fe2+' with a grey circle labeled 'Fe', description 'In haemoglobin'. 'Ammonium ions, NH4+' with a central blue circle labeled 'N' surrounded by smaller blue circles labeled 'H', description 'Plant assimilate'. 'Nitrate ions, NO3-' with a central blue circle labeled 'N' surrounded by red circles labeled 'O', description 'Source of nitrogen for proteins in plants'. 'Phosphate ions, PO4 3-' with a central orange circle labeled 'P' surrounded by red circles labeled 'O', description 'In DNA, RNA, ADP and ATP'. 'Chloride ions, Cl-' with a green circle labeled 'Cl', description 'Cofactor for amylase, Chloride shift in CO2 transport'.
Add to favourites

Hydrogen ions determine the of a solution. The concentration of is inversely related to ; more ions correspond to lower .

is crucial for enzyme activity, as changes can alter enzyme structure, particularly the shape of its active site.

Add to favourites

Calcium ions () are vital for muscle contraction, nerve impulse transmission, and blood clotting. also regulates protein channels, affecting cell membrane permeability.

Add to favourites

Iron ions () are essential for oxygen transport in haemoglobin and myoglobin. in haemoglobin binds oxygen, allowing red blood cells to carry it throughout the body.

Iron ions are also essential in electron transport during respiration and photosynthesis.

Add to favourites

Sodium ions () are necessary for glucose and amino acid transport across cell membranes via co-transport. They also play a role in nerve impulse transmission.

Add to favourites

Potassium ions () are essential for nerve transmission, particularly in repolarising the axon membrane after a nerve impulse. They also aid in water reabsorption in the kidneys and regulate the opening of stomata in plants.

Add to favourites

Ammonium ions () are products of the oxidative deamination of proteins in the liver and kidneys and they are then converted to urea.

Ammonium ions are also involved in the process of nitrogen assimilation in plants, where they can be taken up by roots and converted into amino acids, contributing to plant growth and development.

Add to favourites

Nitrate ions () are absorbed by plants from the soil and provide nitrogen for protein synthesis, essential for plant growth and repair.

In addition, nitrate ions play a role in the synthesis of nucleic acids (DNA and RNA) in plants, supporting cell division and growth.

Add to favourites

Hydrogencarbonate ions () work with ions in transporting carbon dioxide in the blood.

Hydrogencarbonate ions also help regulate acid–base balance in the blood and act as a buffer to maintain the level.

Add to favourites

Chloride ions () are involved in carbon dioxide transport and help maintain the balance in the blood.

Chloride ions are also required for the production of hydrochloric acid () in gastric juice, which aids digestion in the stomach.

Add to favourites

Phosphate ions () form phosphate groups, essential components of DNA, RNA, ATP, and phospholipids.

In ATP, the phosphate bonds store energy, which is released during cellular processes. Phosphate ions are essential for energy transfer through ATP and play a critical role in signal transduction pathways, regulating various cellular processes.

Add to favourites

Hydroxide ion () are important in the process of maintaining by neutralising excess ().

Add to favourites

Sugars can be classified as reducing or non-reducing depending on their structure and their functional groups. Reducing sugars can act as reducing agents by donating electrons.

Glucose, fructose, lactose, and maltose are reducing sugars, while sucrose is non-reducing.

Add to favourites

Benedict’s test detects reducing sugars in a sample.

Benedict’s reagent is a blue solution of () that contains copper(II) sulfate ions. When this reacts with reducing sugars, copper(II) is reduced to copper(I). The copper(I) oxide formed is insoluble in water and is detected as a brick-red precipitate.

Method:

  1. Add Benedict’s reagent (blue) to the sample. It is important that an excess of Benedict’s solution is used so that there is more than enough copper(II) sulfate present to fully react with the reducing sugars in the sample.
  2. Heat the test tube in boiling water or in a water bath for a few minutes.

Results:

A colour change from blue to green, then yellow, orange, and finally brick-red, indicates the presence of reducing sugars in increasing concentrations.
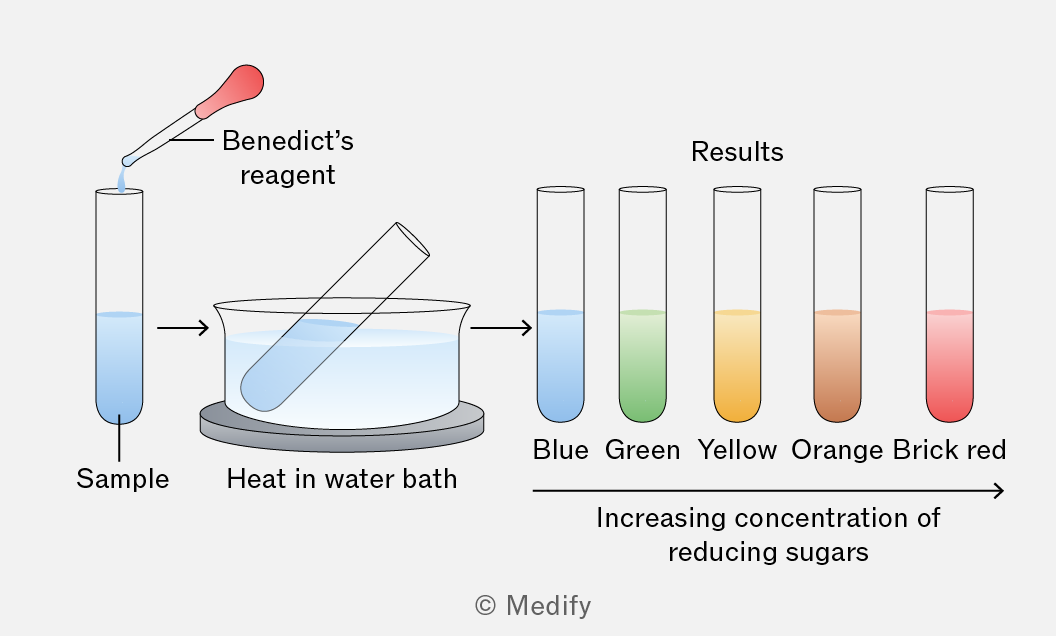
The image illustrates the process of testing for reducing sugars using Benedict's reagent. A sample in a test tube is shown with an arrow indicating the addition of Benedict's reagent. The test tube is then heated in a water bath. The results are displayed with five test tubes showing different colors: Blue, Green, Yellow, Orange, and Brick red, labeled as 'Results'. An arrow beneath the test tubes indicates 'Increasing concentration of reducing sugars' from left to right.
Add to favourites

Hydrolysing paired with Benedict’s test can be used to test for non-reducing sugars.

Method:

  1. Follow the protocol for detecting reducing sugars, and if the results are negative, proceed.
  2. Boil the sample with dilute hydrochloric acid. This breaks the glycosidic bonds in the sample, breaking the non-reducing sugars down into reducing sugars.
  3. Neutralise the sample with sodium hydrogencarbonate.
  4. Add an excess of Benedict’s solution.
  5. Heat the test tube in boiling water or in a water bath for a few minutes.

Results:

A colour change from blue to green, then yellow, orange, and finally brick-red indicates the presence of reducing sugars in increasing concentrations — i.e. the non-reducing sugars that have been broken down by hydrolysis into monosaccharides and therefore turned into reducing sugars.

Add to favourites

Quantitative analysis requires concentrations to be known. In colourimetry, solutions of known concentrations can be used as a ladder of standards to construct a calibration curve.

Serial dilution can be used to create a series of standard solutions. This involves progressively diluting a stock solution of known concentration to create a range of concentrations.
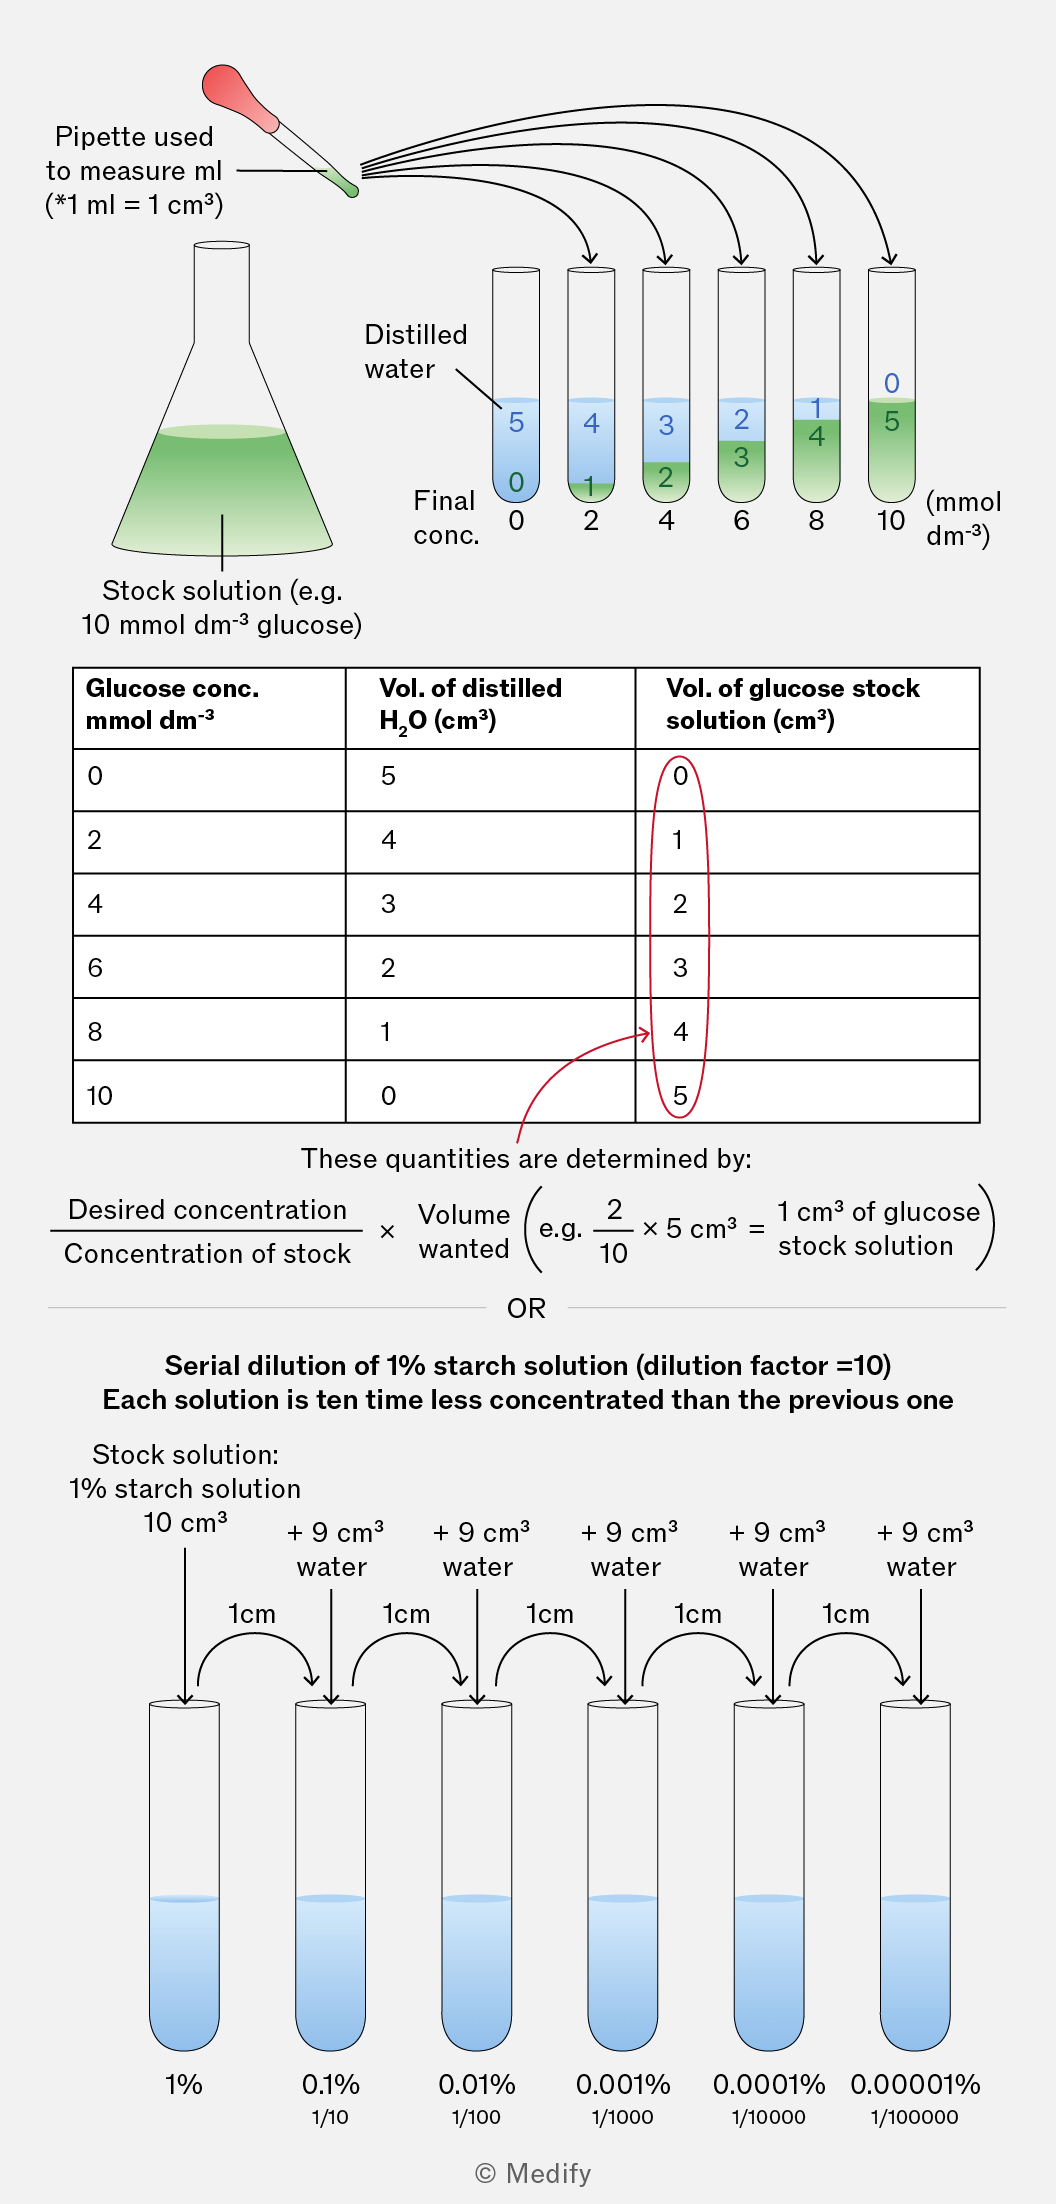
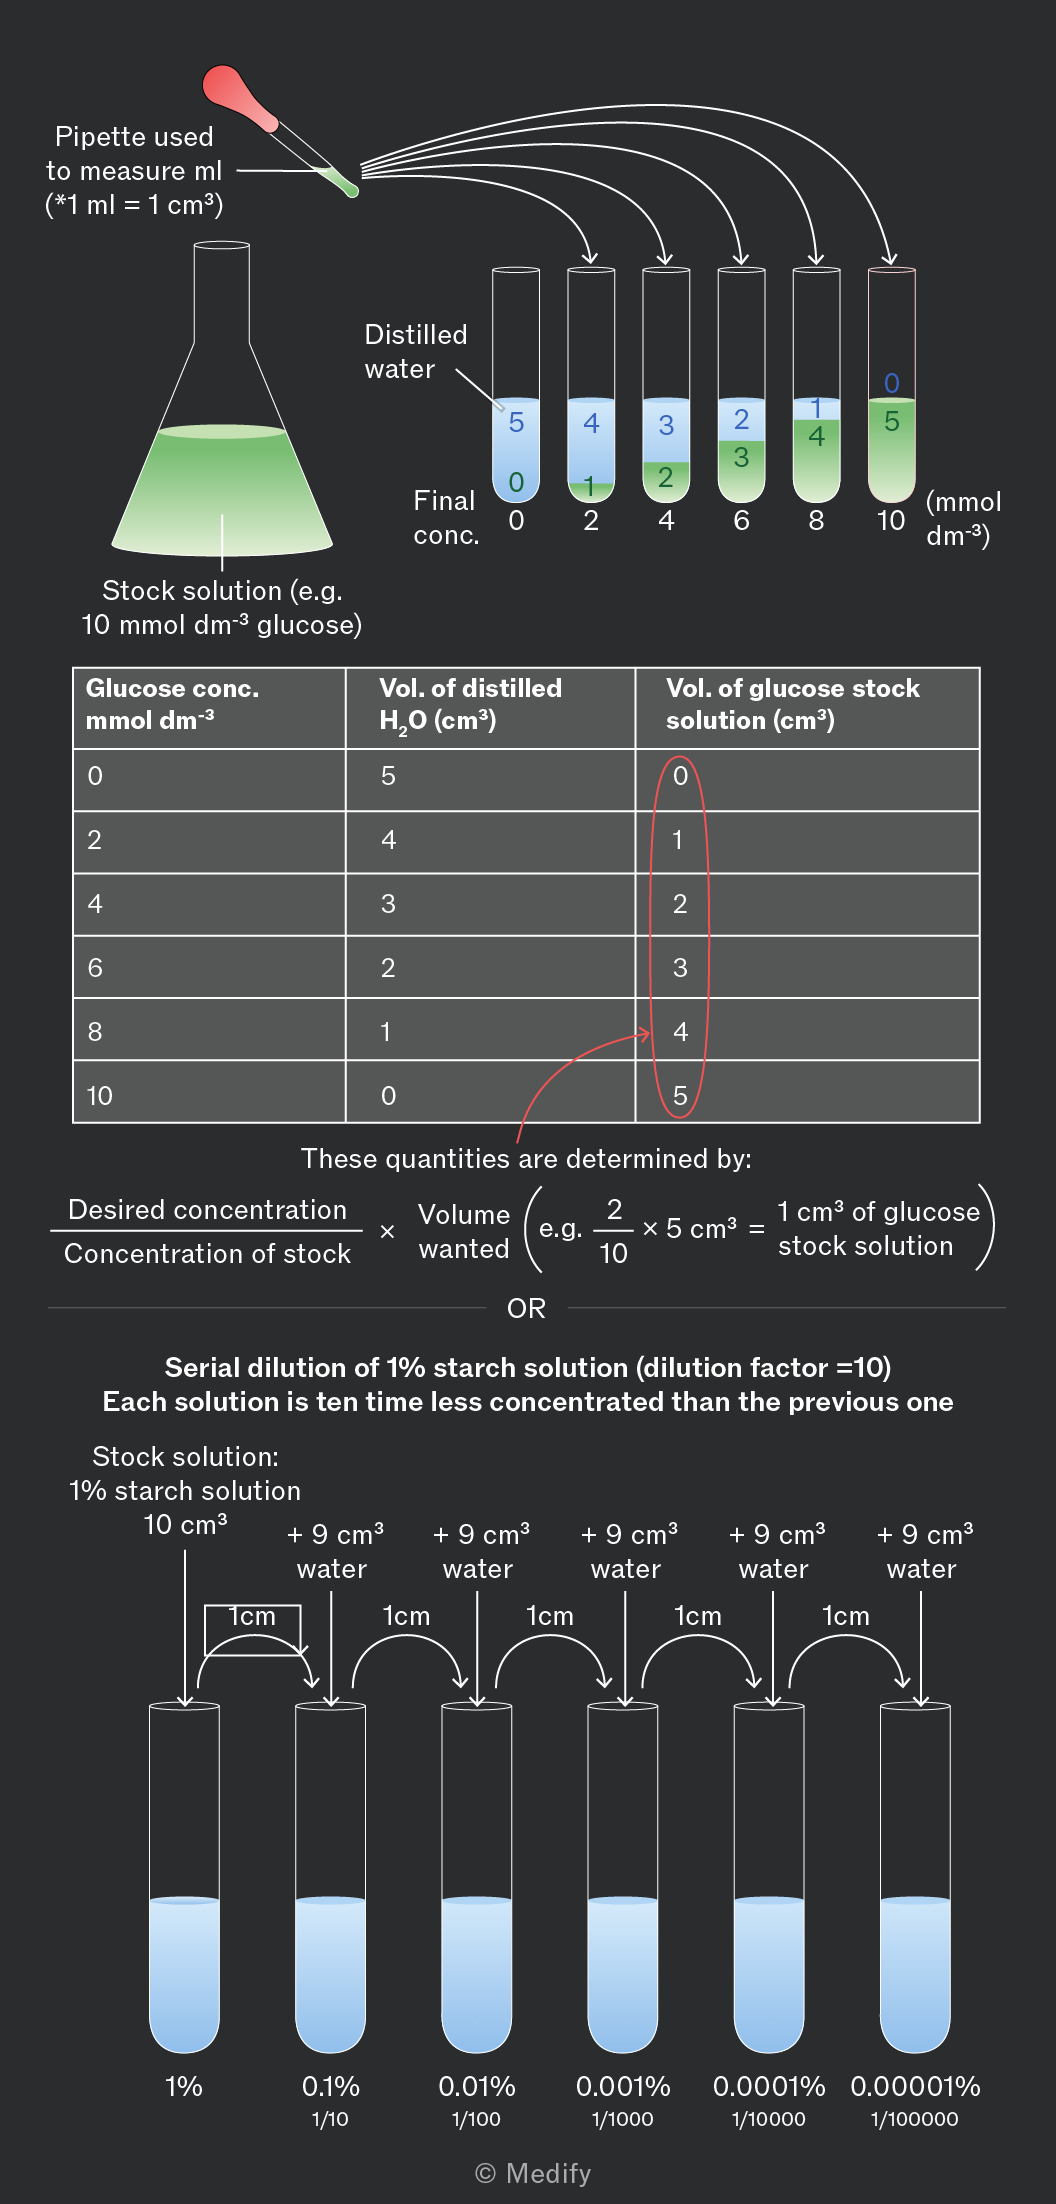
The image illustrates two dilution processes. At the top, a pipette is shown with the text 'Pipette used to measure ml (*1 ml = 1 cm³)'. An Erlenmeyer flask labeled 'Stock solution (e.g. 10 mmol dm⁻³ glucose)' is connected via arrows to a series of six test tubes. Each test tube is labeled with 'Final conc.' and a concentration value from 0 to 10 mmol dm⁻³, increasing by 2 mmol dm⁻³ increments. Each test tube contains a combination of distilled water and glucose stock solution with the respective volumes shown: 5 cm³ distilled water and 0 cm³ stock for 0 mmol dm⁻³, 4 cm³ distilled water and 1 cm³ stock for 2 mmol dm⁻³, continuing similarly up to 0 cm³ distilled water and 5 cm³ stock for 10 mmol dm⁻³. Below is a table with columns labeled 'Glucose conc. mmol dm⁻³', 'Vol. of distilled H₂O (cm³)', and 'Vol. of glucose stock solution (cm³)', listing the same values as above. An annotation explains these quantities are determined by the formula: 'Desired concentration / Concentration of stock × Volume wanted'. Below this section, a process for serial dilution of a 1% starch solution is shown with a 'dilution factor = 10'. It begins with a 10 cm³ stock solution, with each subsequent test tube having 1 cm³ of the previous solution plus 9 cm³ water, resulting in concentrations decreasing by a factor of 10 each time: 1%, 0.1%, 0.01%, 0.001%, 0.0001%, and 0.00001%, with corresponding values 1/10, 1/100, 1/1000, 1/10000, 1/100000, and 1/1000000 respectively.
Add to favourites

A colorimeter is a device that directs a specific wavelength of light through a sample and measures the amount of light absorbed. The absorbance value gives a quantitative measure of the colour intensity.

Before taking measurements, the colorimeter must be calibrated using a series of standard solutions to create a calibration (standard) curve, which can then be used to determine the concentration of unknown samples by comparing them to the curve.
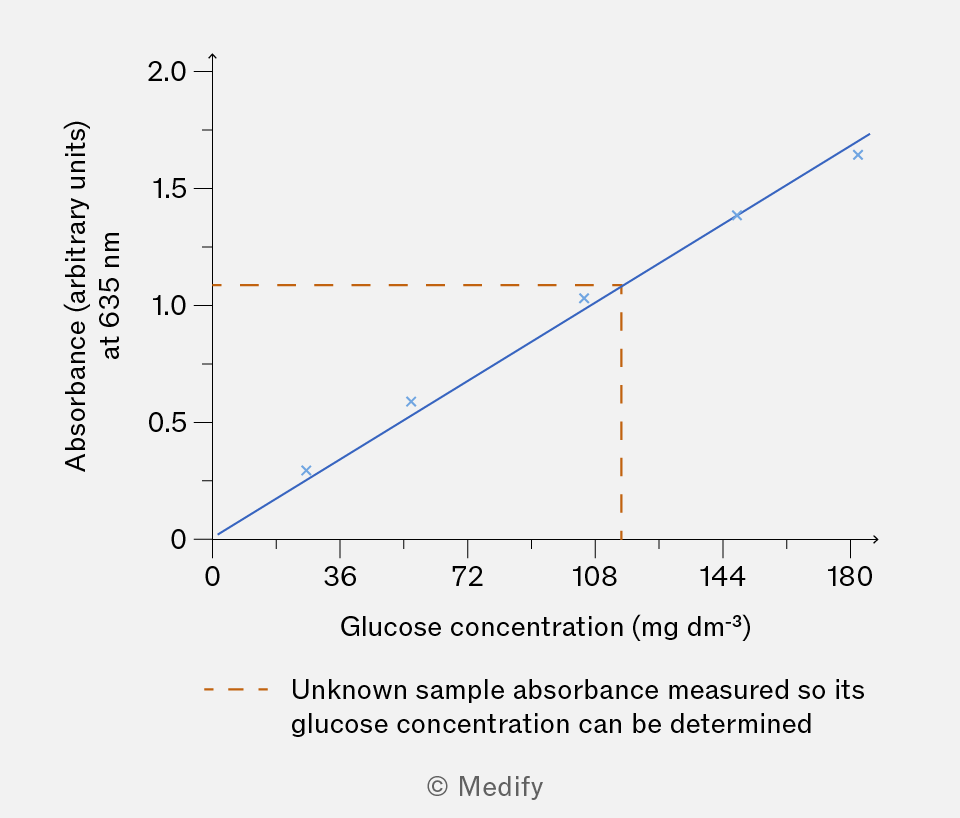
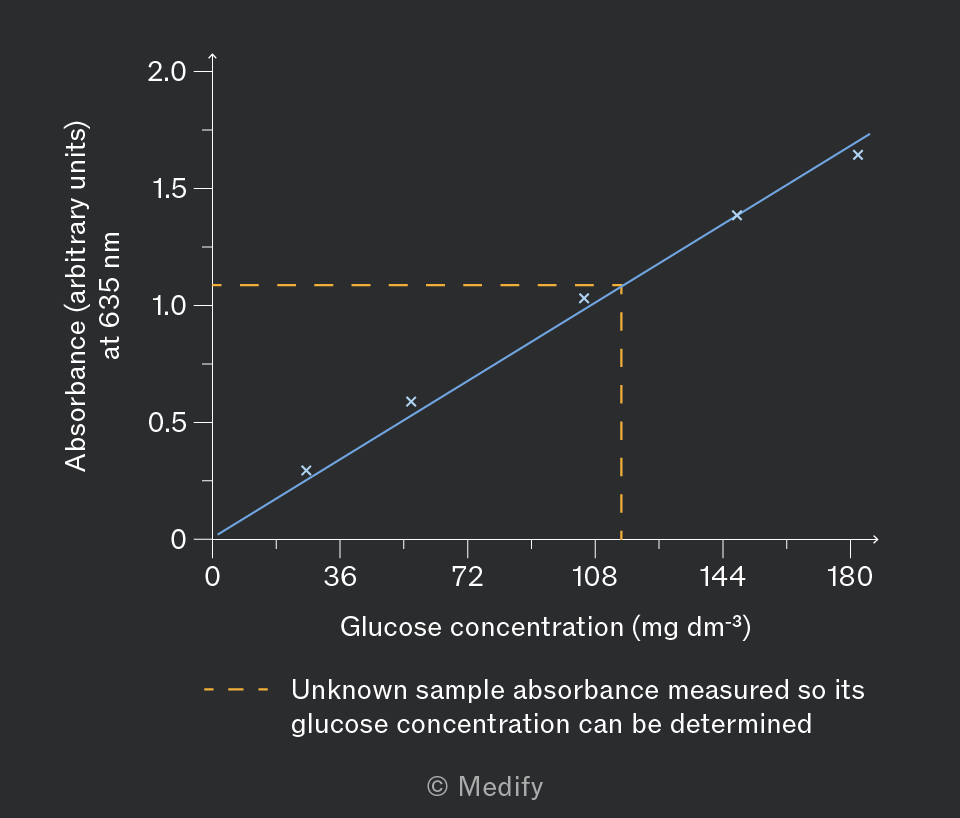
A graph showing the relationship between glucose concentration and absorbance. The x-axis is labeled 'Glucose concentration (mg dm⁻³)' with values ranging from 0 to 180. The y-axis is labeled 'Absorbance (arbitrary units) at 635 nm' with values from 0 to 2.0. Four blue cross markers are plotted approximately at (0, 0), (36, 0.4), (72, 0.8), and (144, 1.6), forming a line with a positive slope. An orange dashed line is drawn horizontally at 1.0 absorbance and vertically at approximately 108 mg dm⁻³, intersecting at this point. Annotations state 'Unknown sample absorbance measured so its glucose concentration can be determined.'
Add to favourites

Benedict’s solution can be used to perform a semi-quantitative, visual test to estimate the concentration of reducing sugars in an unknown sample:

  1. First prepare standard solutions with known concentrations of a reducing sugar, such as glucose, using simple or serial dilutions.
  2. Each standard solution should then be mixed with the Benedict’s solution and heated in a boiling water bath.
  3. The unknown solution must also be mixed with the Benedict’s solution and heated in a boiling water bath.

Compare the colours in the standard solutions with the colour of the unknown sample to estimate its sugar concentration.

For the comparisons to be accurate, the volume of Benedict’s added to the sample / standard and the heating method should be consistent.

Add to favourites

The iodine test is a qualitative test that detects starch in a sample.

Method:

  1. Add a few drops of iodine (in potassium iodide solution, which is insoluble in water) to the sample.

Results:

A blue-black colour indicates the presence of starch.
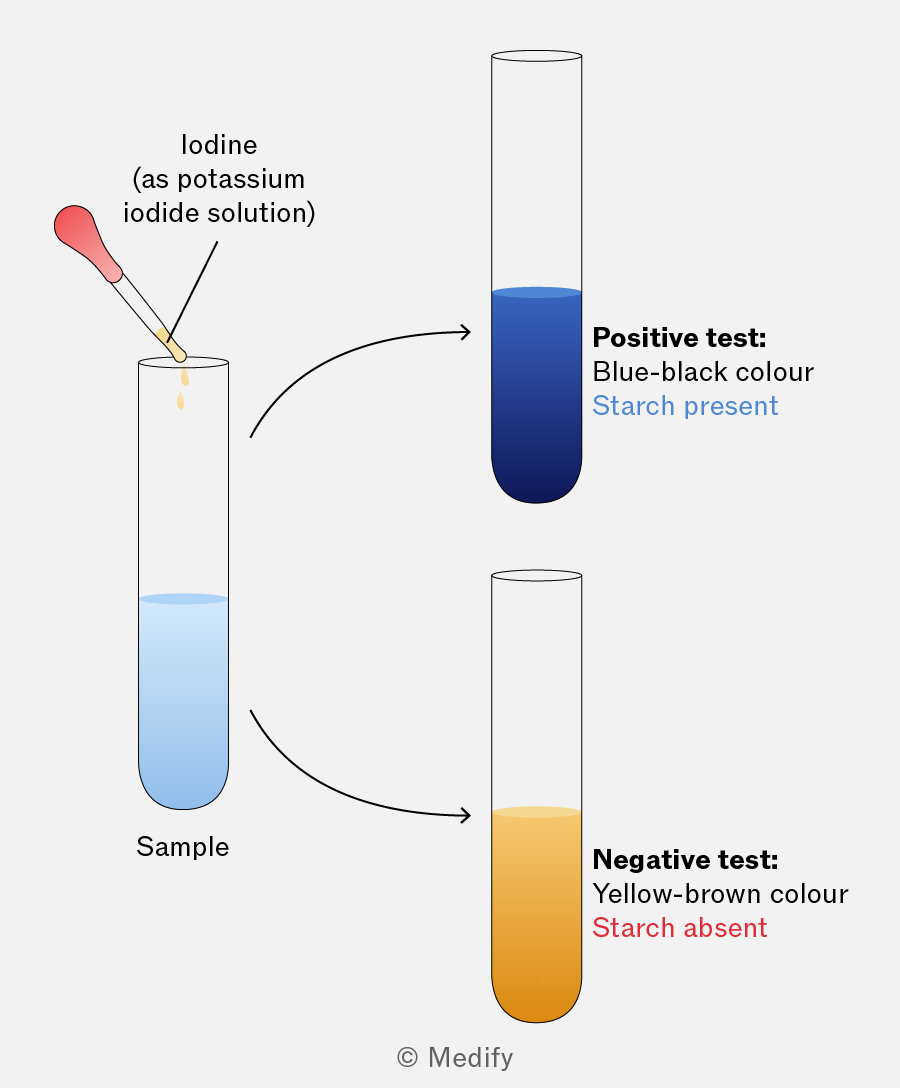
The image shows a diagram illustrating a starch test using iodine. On the left, a dropper is adding iodine (as potassium iodide solution) to a test tube labeled 'Sample' containing a light blue liquid. Two arrows point to separate test tubes on the right. The upper test tube is filled with a dark blue liquid, labeled 'Positive test: Blue-black colour, Starch present.' The lower test tube is filled with a yellow-brown liquid, labeled 'Negative test: Yellow-brown colour, Starch absent.'
Add to favourites

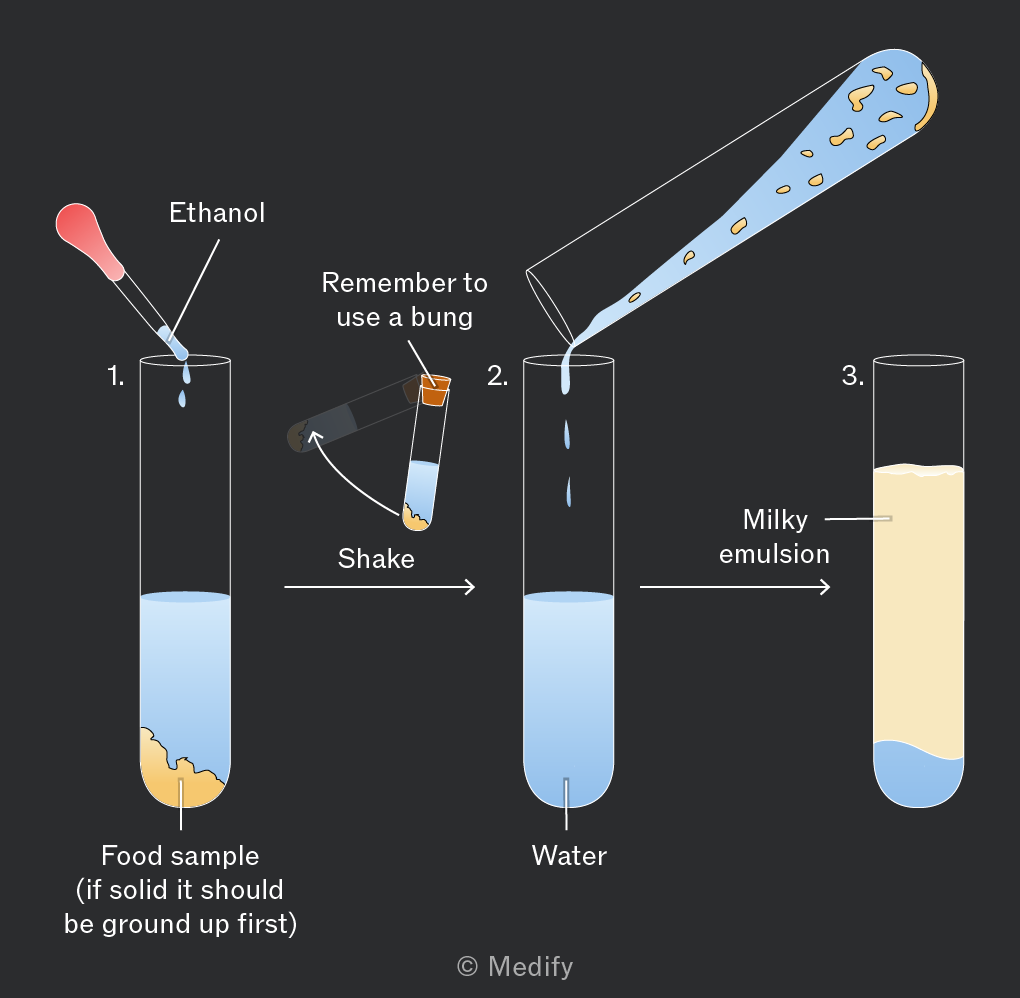
The emulsion test is used to identify lipids in a sample.

Method:

  1. Add ethanol to the sample and shake to mix.
  2. Add the mixture to a test tube containing water.

Results:

A white emulsion (cloudy appearance) indicates the presence of lipids. The more lipid present, the more pronounced the milkiness/white colour.

The emulsion test is qualitative and cannot provide concentration values.
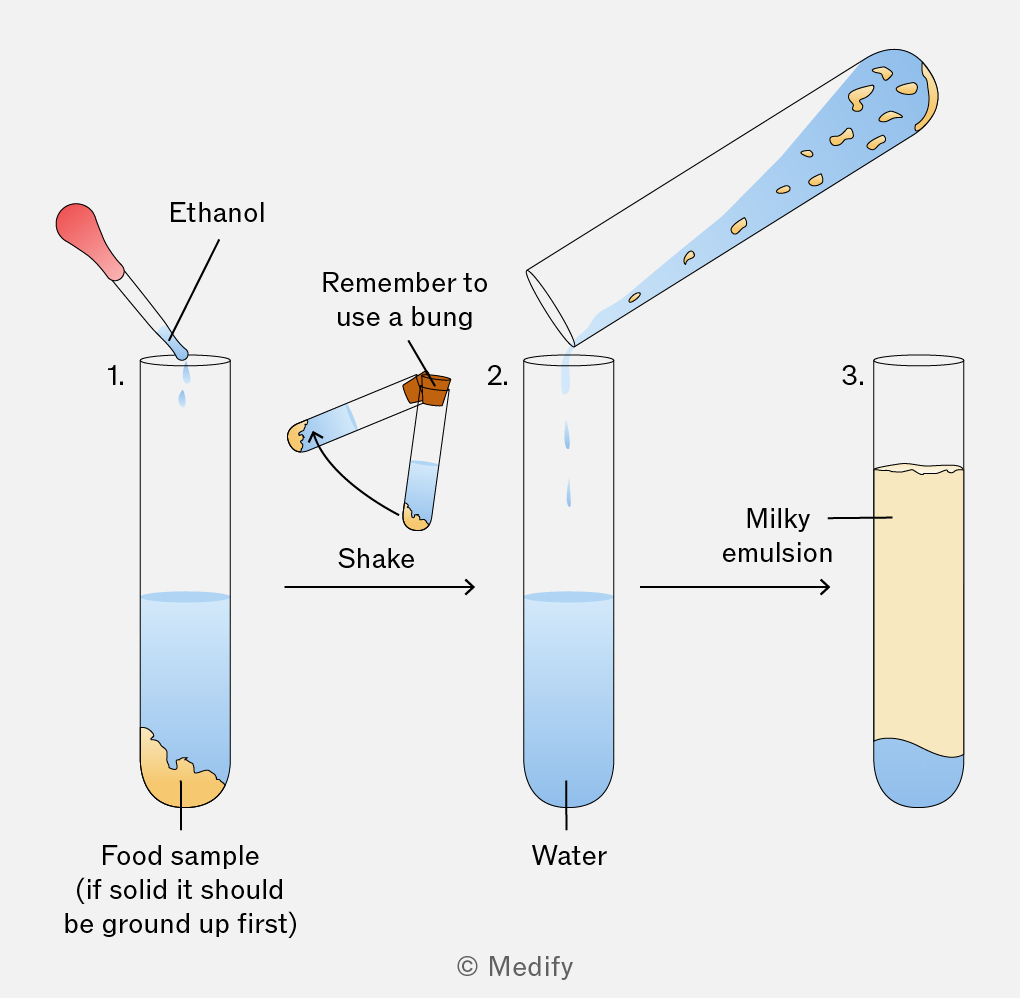
The image depicts a three-step process involving test tubes. Step 1 shows a test tube labeled '1.' containing a food sample at the bottom, with a dropper adding ethanol. Text beneath reads 'Food sample (if solid it should be ground up first)'. An arrow labeled 'Shake' points to a horizontal test tube with a bung, indicating it should be shaken. Step 2 shows a test tube labeled '2.' with water, with liquid being poured from the horizontal test tube. An arrow points to Step 3, a test tube labeled '3.' containing a milky emulsion. Text labels include 'Ethanol', 'Remember to use a bung', 'Water', and 'Milky emulsion'.
Add to favourites

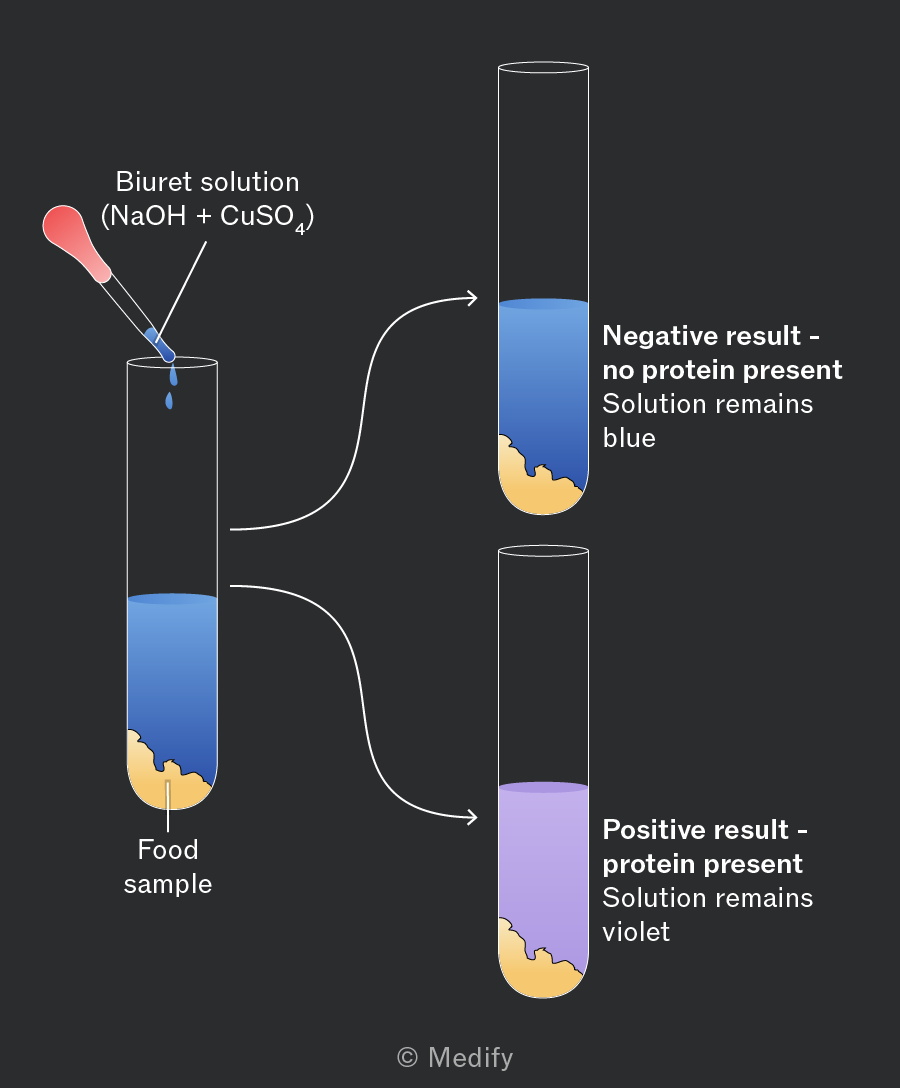
The biuret test is a qualitative test used to detect proteins in a sample.

Biuret solution is a premixed alkaline copper(II) sulfate solution which reacts in the presence of peptide bonds. The reagent requires at least two peptide bonds, so free amino acids or dipeptides give a negative result.

Method:

  1. Add sodium hydroxide to the food sample to make it alkaline.
  2. Add a few drops of blue copper(II) sulfate solution to the sample.

Results:

A colour change from blue to lilac / purple indicates the presence of proteins in the sample.
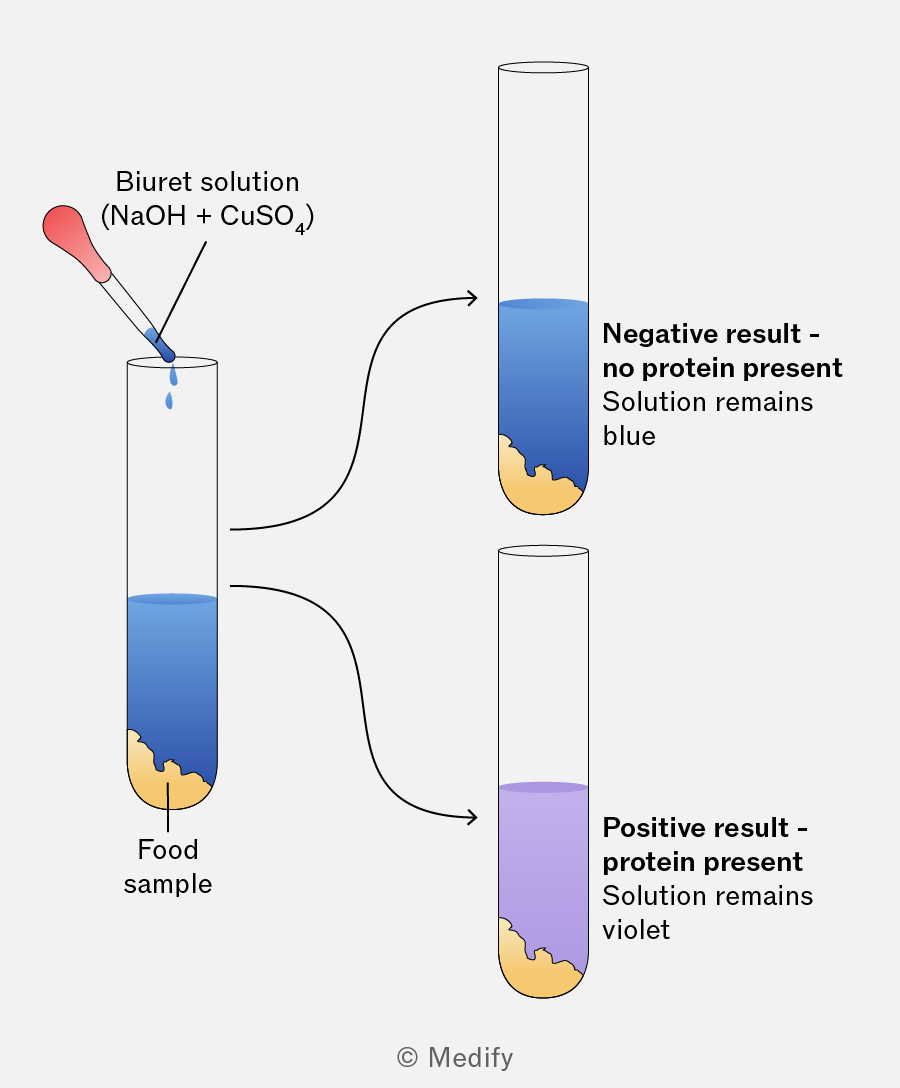
The image shows a test for protein presence using the Biuret solution. A pipette labeled 'Biuret solution (NaOH + CuSO4)' is adding blue liquid to a test tube labeled 'Food sample' containing a blue solution with a yellowish precipitate at the bottom. Two arrows point from this test tube to two separate outcomes. The first arrow leads to a test tube with the label 'Negative result - no protein present. Solution remains blue,' showing a blue solution with a yellowish precipitate. The second arrow leads to a test tube with the label 'Positive result - protein present. Solution remains violet,' showing a violet solution with a yellowish precipitate.
Add to favourites

Biosensors detect specific substances in a sample by using a biological component, such as an enzyme, antibody, nucleic acid, or cellular organelle, which interacts with the target substance.

When the target substance is present in the sample, it interacts with the biological agent, generating a chemical signal. This signal is then detected by a transducer, which converts the chemical signal to an electrical signal. The strength of the electrical signal can then be measured to determine the concentration of the substance in the solution.
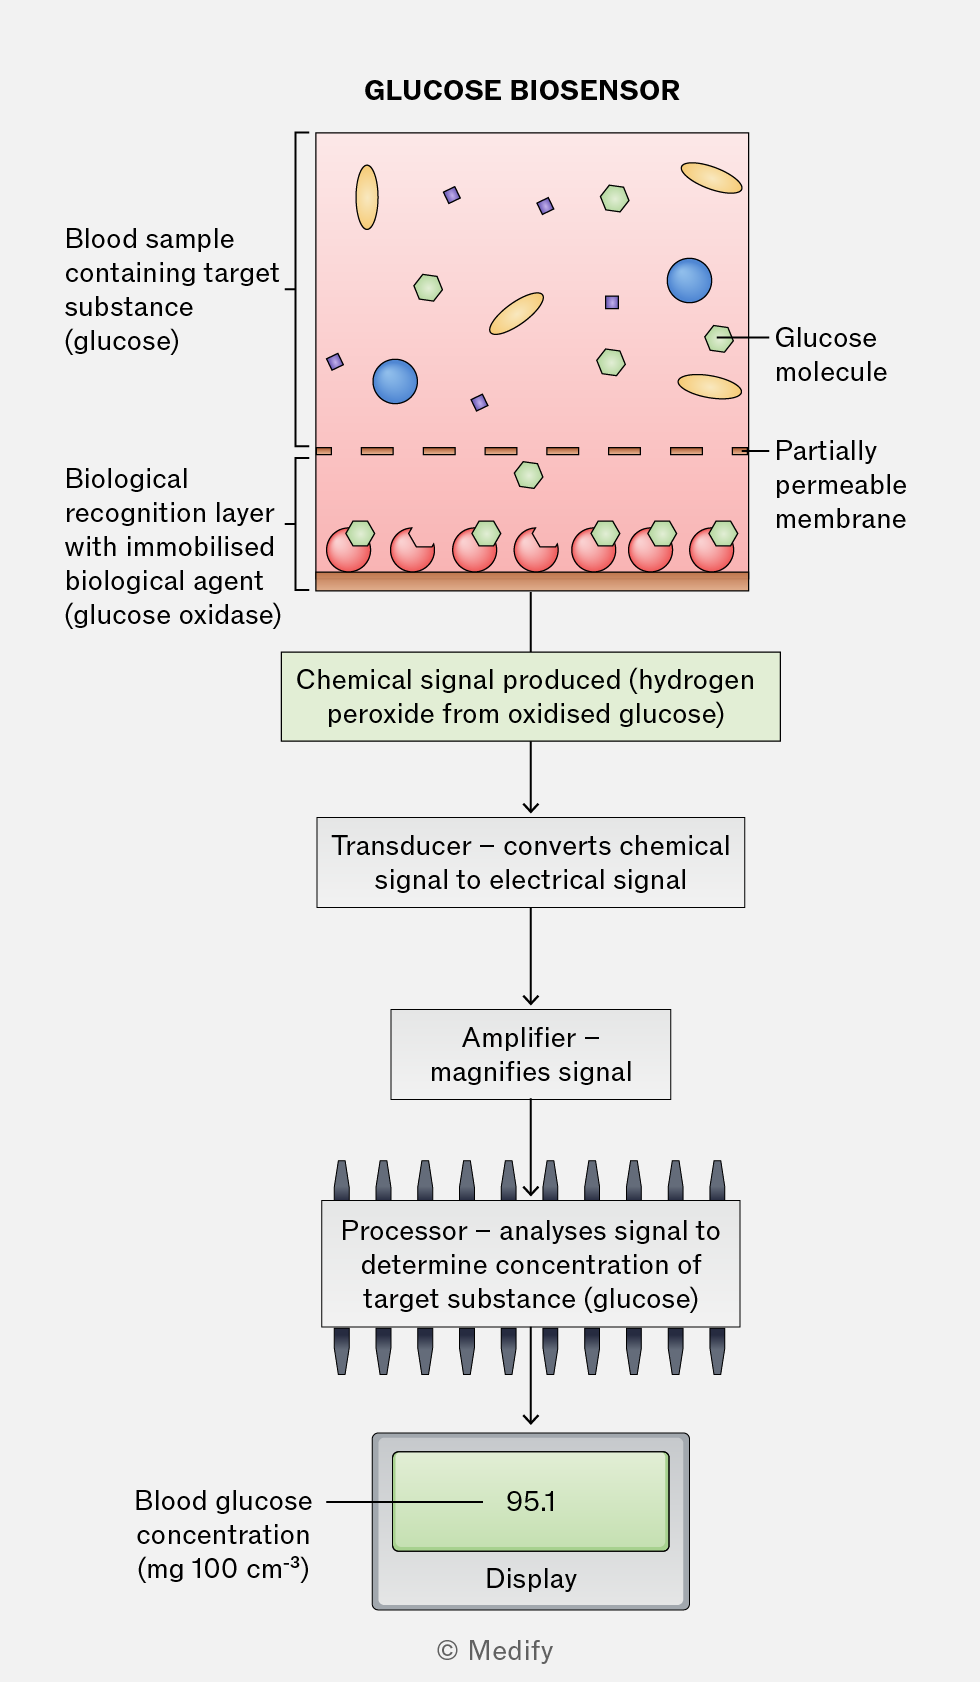
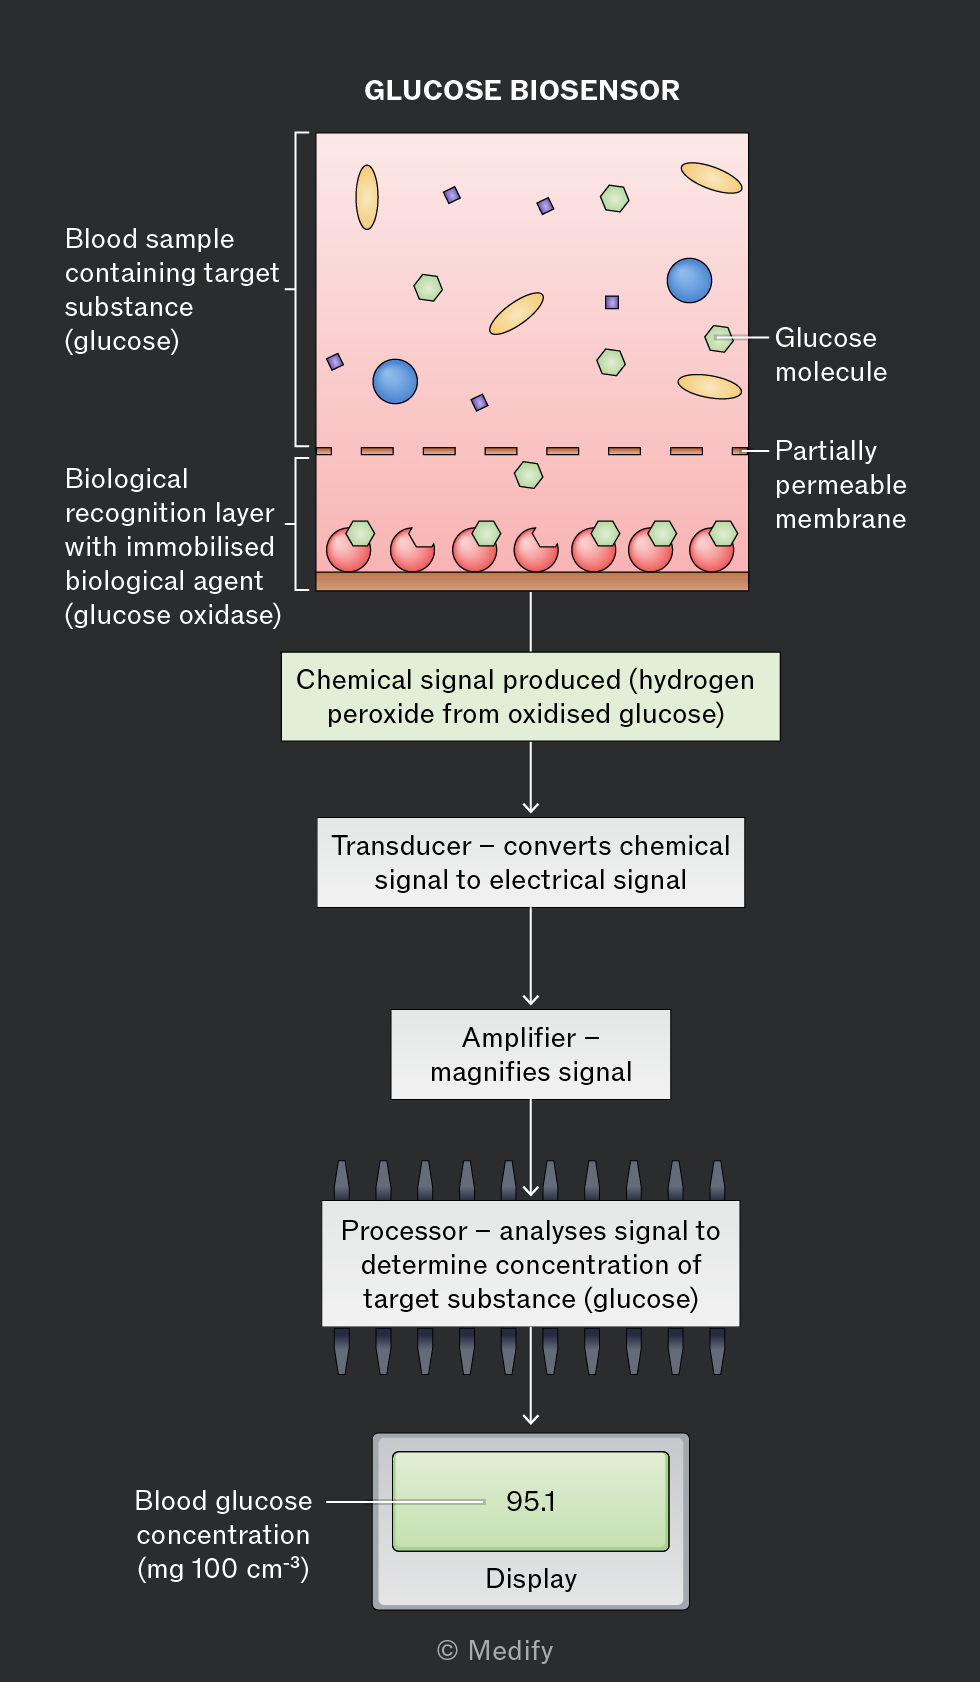
Diagram titled 'Glucose Biosensor' showing the process of glucose detection. At the top, a section labeled 'Blood sample containing target substance (glucose)' contains various shapes representing molecules. Below, a dashed line indicates a 'Partially permeable membrane.' Beneath it is the 'Biological recognition layer with immobilised biological agent (glucose oxidase)' featuring red and green shapes. A downward arrow leads to a green box labeled 'Chemical signal produced (hydrogen peroxide from oxidised glucose).' Another arrow points to a box labeled 'Transducer – converts chemical signal to electrical signal,' followed by an arrow to 'Amplifier – magnifies signal.' This connects to 'Processor – analyses signal to determine concentration of target substance (glucose).' Finally, an arrow leads to a display showing '95.1' with the annotation 'Blood glucose concentration (mg 100 cm⁻³) Display.'
Add to favourites

Thin layer chromatography is a technique used to separate a mixture into its individual components. It can be applied to mixtures containing proteins, carbohydrates, vitamins, and nucleic acids.

Chromatography separates substances using two phases:

  • The mobile phase: this is the solvent that moves the components of the mixture.
  • The stationary phase: this is the solid that remains fixed, over which the mobile phase flows. Typically a glass or plastic plate, coated with a thin layer of silica gel or alumina.

Components in the mixture separate based on their solubility in the mobile phase, and their affinity for the stationary phase. Components with higher solubility in the mobile phase travel further.

Add to favourites

Paper chromatography uses chromatography paper as the stationary phase and a solvent as the mobile phase.

Method:

  1. A spot of the mixture is placed on the baseline of the chromatography paper and allowed to dry.
  2. The paper is suspended in the solvent, with the spot above the solvent level.
  3. As the solvent moves up the paper, the components of the mixture travel at different rates.

Substances that are more soluble in the solvent move further, while those with a greater attraction to the stationary phase move less. This separates the mixture into distinct spots, forming a chromatogram.
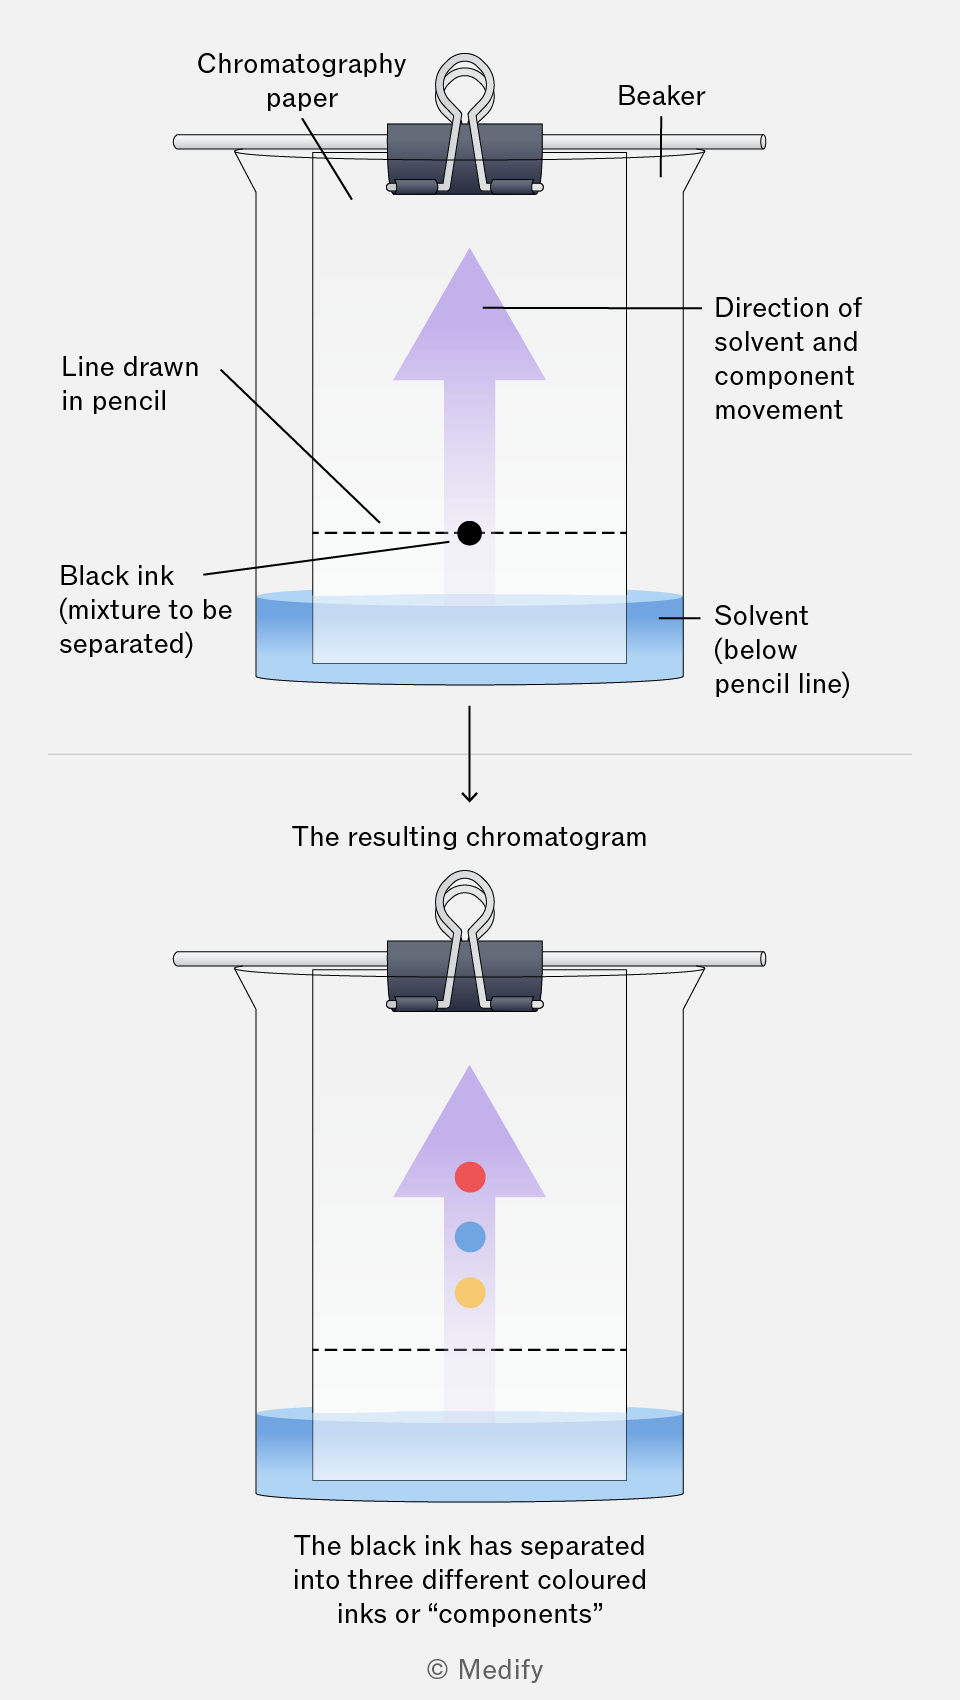
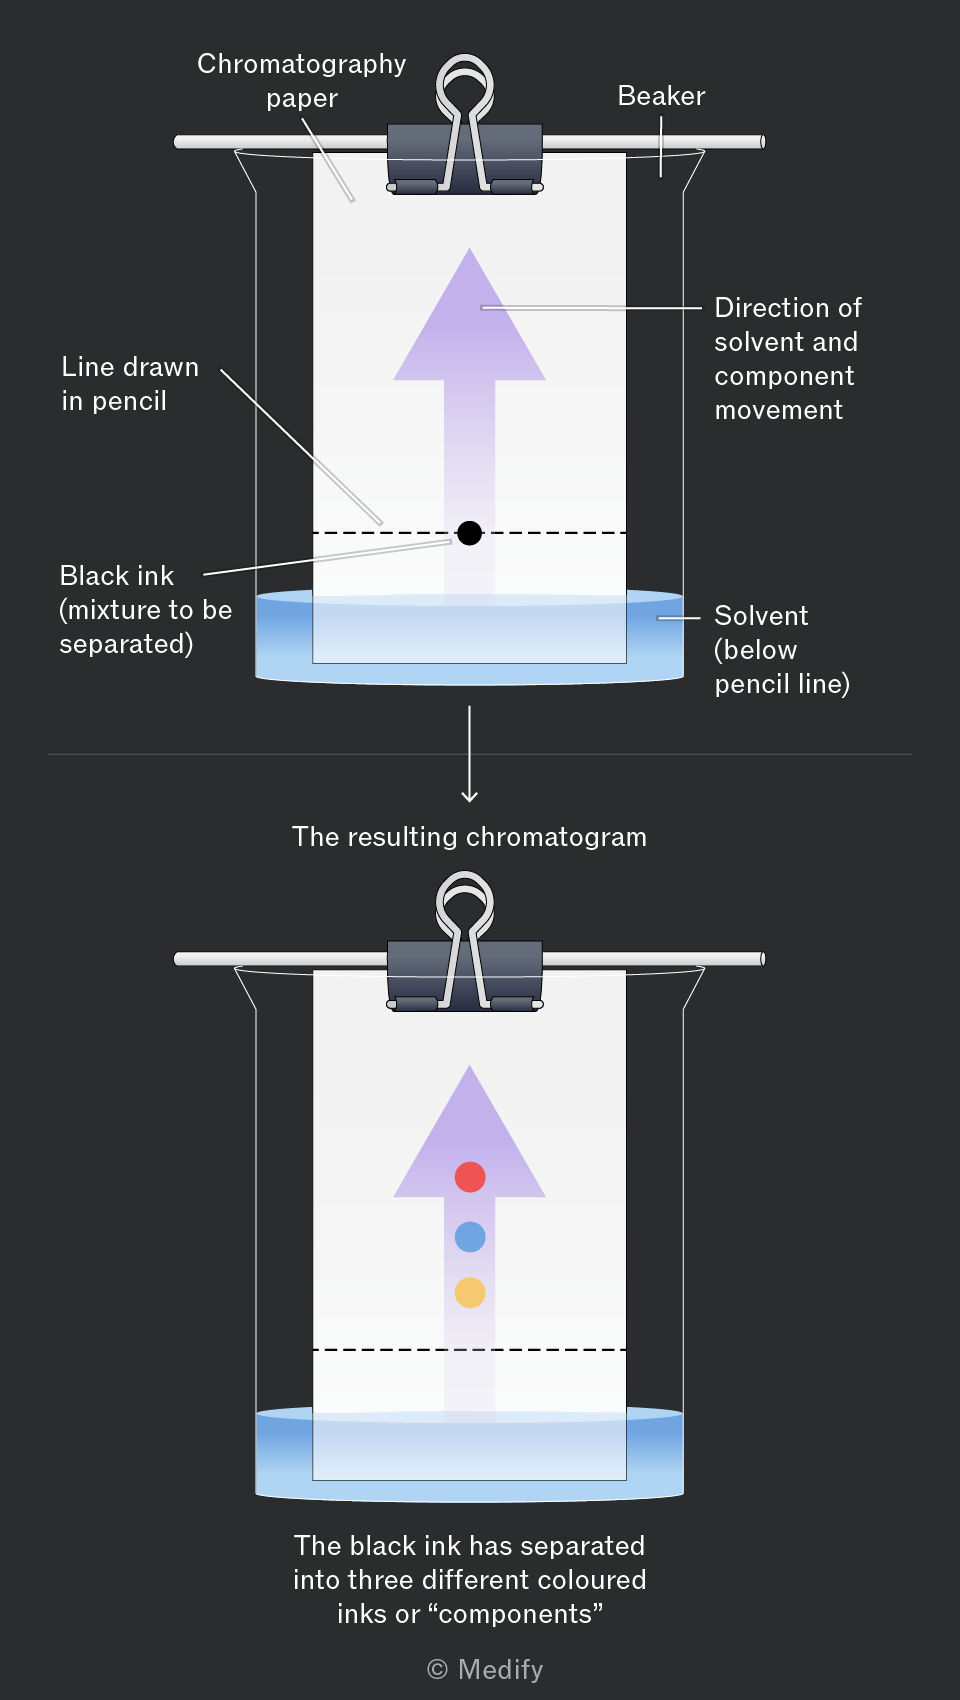
The image illustrates a chromatography experiment. The top section shows a beaker with chromatography paper clipped onto a rod. Labels include 'Chromatography paper', 'Beaker', 'Line drawn in pencil', 'Black ink (mixture to be separated)', 'Solvent (below pencil line)', and 'Direction of solvent and component movement' indicated by an upward arrow. The bottom section, labeled 'The resulting chromatogram', shows the chromatography paper with three separated colored spots (red, blue, yellow) along the direction of the arrow. Additional text states, 'The black ink has separated into three different coloured inks or “components”'.
Add to favourites

When carrying out thin-layer chromatography:

  • Draw the origin line in pencil, as ink may dissolve in the solvent.
  • Keep the solvent below the origin line so the samples do not dissolve directly into the solvent.
  • Keep the paper / plate vertical to ensure even solvent movement by capillary action.
  • Allow the solvent to travel near the top, but not reach it, so the solvent front can be measured accurately.
  • Cover the container to prevent solvent evaporation and maintain a solvent-saturated atmosphere.
Add to favourites

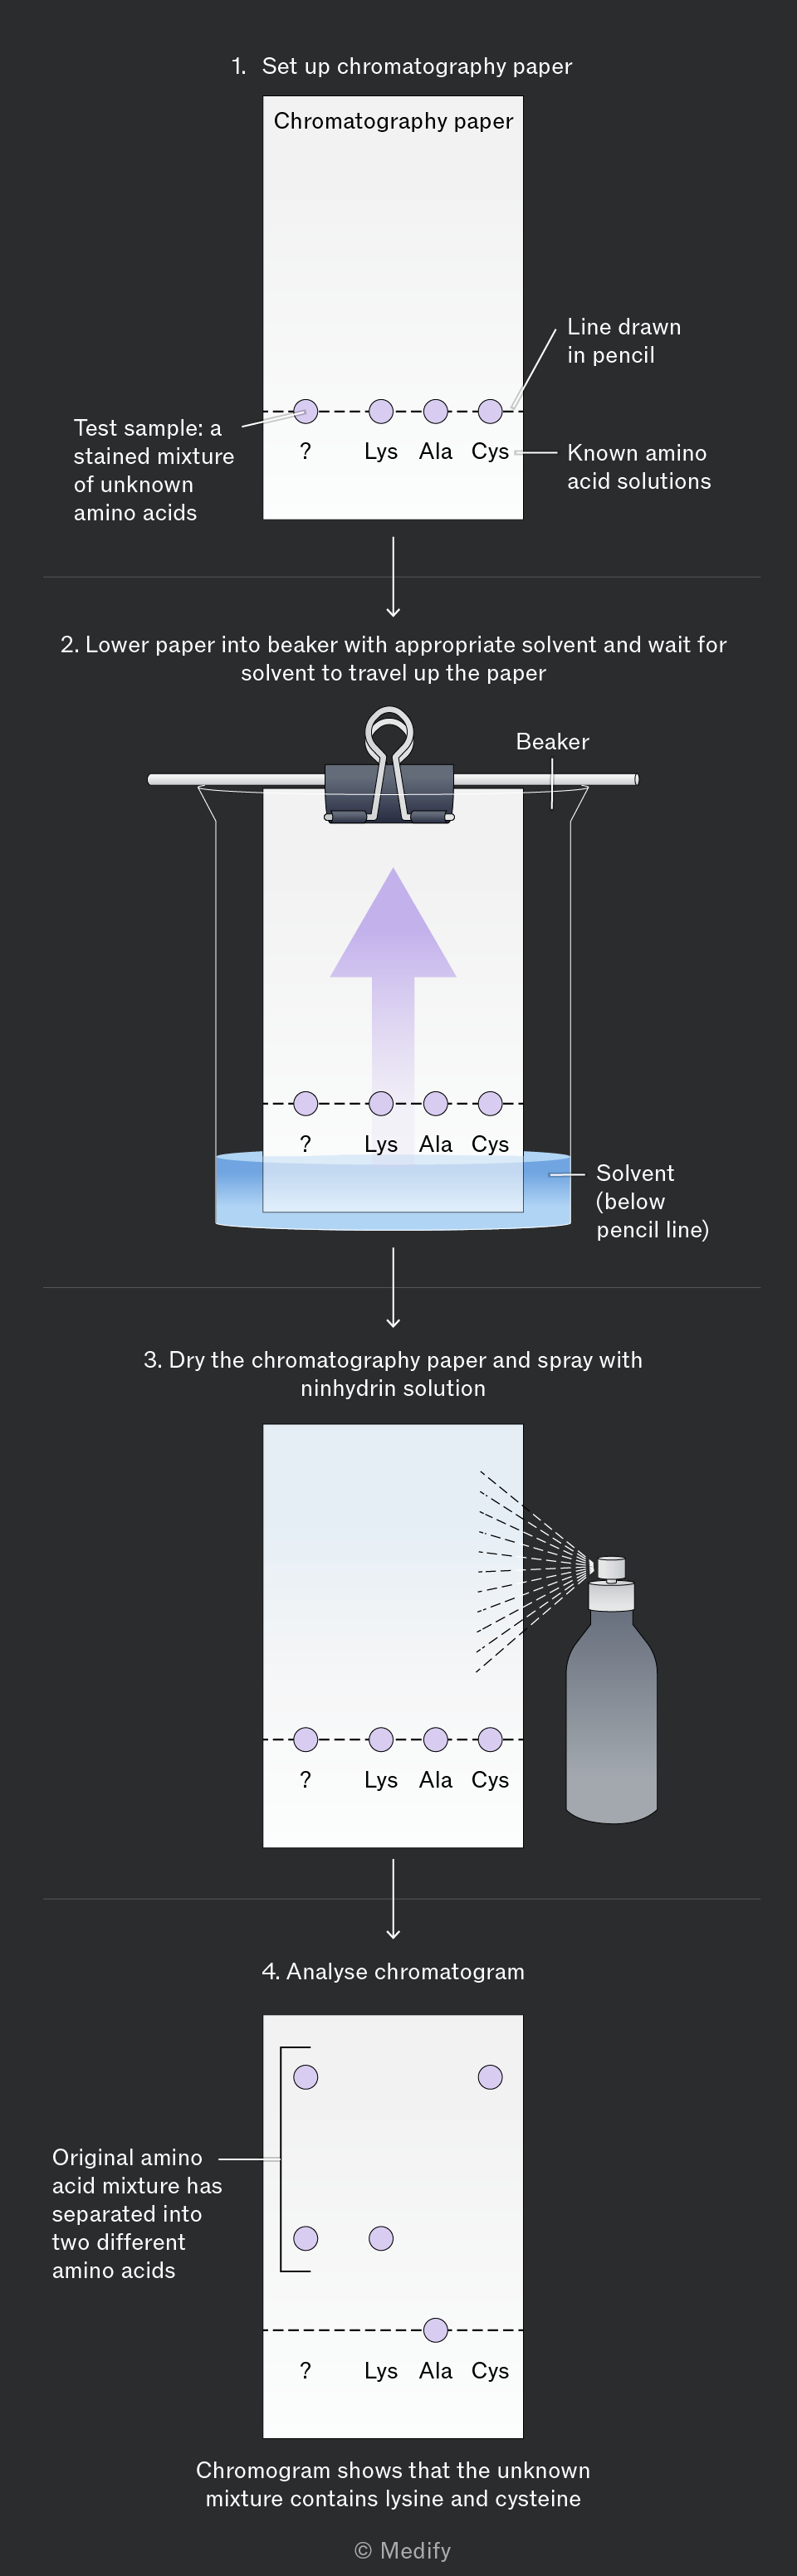
Paper chromatography can effectively separate a mixture of amino acids:

  • Place a spot of the unknown amino acid mixture on the origin line.
  • Place additional spots of amino acid standards on the origin line beside the unknown sample. Note that the spots must not touch.
  • Put the chromatography paper in a solvent.
  • Once the solvent front has travelled up most of the paper, remove the paper and mark on the solvent front.
  • To visualise the amino acid spots, the paper may need to be dried and then treated with ninhydrin solution and heated, which reacts with the amino acids to produce a visible blue-violet colour.

The unknown mixture can be compared with the standards to identify the amino acid components.
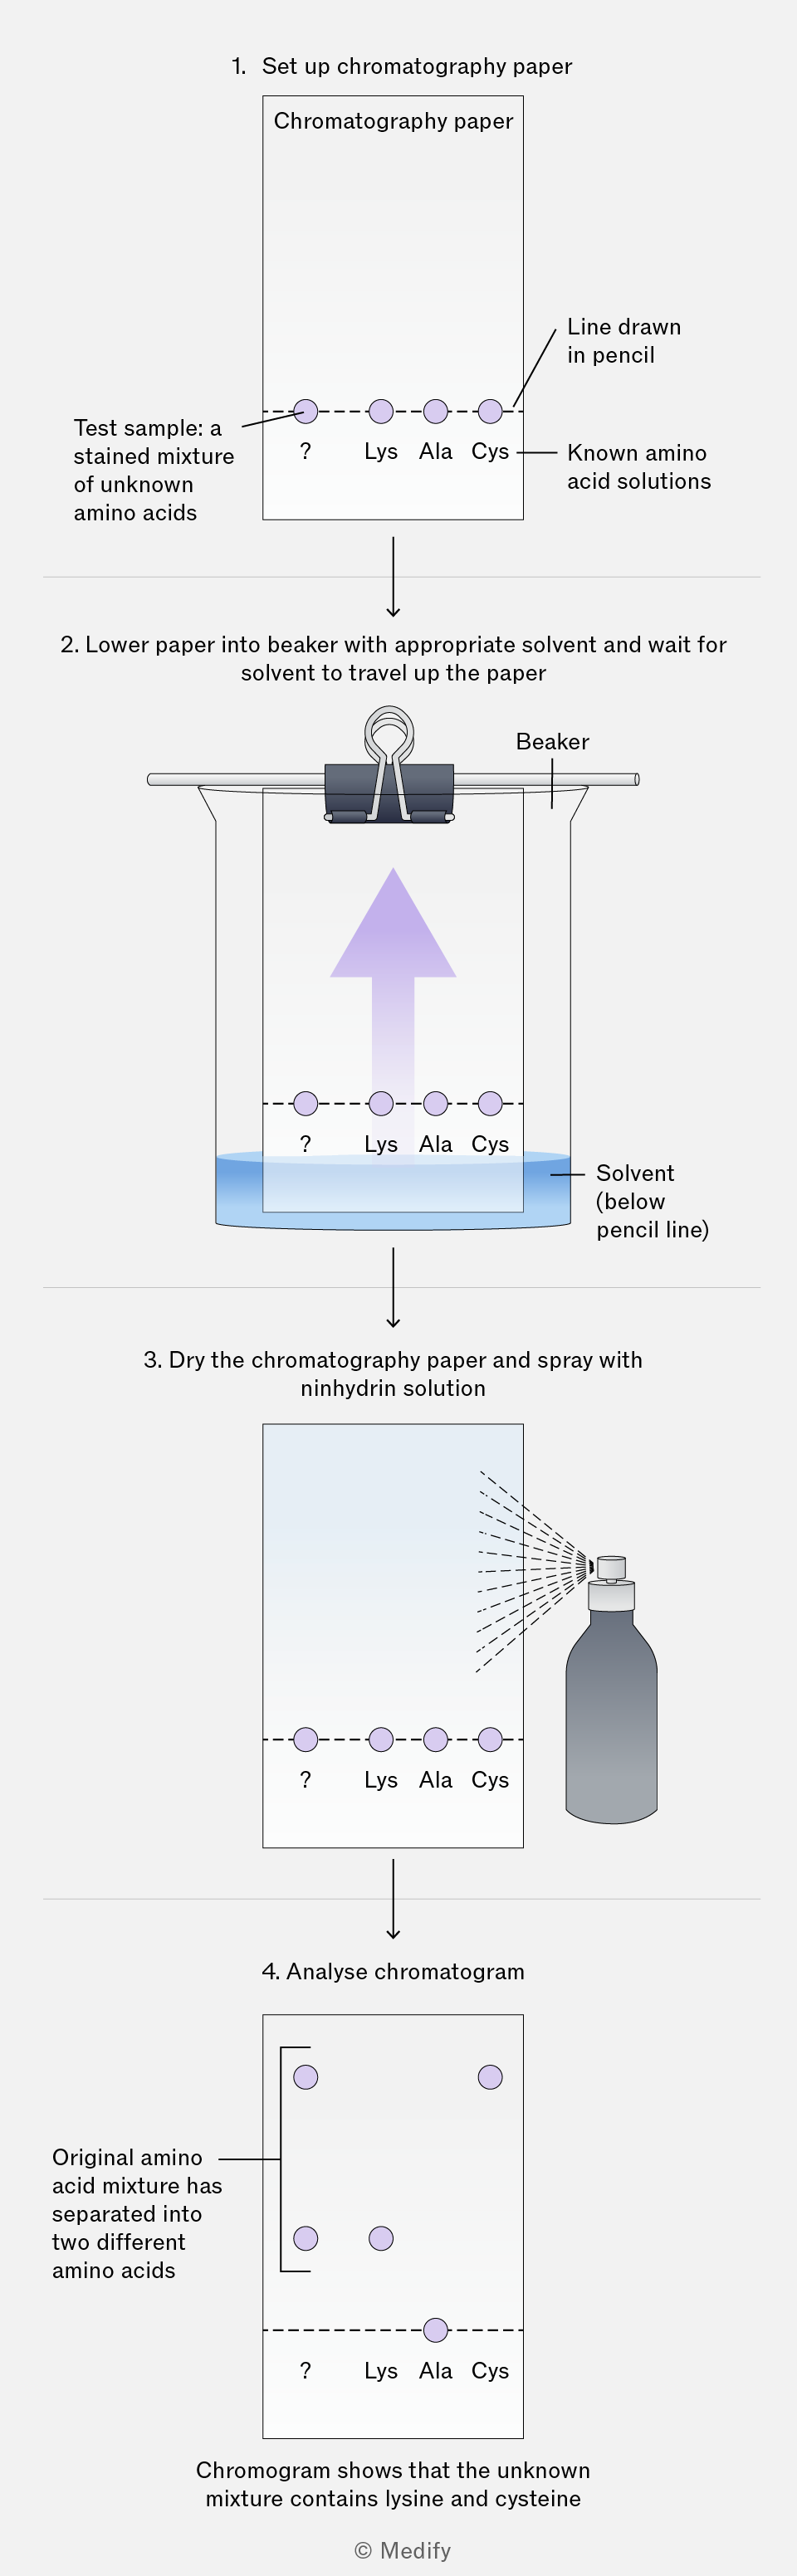
A flowchart showing the process of paper chromatography. Step 1: Set up chromatography paper. A rectangle labeled 'Chromatography paper' has a dashed line drawn in pencil with circles labeled '?', 'Lys', 'Ala', 'Cys' representing a test sample of unknown amino acids and known amino acid solutions. An arrow points to 'Test sample: a stained mixture of unknown amino acids'. Step 2: Lower paper into beaker with solvent. The setup shows paper clipped inside a beaker labeled 'Beaker' with a solvent below the pencil line. An upward arrow indicates solvent travel. Step 3: Dry the paper and spray with ninhydrin solution. A spray bottle is shown spraying the paper, with circles labeled '?', 'Lys', 'Ala', 'Cys'. Step 4: Analyze chromatogram. The final paper shows separated spots. An annotation states 'Original amino acid mixture has separated into two different amino acids' and 'Chromogram shows that the unknown mixture contains lysine and cysteine'.
Add to favourites

Paper chromatography can be used to separate a mixture of monosaccharides:

  1. To prepare the sample, dissolve a solid or liquid mixture of monosaccharides in a suitable solvent.
  2. Place the sample spot on the origin line.
  3. Apply spots of known standard monosaccharide solutions next to, but not touching, the sample spot.
  4. Place the chromatography paper in the solvent, ensuring that the solvent does not cover the sample spots and leave until the solvent front nears the top of the paper.

Where the monosaccharide is colourless, you can visualise using a chemical stain within the sample or on the developed paper.

Compare the positions of the spots from the sample mixture to those of the known standard solutions.
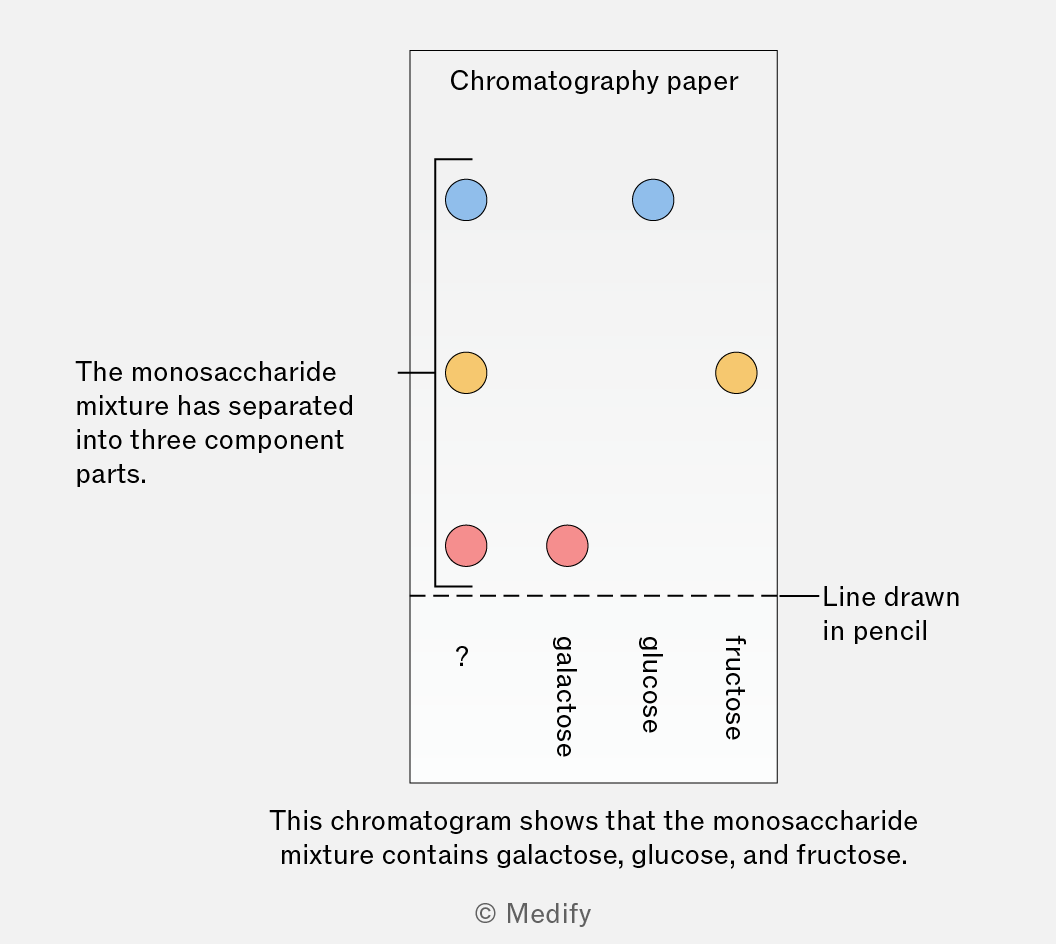
The image shows a chromatogram with a section labeled 'Chromatography paper'. Three colored spots are visible on the paper: blue at the top, yellow in the middle, and red at the bottom. To the right, labels are vertically aligned: '?', 'galactose', 'glucose', 'fructose'. A horizontal line labeled 'Line drawn in pencil' runs across the paper. An annotation on the left reads, 'The monosaccharide mixture has separated into three component parts.' Below the chromatogram, a caption states, 'This chromatogram shows that the monosaccharide mixture contains galactose, glucose, and fructose.'
Add to favourites

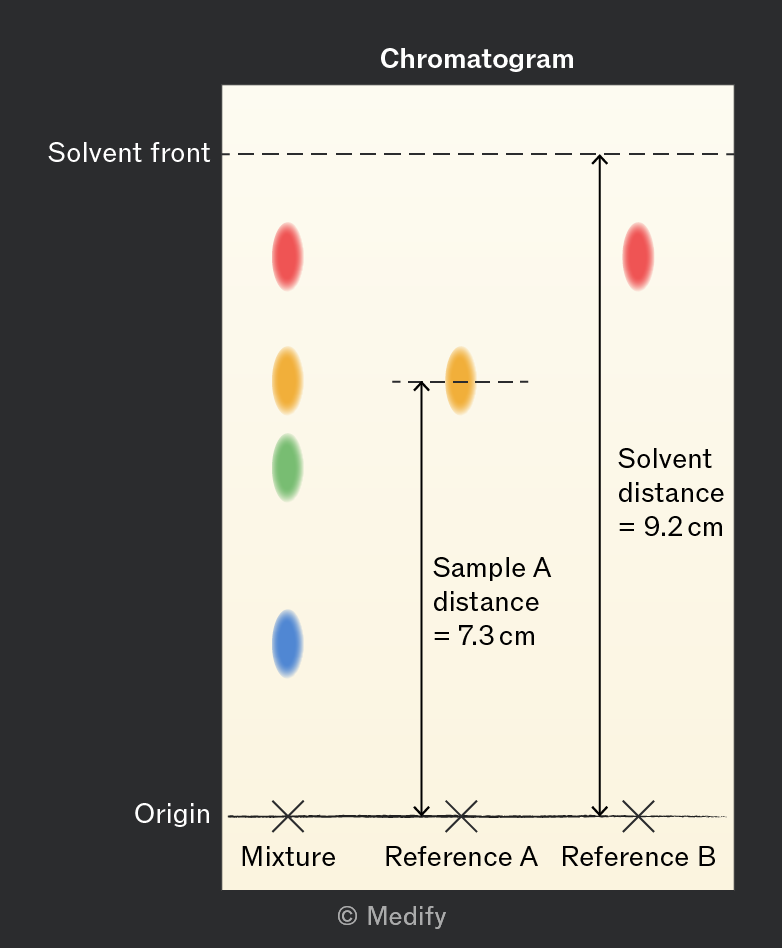
stands for retention factor and represents how far through a stationary phase a component has moved compared to the distance moved by its solvent.

Compounds can be identified by comparing their values to those of known substances.
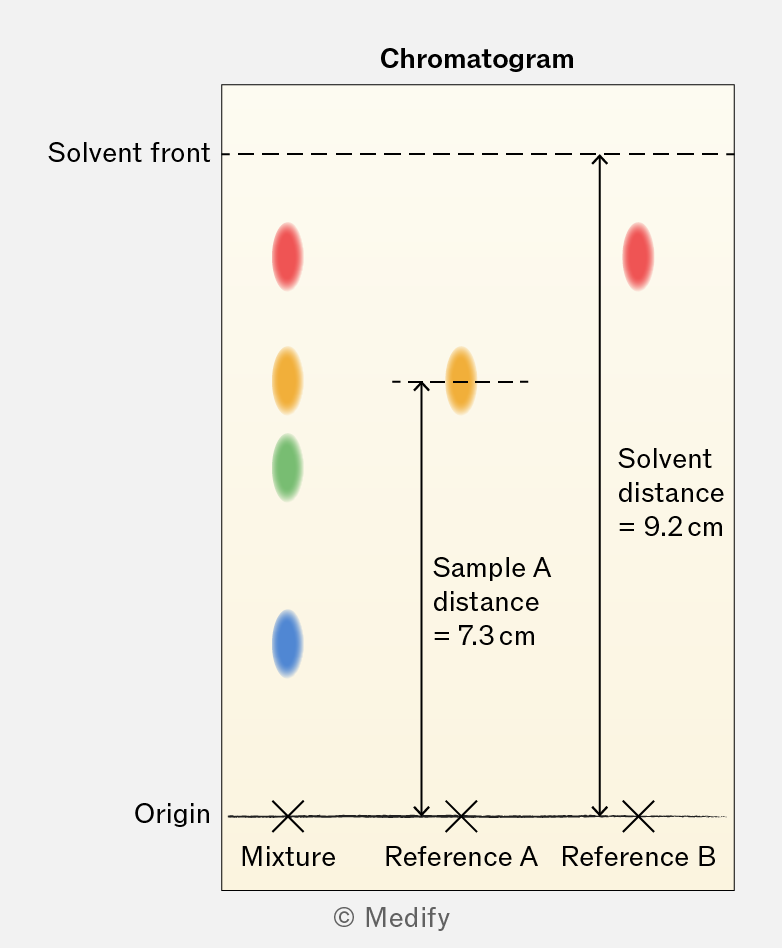
A chromatogram diagram showing the separation of a mixture into different colored spots. The solvent front is marked at the top, with distances labeled for Sample A (7.3 cm) and the solvent distance (9.2 cm). The origin is indicated at the bottom, with labels for the mixture and two reference samples (Reference A and Reference B).

For the chromatogram shown above, the calculated value of reference A is:

The greater the value, the closer the distance moved by a sample is to the distance moved by the solvent. This indicates a sample is more strongly attracted to the solvent than to the stationary phase.

All values will be less than 1.

Note that values are specific to the stationary phase and solvent being used.

Add to favourites