
Rate equations - AL only (3.1.9)
On this page
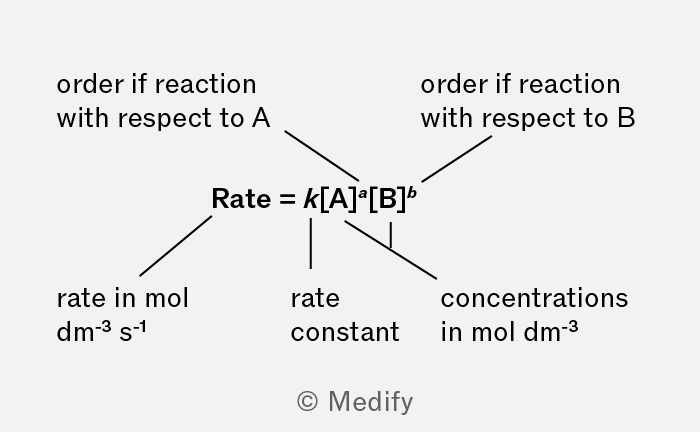
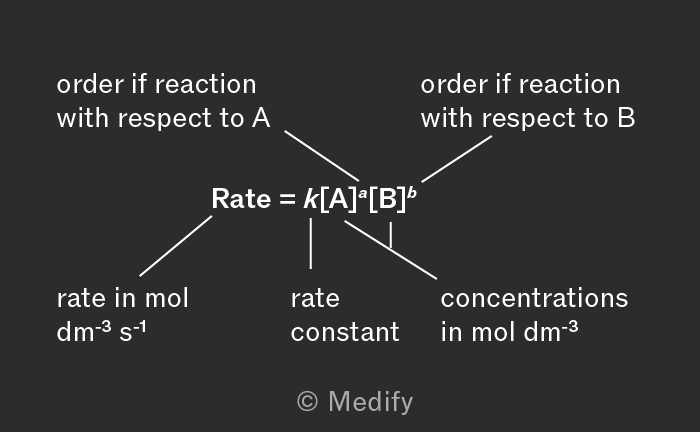
The rate equation shows the mathematical relationship between the rate of reaction, the reactant concentrations and the rate constant.
where:
- = rate constant
- = concentration of
- = order of reactant
- = concentration of
- = order of reactant .
The rate constant, , represents the proportionality constant in the rate equation. It relates the rate of a chemical reaction to the concentrations of reactants.
Rate constants are temperature specific; changing the temperature will change the rate constant.
The order of reactant refers to the exponent to which the concentration of a reactant is raised in the rate equation.
It represents how the rate of reaction is proportional to the concentration of that particular reactant.
where:
- = the concentration of reactant in
- = the order of the reactant
- = ‘is proportional to’.
When the concentration of a reactant has no impact on the rate of the reaction it is called zero order.
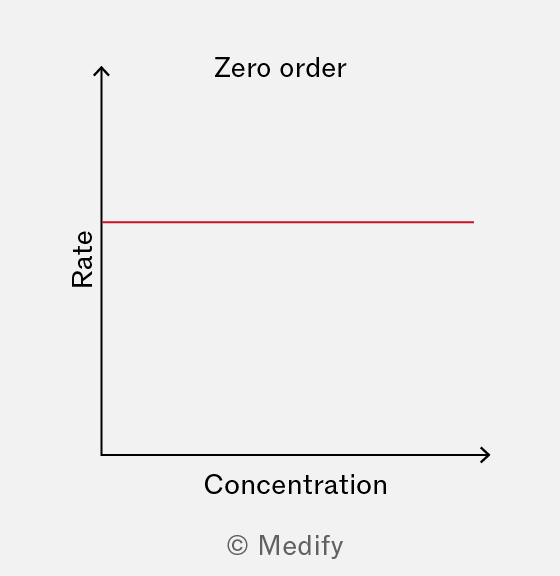
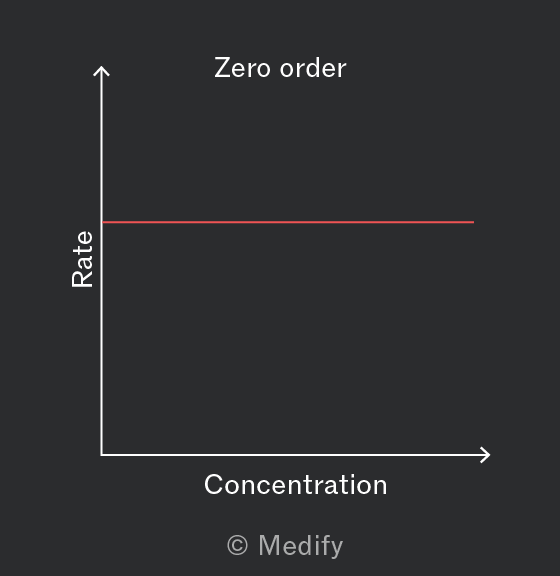
regardless of the concentration of . There is a zero gradient.
This can be seen on a rate–concentration graph as a horizontal line.
When the rate of reaction depends on the concentration raised to the power of one it is called first order.
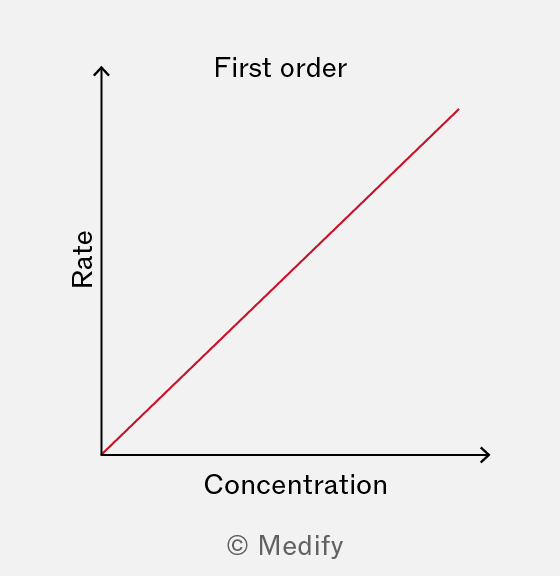
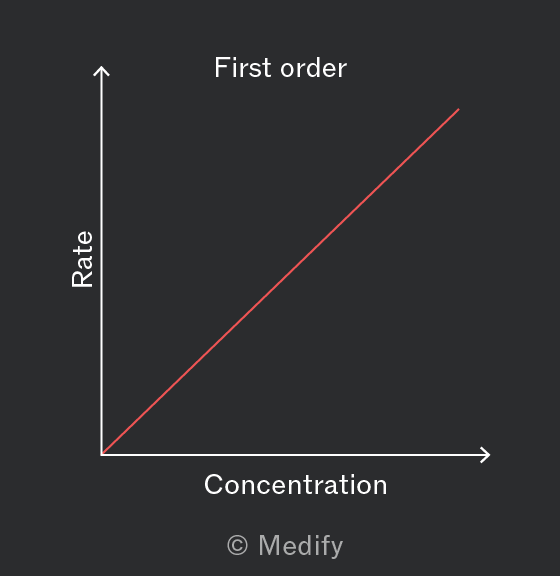
This can be seen on a rate–concentration graph as a directly proportional relationship; when the concentration of is doubled the rate will also double.
When the rate of reaction depends on the concentration of a reactant raised to the power of two it is called second order.
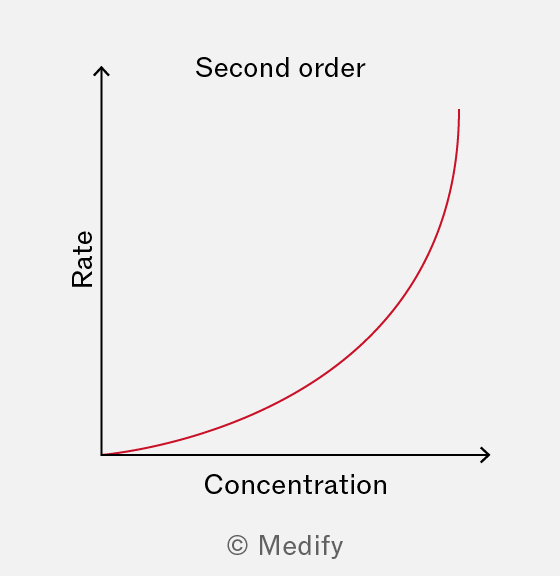
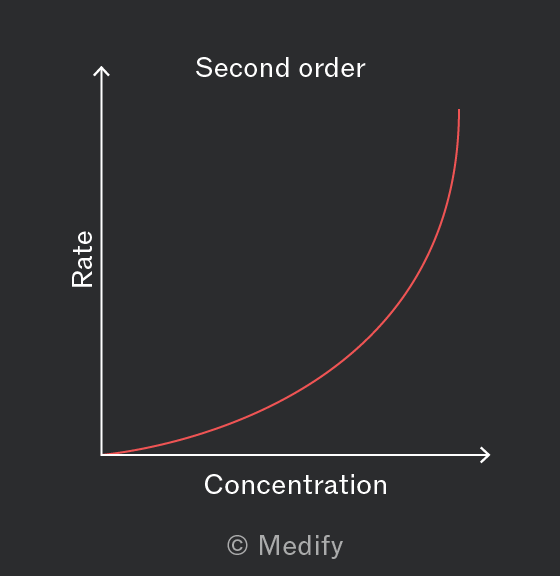
This can be seen on a rate–concentration graph as an increasing gradient; when the concentration of is doubled the rate will quadruple.
The overall order of a reaction is the sum of the orders of the reactants in the chemical reaction.
To calculate a rate constant:
- Determine the rate equation: this can be obtained experimentally using initial rates.
- Insert the known values into the rate equation.
- Rearrange to solve for the rate constant, .
- Determine the units of .
To calculate the units of the rate constant, , input the units for rate and concentration into the rate equation:
where:
- rate has the units of
- and have the units of
- and are the reaction orders with respect to and .
Rearrange the rate equation to make the subject, substitute in the units, then simplify.
For a second order reaction so:
Question walkthrough
Rate constants
Calculating a rate constant from experimental data
The rate constant, , is only valid for a given temperature. The value of increases exponentially with increasing temperature.
Higher temperatures increase the kinetic energy of particles and shift the Maxwell-Boltzmann distribution to the right. The proportion of particles with kinetic energy activation energy is increased.
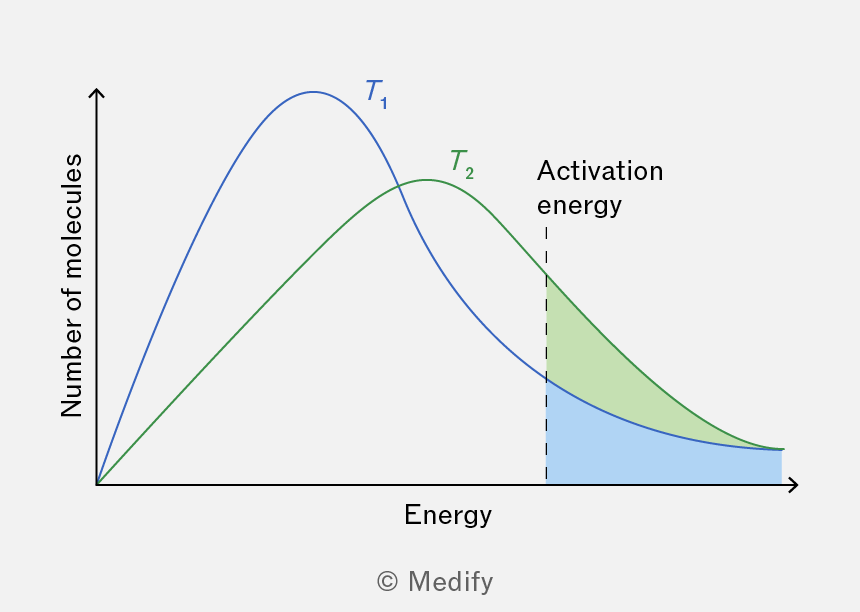
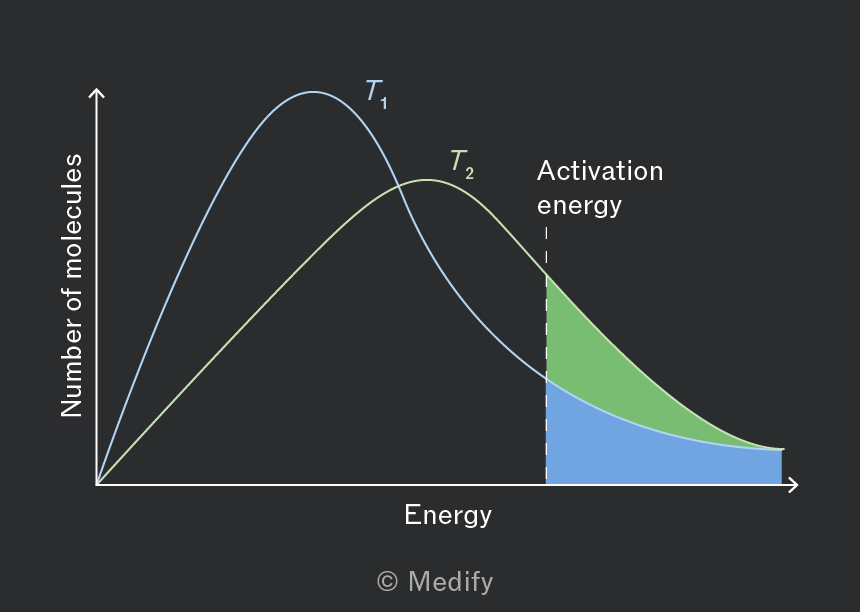
At higher temperatures there is increasing frequency of successful collisions; more collisions overcome the activation energy within a set time. This represents a higher rate of reaction.
If the rate of reaction increases, whilst the concentration of reactants remains constant, the value to must increase.
The Arrhenius equation describes the relationship between the rate constant, of a chemical reaction and temperature, It provides insight into how temperature influences the rate of a reaction.
The Arrhenius equation is represented as follows:
where:
- is the rate constant
- is the pre-exponential factor
- is the activation energy in
- is the gas constant
- is the temperature in kelvin.
To calculate the rate constant, , you can substitute the known values directly into the Arrhenius equation:
The gas constant, has a value of which will be privided.
The pre-exponential factor, , is sometimes called the frequency factor. It reflects the proportion of collisions with the correct orientation. It is constant for a given reaction under specific conditions and, unlike the rate constant, , the pre-exponential factor does not change with temperature.
The units for the pre-exponential factor, , match those of for a given reaction.
Ensure units are correct. Temperatures must be converted to kelvin, K, and activation energy, , to .
Where no graph is available, can be calculated algebraically using the linear form of the Arrhenius equation.
Note that you would be given the derived equation in an exam and do not need to be able to construct it.
Given you have rate constants, and , at two temperatures, and you can form a pair of simultaneous equations.
This derivation can then be used to calculate .
The Arrhenius equation can be manipulated to form a linear equation by taking the natural logarithm of both sides:
This can be plotted on a graph.
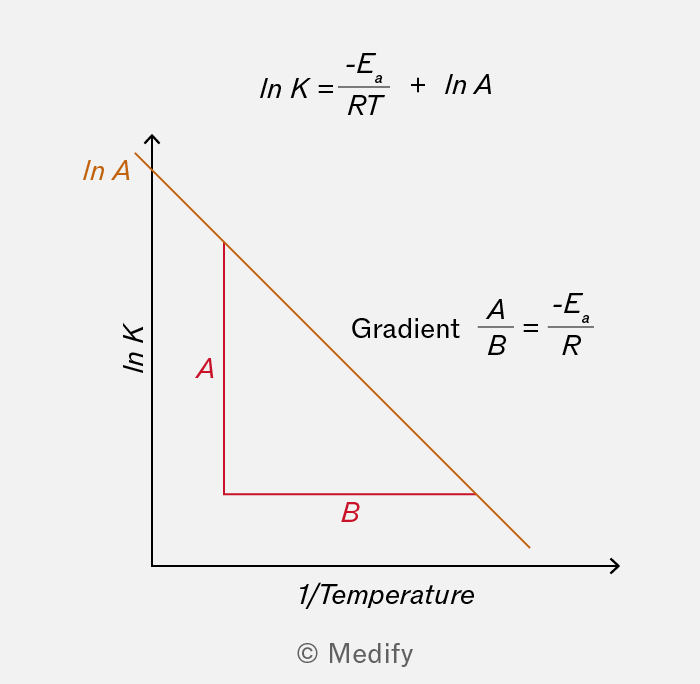
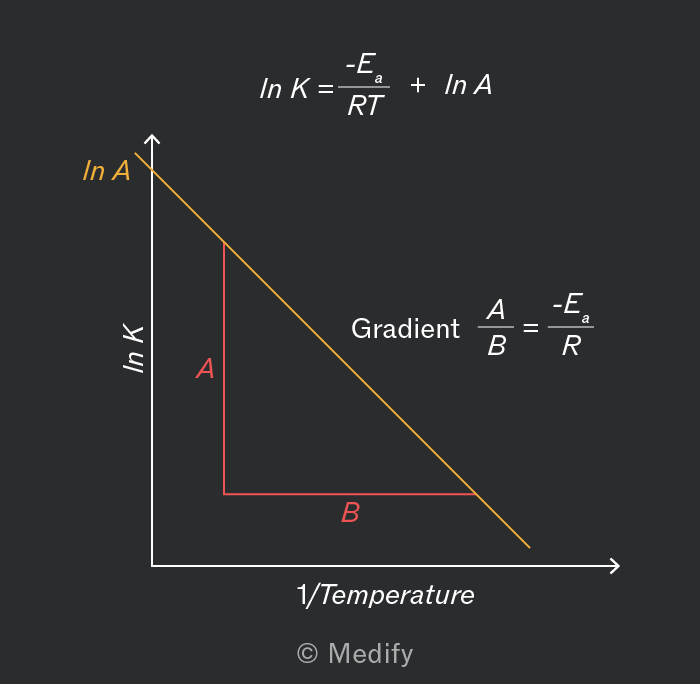
When is plotted against and , the gradient is and the y-intercept is .
These values can be extracted from the graph.
Question walkthrough
Rate constants
Calculating the rate constant using the Arrhenius equation
Question walkthrough
Activation energy
Calculating the activation energy using the Arrhenius equation
Continuous monitoring involves measuring the concentration of reactants or products at regular intervals throughout the reaction. The output is generally a concentration–time graph.
Continuous monitoring data can be collect by:
- colorimetry: measures the absorbance of a specific wavelength of light by the reaction mixture, which is directly related to the concentration of a coloured species.
- gas collection: measures the volume of gas produced or consumed in the reaction over time.
- titration: samples are withdrawn from the reaction mixture at regular intervals and titrated to determine concentration.
- mass loss: measures the decrease in mass of the reaction mixture due to the evolution of gas.
Zero order concentration–time graphs, obtained through continuous monitoring, are linear with a constant negative slope.
![A zero order concentration-time graph showing a linear decrease in concentration of a substance [A] over time. The y-axis represents concentration in mol dm⁻³, ranging from 0 to 2, while the x-axis represents time in seconds, ranging from 0 to 200. A rate calculation is included, indicating a rate of 0.01 mol dm⁻³ s⁻¹.](https://d3nzlfkeryzt6j.cloudfront.net/bldqas98kprwnr4pdhl7hzgpdbmj)
![A zero order concentration-time graph showing a linear decrease in concentration of a substance [A] over time. The y-axis represents concentration in mol dm⁻³, ranging from 0 to 2, while the x-axis represents time in seconds, ranging from 0 to 200. A rate calculation is included, indicating a rate of 0.01 mol dm⁻³ s⁻¹.](https://d3nzlfkeryzt6j.cloudfront.net/vdkmvg07toa4pcypk0ahn3zyay30)
For a zero-order reaction, the gradient of the concentration–time graph is constant and gives the rate constant, .
The unit for in a zero order reaction is .
First order concentration–time graphs are curved and initially show a rapid decrease in concentration, which slows down over time.
![Graph showing the concentration of substance [A] in mol dm⁻³ over time in seconds. The blue curve represents a decreasing exponential trend, while the red line indicates a linear decrease, both starting from a concentration of 6 mol dm⁻³ at time zero.](https://d3nzlfkeryzt6j.cloudfront.net/gfbjhda3zuxtzw1or5od87195whl)
![Graph showing the concentration of substance [A] in mol dm⁻³ over time in seconds. The blue curve represents a decreasing exponential trend, while the red line indicates a linear decrease, both starting from a concentration of 6 mol dm⁻³ at time zero.](https://d3nzlfkeryzt6j.cloudfront.net/44a5701e6ezkpnje3duowvtfzbr7)
For a first-order reaction, the gradient of the concentration–time graph changes over time.
The rate at a particular time, , is given by the slope of the tangent to the curve at that point.
- Draw a tangent to the curve at the specific time, .
- Determine the slope of this tangent using:
The initial rates method determines the rate law and rate constant by measuring the reaction rate at the very start when reactant concentrations have changed minimally. Initial concentrations are used in calculations.
Initial rates data can be collected by assessing progress after a fixed short period of time, or by measuring the time required for the reaction to progress to a defined milestone.
The final output is generally a rate–concentration graph or a table.
The iodine clock reaction is an initial rates experiment that measures the time required for a set amount of iodine to form.
A specific amount of sodium thiosulfate is included in the reaction mixture and this reacts with the iodine as it is formed.
When enough iodine has been produced to consume the sodium thiosulfate the excess iodine reacts with starch in the reaction mixture a colour change to blue–black is observed.
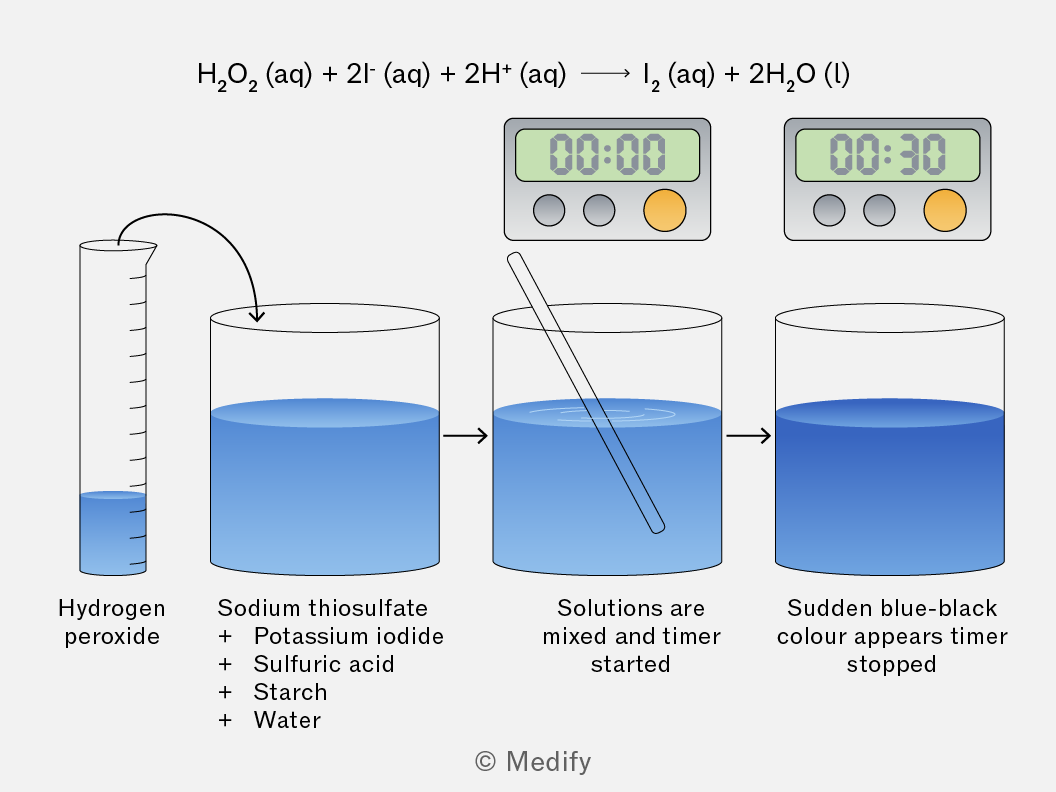
The rate in each instance is calculated by considering the concentration of iodine produced at the point of the colour change and dividing this by the time taken.
There is a ratio of . The concentration of iodine produced will be half the initial concentration of sodium thiosulfate in the reaction mixture.
For a first-order reaction, the rate of reaction is directly proportional to the concentration of the reactant:
Plotting the reaction rate (y-axis) against the concentration (x-axis) of the reactant will yield a straight line with a positive gradient:
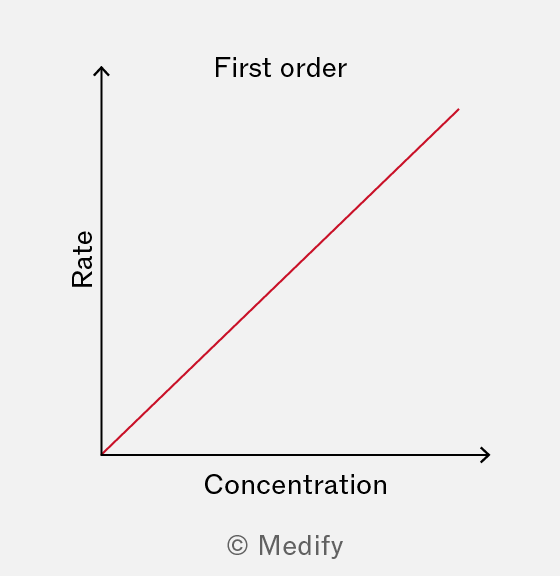
The gradient of the line gives the rate constant, .
The rate equation can be determined from experimental data using the initial rate method.
To analyse this data, find a pair of reactions where only one concentration changes to find the order with respect to that reagent.
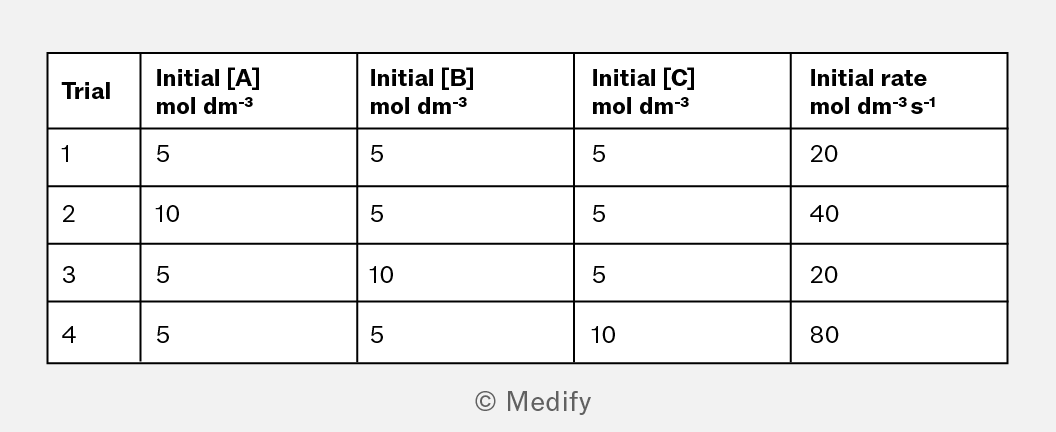
is a first order reactant: between trial 1 and 2, only changes. is doubled and the initial rate also doubles.
is a zero order reactant: between trial 1 and 3 only changes. is doubled and the initial rate remains constant.
is a second order reactant: between trial 1 and 4 only changes. is doubled and the initial rate quadruples (increases by a factor of
Therefore the rate equation for this reaction would be:
The stages in a multi-step chemical reaction do not occur at the same rate. The rate equation is determined by all the steps up to and including the slowest step, known as the rate-determining step.
For example in the two-step reaction of carbon monoxide, , with nitrogen dioxide, :
First step:
Second step:
The first step is slow and is therefore the rate determining step. Only will feature in the rate equation.
When provided with a chemical equation, the rate equation, and the steps in a multi-step mechanism, the rate-determining step can be deduced.
Given this chemical equation:
the rate equation is:
and the two-step mechanism is:
The rate equation tells us that only is involved in the rate-determining step. The concentration of the nucleophile will not influence the reaction rate.
This means the slowest step must be step 1.
Reaction mechanisms can be proposed using a balanced chemical equation and the rate equation.
Given the chemical equation:
and the rate equation:
The reaction is first order overall. This tells us that only one molecule of is involved in the rate determining step; this must be the first step. The second molecule will feature in a subsequent step.
A feasible two-step mechanism for this reaction is:
- (rate determining step)