Analogue and digital signals (3.13.2)
On this page
Electronic signals are defined as an electrical current containing information produced by a varying voltage. Electronic communication signals can be one of two types: analogue or digital.
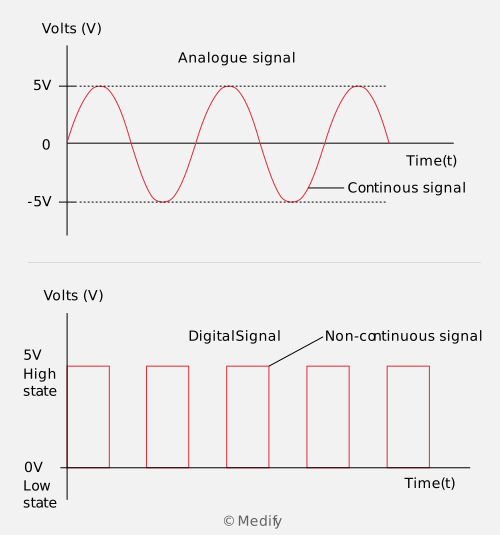
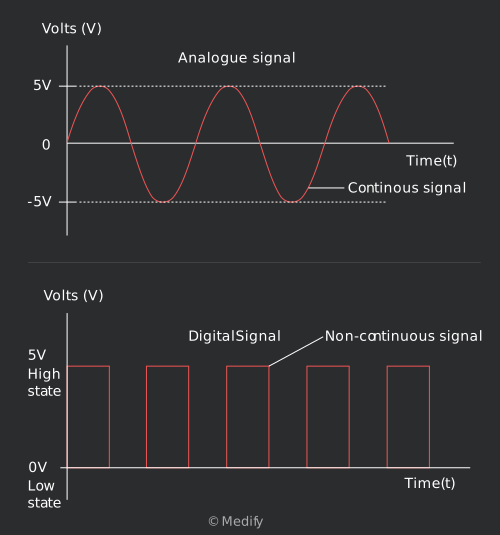
An example of an analogue signal and a digital signal is illustrated in the diagrams below.
Analogue:
- These signals are continuous, i.e. they can have an infinite number of values within a certain limit.
- The simplest type of analogue signal is the sine wave, though analogue signals tend to be more complex in shape.
Digital:
- These signals are non-continuous, i.e. they have just two states that it switches back and forth between.
- These two states are known as high (non-zero voltage, or ‘ON’) and low (low or zero voltage, or ‘OFF’). The two states are represented by 1 and 0.
- Typical values for the high and low states are and respectively. The time the signal spends in the ON and OFF states can be equal or different.
- A bit is defined as the basic unit of information in computers and digital communications. A bit can have two possible values, 0 or 1.
- A byte is defined as a unit of information consisting of 8 bits in length. Bytes commonly exist as multiples: kilobytes (kB), megabytes (MB) and gigabytes (GB).
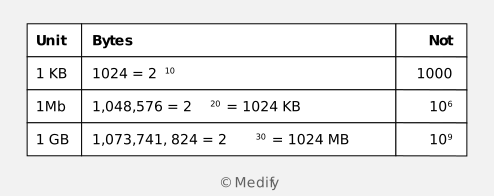
It is important to know that in data transmission, prefixes have their standard meanings (kilo = 103, mega = 106, giga = 109). However, in memory storage in computers, the prefixes are different.
The difference in the number of bytes for each prefix (kilo, mega, giga, etc.) for data transmission and computer memory storage is due to the use of binary numbers to represent digital signals.
Where the decimal system uses powers of 10 to represent numbers with 10 different symbols (e.g. 0 to 9), the binary system uses powers of 2:
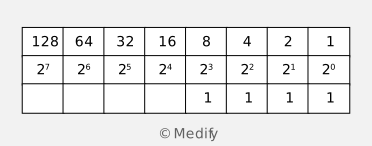
For example, the table above shows the decimal number 15 (1 + 2 + 4 + 8). This is represented in binary as 1111.
A combination of two states in the binary system, 0 and 1, can represent any number provided there are enough powers of 2 present – this makes the binary number system ideal for digital signals that have only two states.
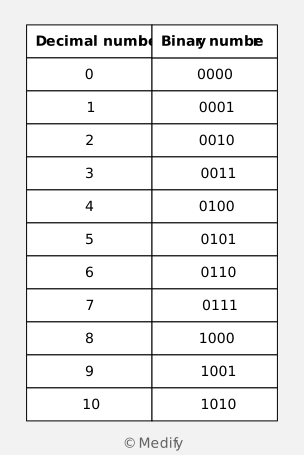
The table below shows the decimal numbers 0–10 in binary.
A digital signal that alternates between high and low states can represent a binary number. For example, the graph below shows a pattern of states consisting of 8 bits:
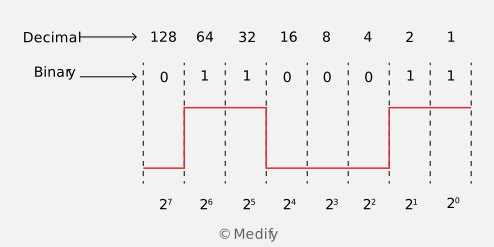
The graph above shows the digital signal as having alternating states LHHLLLHH. Since ‘high’ represents 1 and ‘low’ represents 0, the binary number of the digital signal above is 01100011. In decimal, this is equal to:
Question walkthrough
Converting a digital signal to decimal
Reads a high/low digital signal as an 8-bit binary number, then converts it to its decimal equivalent by summing the powers of 2 for each set bit.
Analogue audio signals consist of many waves of varying frequencies and amplitudes superimposed on one another. To correctly interpret an audio signal, every exact value in the signal must be detected and analysed. As a result, audio signals can be affected by minor distortions in the signal.
Audio signals contain noise. For instance, a waveform created by speech may contain unwanted background noise. There can also be noise created by random voltage fluctuations at different frequencies, resulting from interference from the electronics that process the signal.
An example of the effect of noise on a signal is illustrated below.
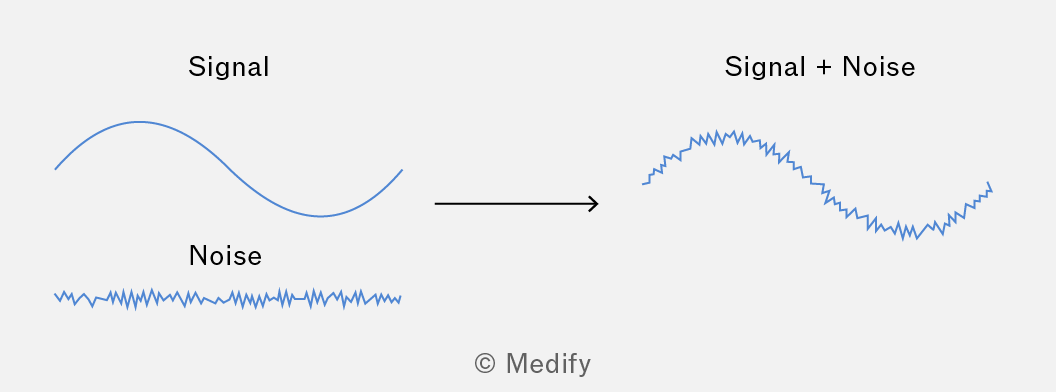
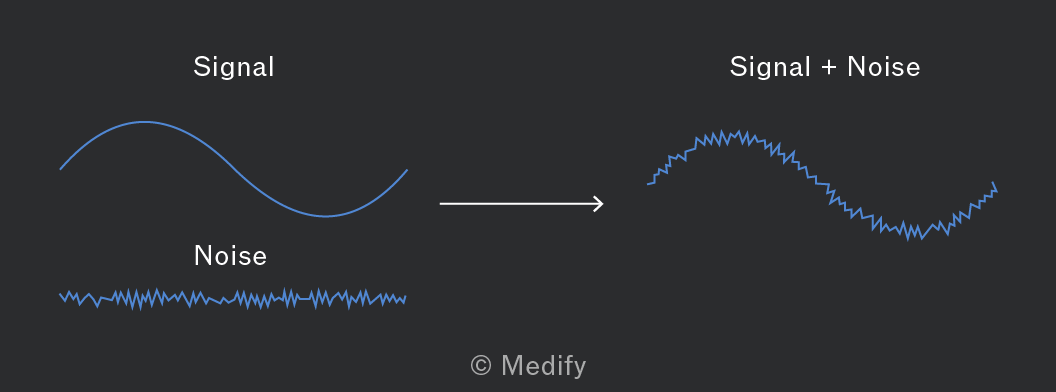
Analogue signals need to be amplified, which also amplifies the noise. With each stage of amplification, the signal becomes increasingly distorted from the original signal. The signal may reach a point where it is impossible to interpret.
The signal-to-noise ratio (SNR) is used to compare the signal level to the noise level.
The SNR can be expressed in multiple ways. For example, it may be expressed as a ratio of the amplitudes or as a ratio of the powers of the signals. A logarithmic SNR, measured in decibels (dB), is most often used and is found by:
The equation above may also be written as:
By expressing the power in terms of dB, there is no longer a need for the logarithm. Therefore, the SNR can be found simply by subtracting the noise power from the signal power .
Question walkthrough
Deriving SNR in terms of voltage
Uses P=V²/R and the power-form SNR equation to derive the voltage-form version, SNR_dB=20log(V_signal/V_noise), applying the log rule log(a^b)=b×log(a) to the squared voltage ratio.
Digital signals can also possess noise. However, since digital signals consist of only high and low states, the noise is contained within the pattern. Therefore, digital signals, even with noise, can still be interpreted, even if the shapes of the states are slightly distorted.
An example of noise in a digital signal is illustrated in the graph below.
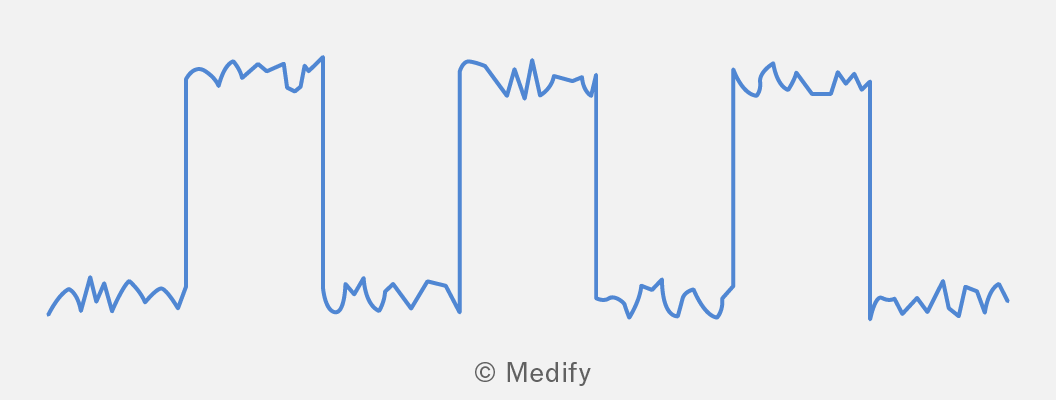
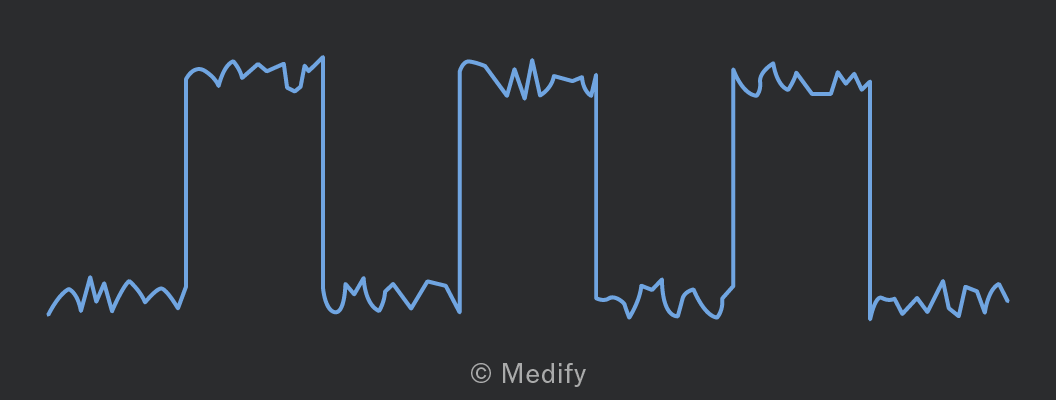
As the graph shows, even with noise present, the high and low states can still be clearly identified and interpreted. As a result, digital signals are highly immune to noise.
The noise on a digital signal is usually much lower in amplitude than the amplitude of the high state. Therefore, the electronics can filter most of the random noise and retain the original signal. This is one of the reasons why data is converted from analogue to digital – it prevents signal degradation (due to interference) when the data is transmitted and processed.
Sensors are defined as devices that detect and respond to specific types of analogue signals. Signals from the environment, such as light, sound and temperature, are all analogue signals.
Sensors also function as transducers. They detect a physical signal and convert it into an electrical signal, such as current or resistance. An analogue voltage can then be transmitted from the sensor for processing.
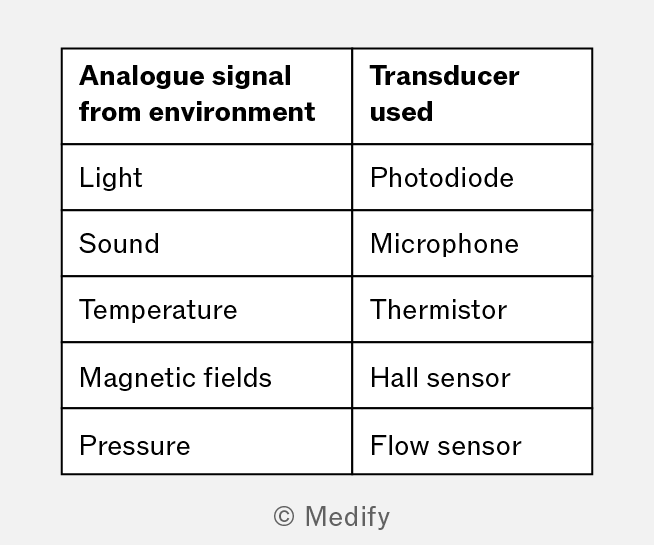
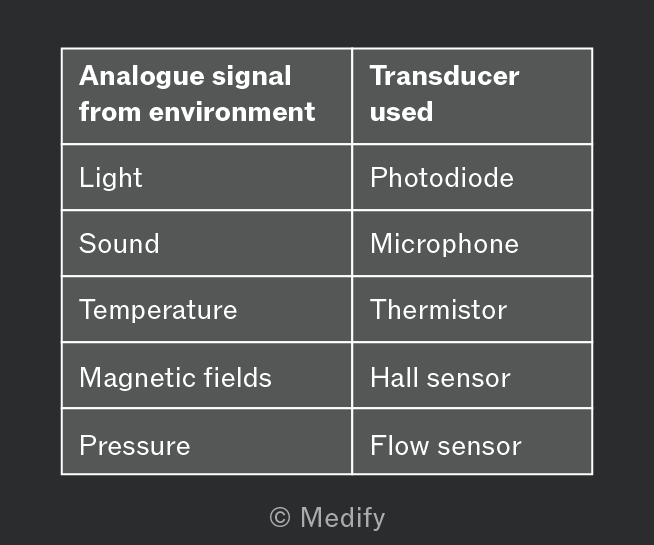
The table below provides examples of environmental analogue signals and the corresponding transducers.
Analogue outputs from sensors have three main characterisations:
- Sensitivity is the amount the output quantity changes per unit change of the input quantity. The output quantity is usually the voltage, but some sensors may use current instead. For example, a light-dependent resistor (LDR) has a sensitivity in units of (amps per watt).
- Resolution is the smallest detectable change in the measured physical input that the sensor can measure, expressed as a ratio relative to the measured value. So, it is a dimensionless quantity. For example, if a microphone can detect a change of when measuring then the resolution is:
- Response time is the time it takes for the sensor to completely respond to a change in the input.
A voltage output that varies with time from a sensor is considered to have a complex range of different frequencies superimposed on one another. These types of analogue signals possess a bandwidth that is defined by:
The outputs from sensors need to be converted so that they can be processed by a computer. Therefore, the output needs to be converted from an analogue form to a digital form – this is accomplished by an analogue-to-digital converter (ADC).
The image below shows the integrated circuit of an ADC, which converts an analogue signal to a digital one.
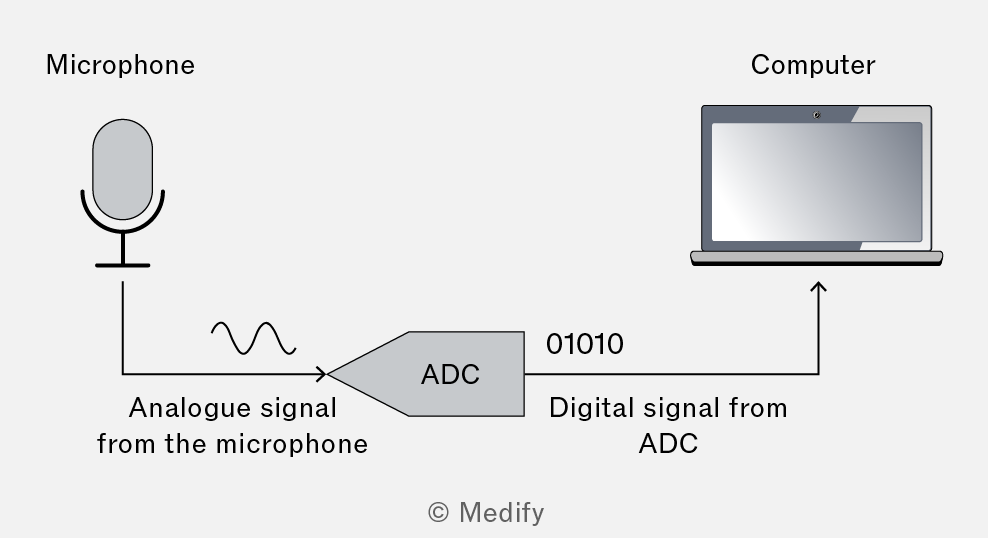
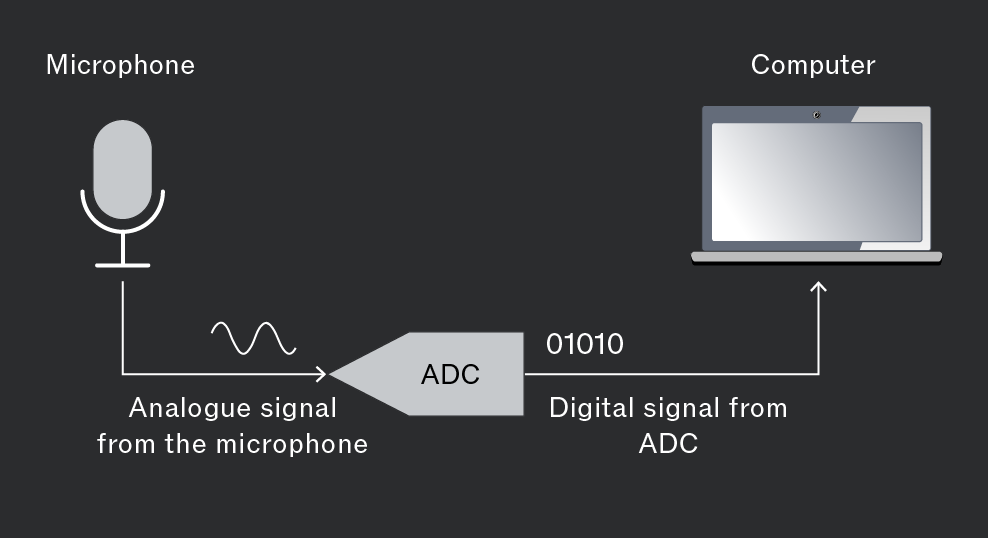
The ADC converts the signals using a technique known as sampling. The analogue signal passes through a sampling gate that samples the signal’s value over a certain time interval. The time interval is determined by an external clock pulse.
Analogue signals are sampled at regular time intervals, and the voltage is measured at each interval. An example of how sampling generates a digital output signal is shown below.
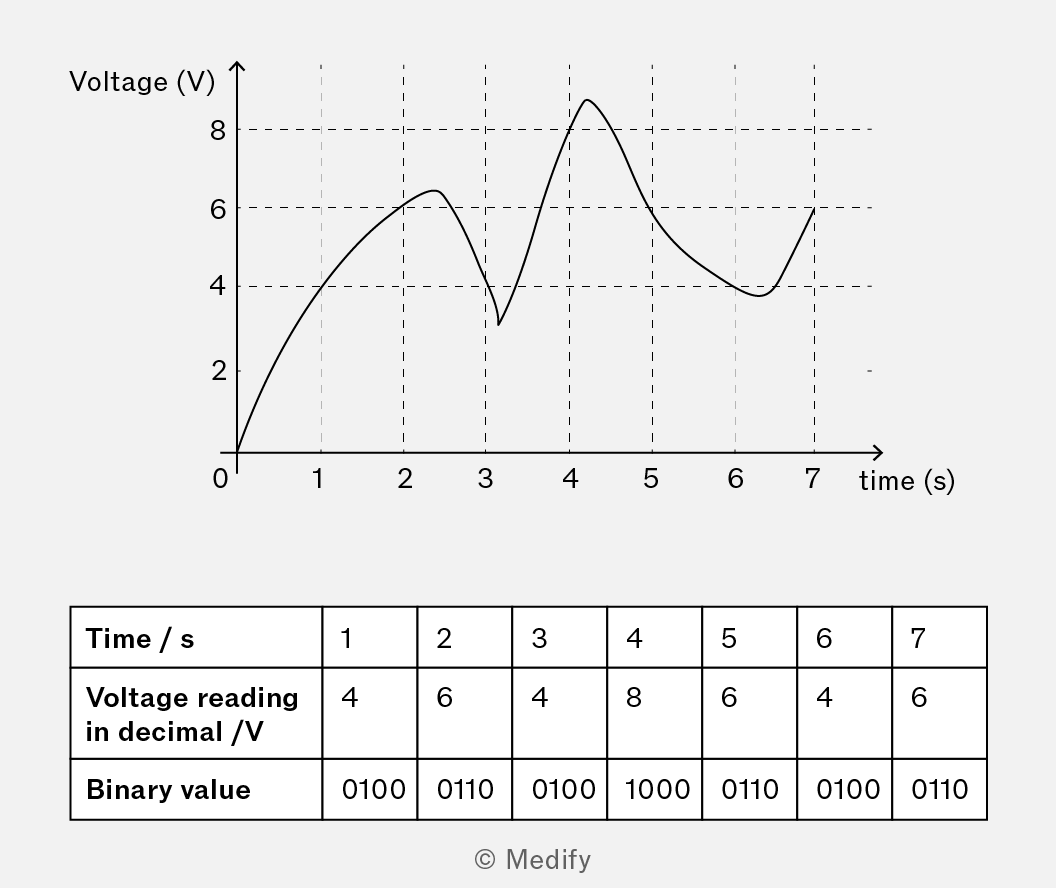
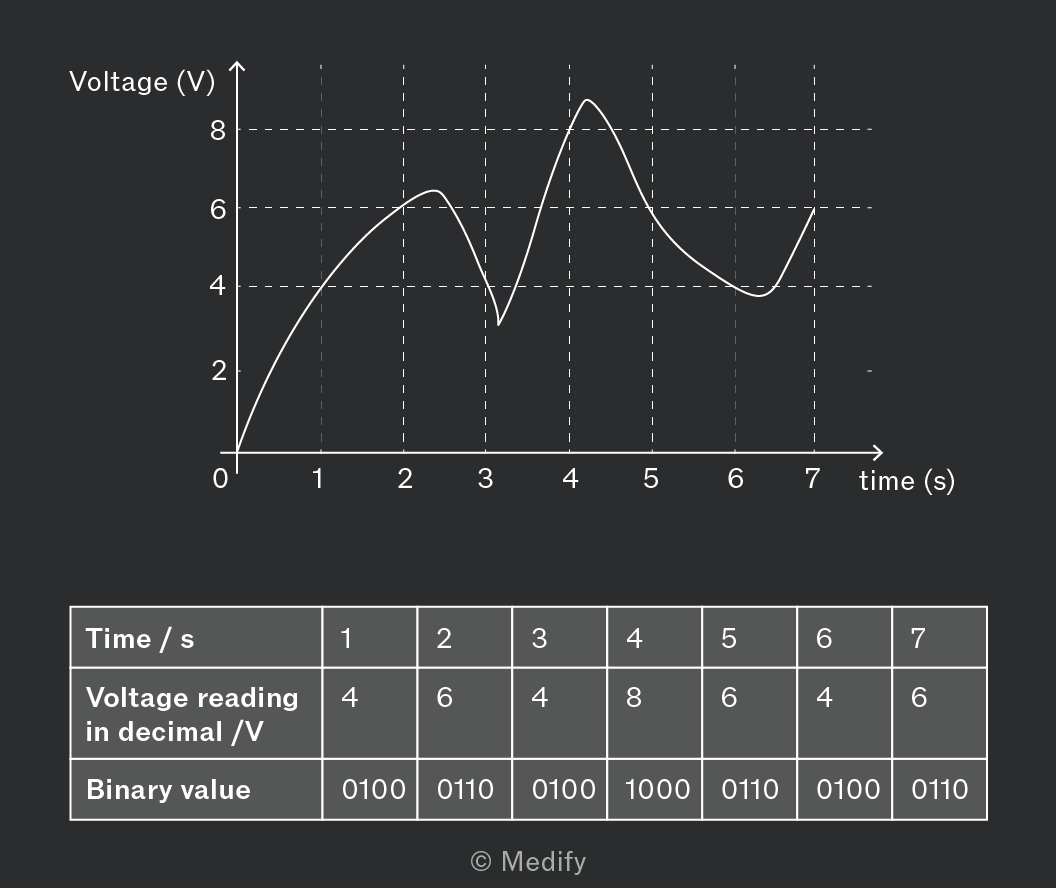
The graph shows the voltage varying over time and is sampled at 1-second intervals. The associated binary number for each voltage measured is shown in the table above.
Each measured voltage reading has an associated binary value, which forms a pattern of digital high and low states. This can then be fed into and interpreted by a computer.
It is essential to select a suitable sampling rate, as low sampling rates will result in a poor digital copy of the analogue signal. A low sampling rate will miss many values between the sampled values. It will therefore not provide a complete digital copy of the signal.
To produce a digital signal that accurately reflects the analogue signal, a high sampling rate is required. The sampling rate is determined by sampling theory, defined by Harry Nyquist:
- The theory states that for the digital signal to be an accurate reconstruction of the analogue signal, the sampling rate must be at least double the highest frequency component in the analogue signal.
For example, if an analogue signal has a bandwidth ranging from up to , then the sampling rate must be at least
An important factor in achieving high-quality analogue-to-digital conversion is quantisation. Quantisation defines the available number of voltage values that can be measured.
The quantisation is determined by the number of bits used for each sample. For example, if the number of bits is 4, then the number of possible voltage values is 16 (0 to 15). When a sample is taken, the analogue value needs to be quantised to the nearest available digital value.
- The difference between the sampled analogue value and the available digital value is known as the quantising (or approximation) error.
For example, if a digital signal cannot read a voltage fractionally, it will be rounded to the nearest whole integer. A voltage of will be interpreted as a reading, and the reading will be encoded in binary as 0010.
If a quantising error is too large, then smaller voltage intervals are required in order to increase the accuracy of the reading. For example, if mV are used, then can now be read as . However, larger numbers require more binary digits for encoding.
To increase the number of values that can be accurately read, the number of binary digits (bits) needs to be increased.
- The number of possible values with bits is
For example, 4-bit sampling gives possible values, and 8-bit sampling gives possible values.
The three steps in the analogue-to-digital conversion process are:
- Sampling is the process of reading the values of the analogue signal at equally spaced time intervals at a fixed sampling rate.
- Quantisation is the process where each sample is assigned a discrete value from a range of possible values.
- Encoding is the process by which sampled values are represented as a binary number using a specific number of bits, depending on the desired accuracy.
This three-step process in analogue-to-digital conversion is known as pulse code modulation and is represented in the diagram below.
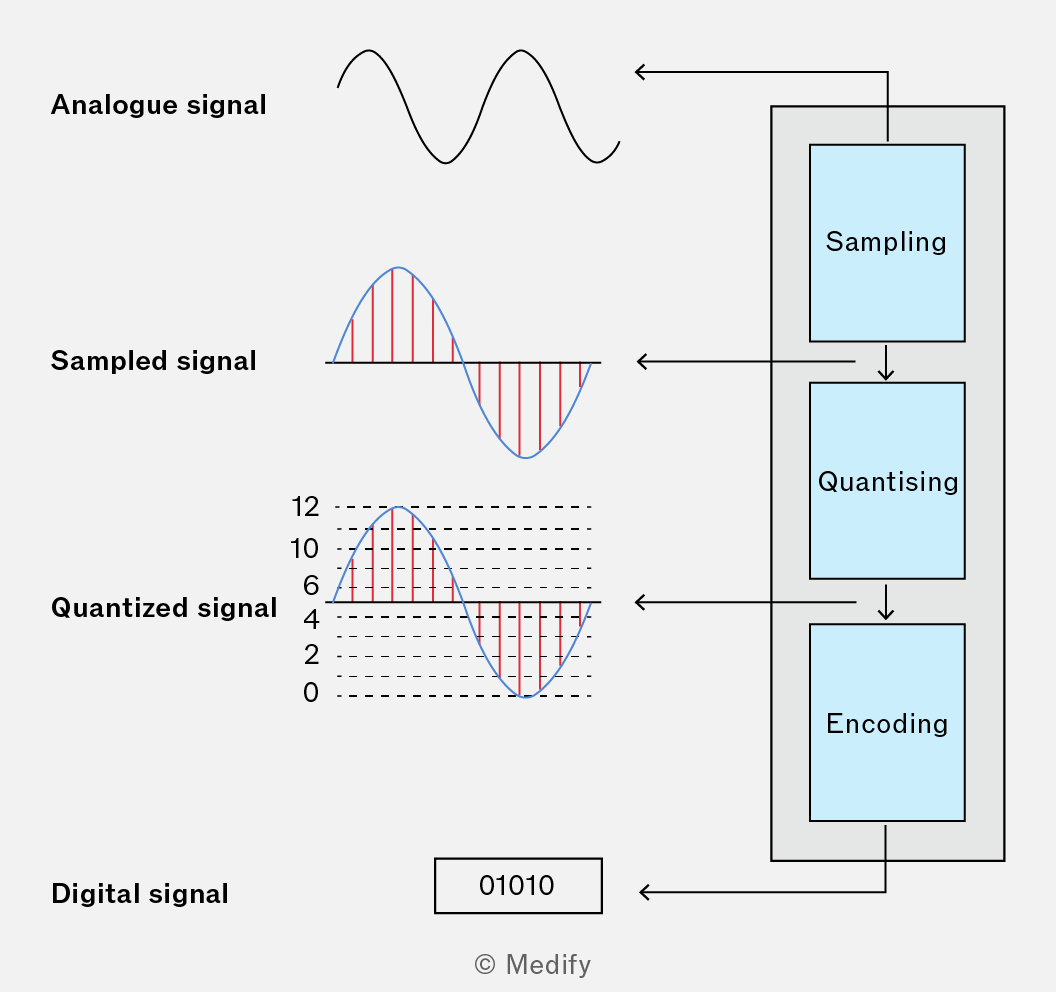
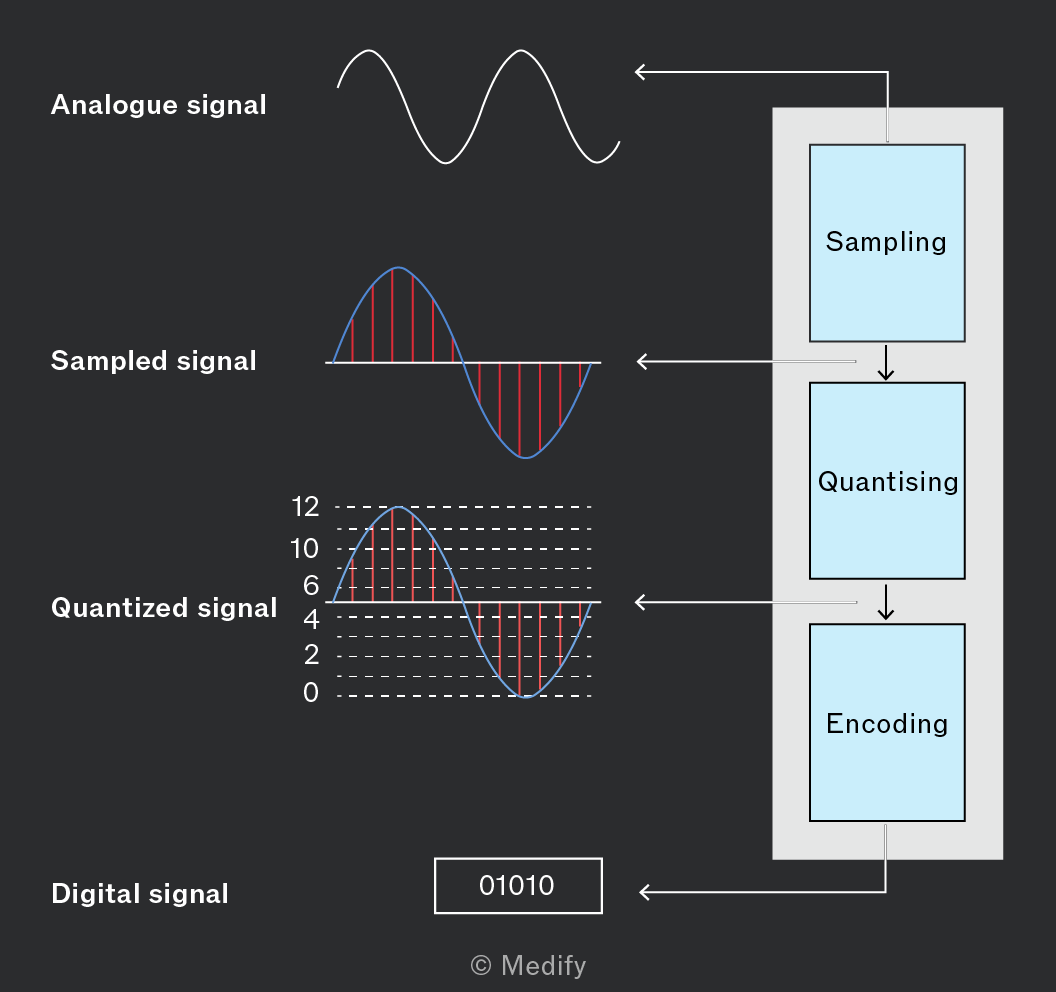
At the end of the process are binary numbers – this is known as a pulse code modulated (PCM) signal. The bit rate of a PCM signal is defined as the number of bits generated per second during the sampling process. It is calculated by:
The bit rate is measured in however, it is usually expressed as (or kbps) and (or Mbps).
Question walkthrough
Finding digital signal bit rate
Uses 2^N=1024 to find the number of bits per sample, then multiplies by the Nyquist sampling frequency (twice the maximum audio frequency) to find the digital signal’s bit rate.
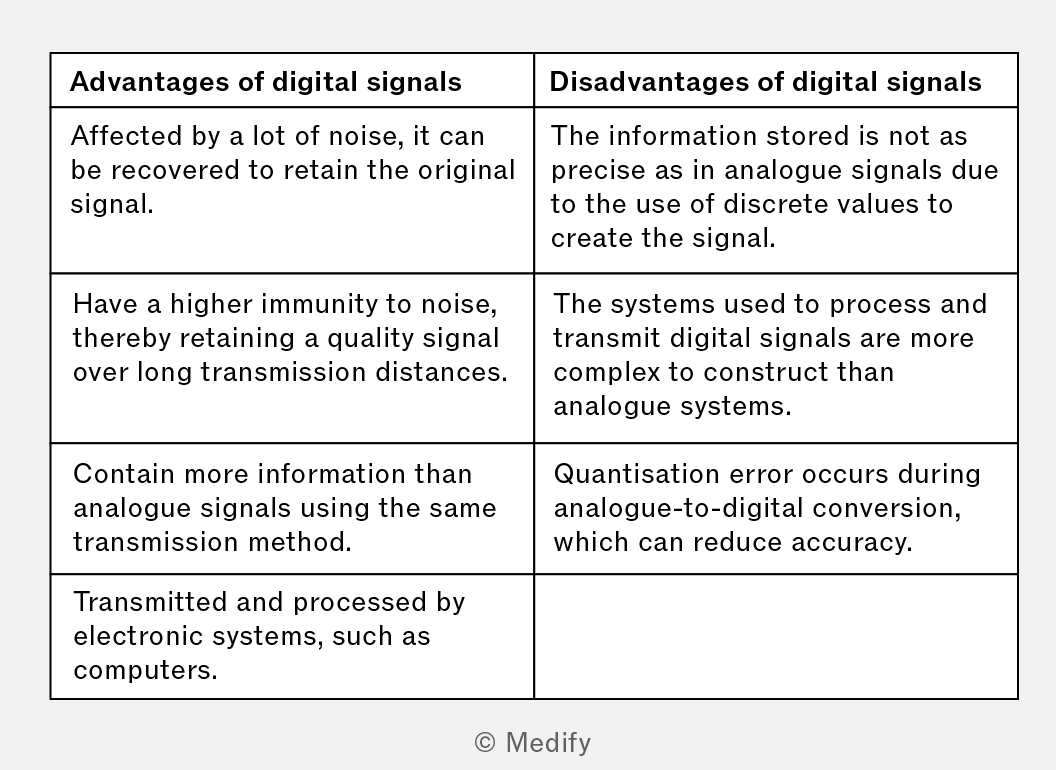
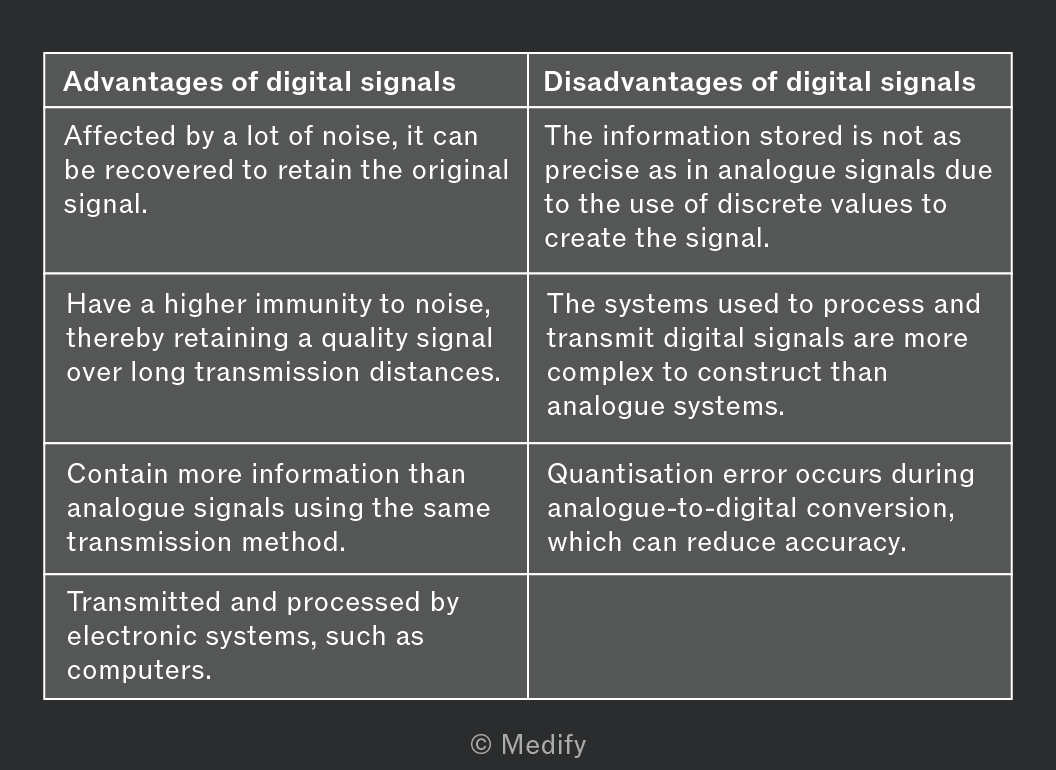
There are advantages and disadvantages of using digital signals over analogue signals. Some of these are presented in the table below: