
Kinetics
On this page
Collision theory states that for a chemical reaction to take place, particles must collide in the correct orientation and with sufficient energy.
Activation energy, is the energy barrier that must be overcome for the reaction to proceed. It is typically measured as the energy difference between the reactants and the transition state.
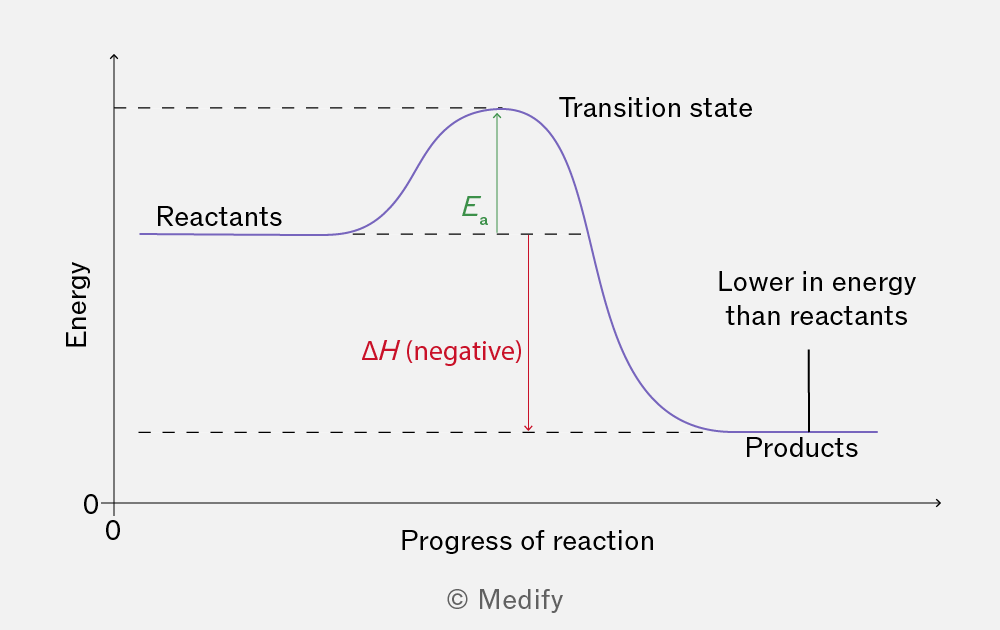
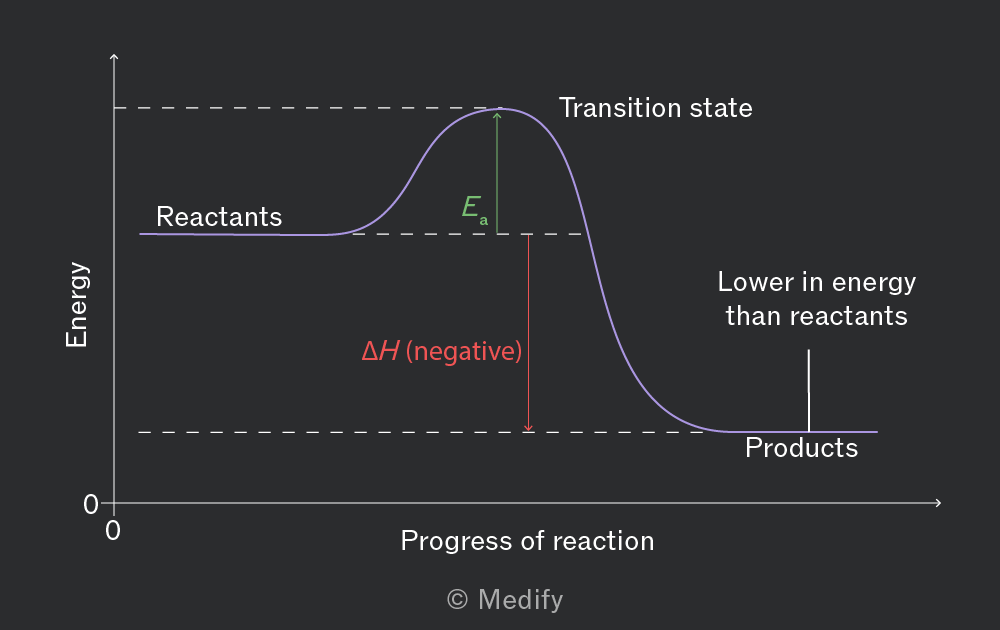
This means that for a successful collision to occur, the reactant particles must collide with energy equal to or above the activation energy.
If reactant particles collide with sufficient energy (equal to at least the activation energy, ) and in the correct orientation they will react, leading to an effective collision.
If reactant particles collide with insufficient energy, they bounce off of each other and it will be an ineffective collision.
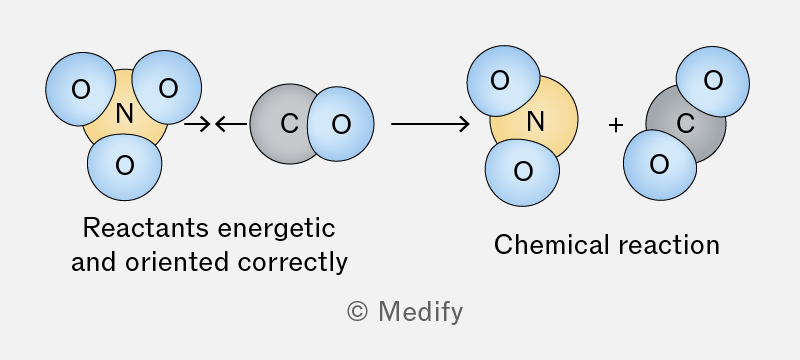
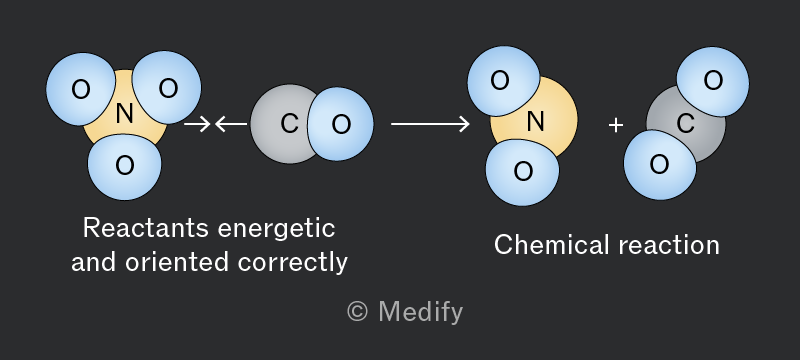
If reactant particles collide in the incorrect orientation, they will bounce off each other resulting in an ineffective collision.
There are several factors which can increase the frequency of collisions such as:
- increasing concentration
- increasing pressure
- increasing surface area
- increasing temperature.
Frequency of collisions is defined as the number of collisions per unit time.
If the frequency of collisions increases, the frequency of effective collisions will also increase. This will cause an increase in the rate of the chemical reaction.
If the concentration of solutions is increased there are more particles per unit volume.
This will increase the frequency of collisions, and therefore the frequency of effective collisions will also increase.
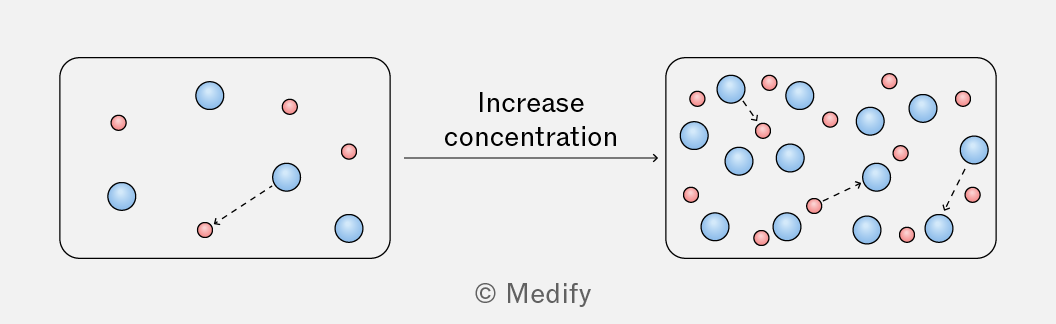
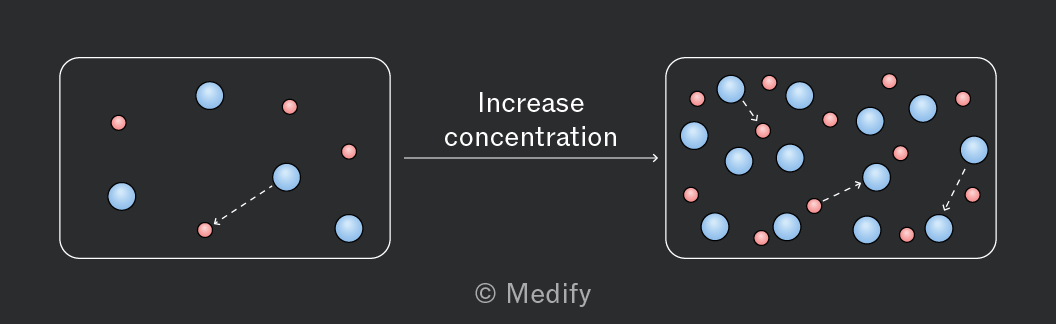
In the diagram above, the concentrations of the reactant particles have increased. This would increase the frequency of effective collisions , and therefore increase the rate of reaction.
If the pressure of gaseous reactants is increased it has a similar effect to increasing the concentration.
Although the number of particles remains the same, the volume is decreased, and therefore the gaseous particles are more tightly packed. There are more gaseous particles per unit volume.
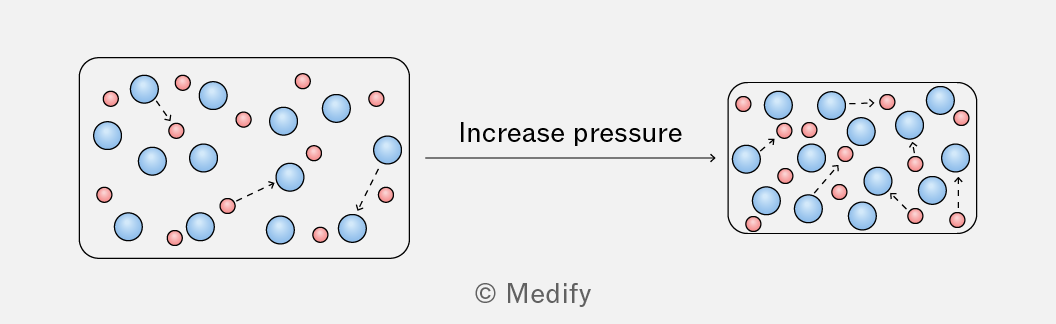
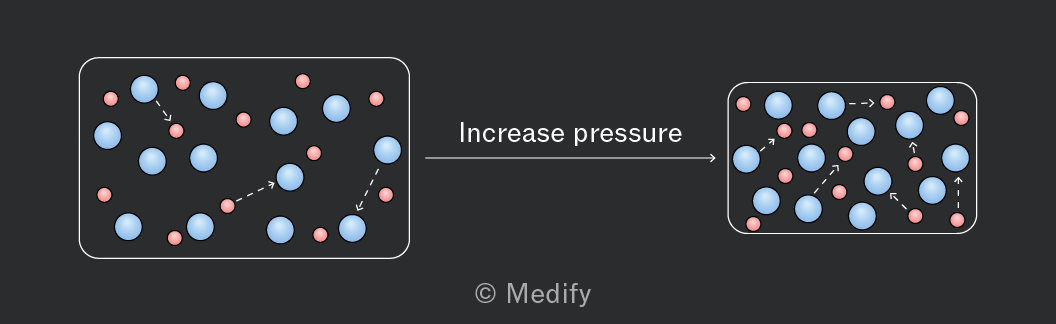
Increasing the number of particles per unit volume will increase the frequency of effective collisions, leading to an increase in the rate of reaction between the gaseous reactants.
Increasing temperature causes an exponential increase in reaction rate due to the increase in both the frequency of collisions and the proportion of collisions which are successful.
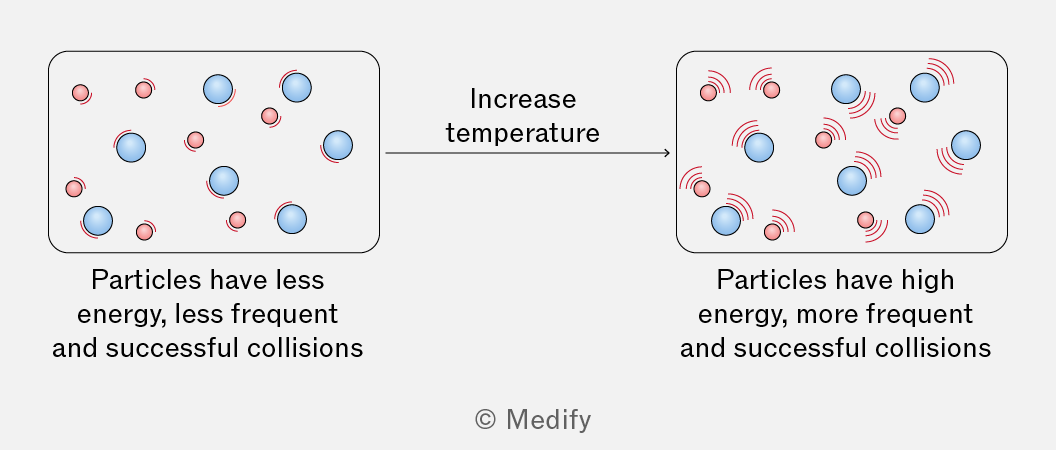
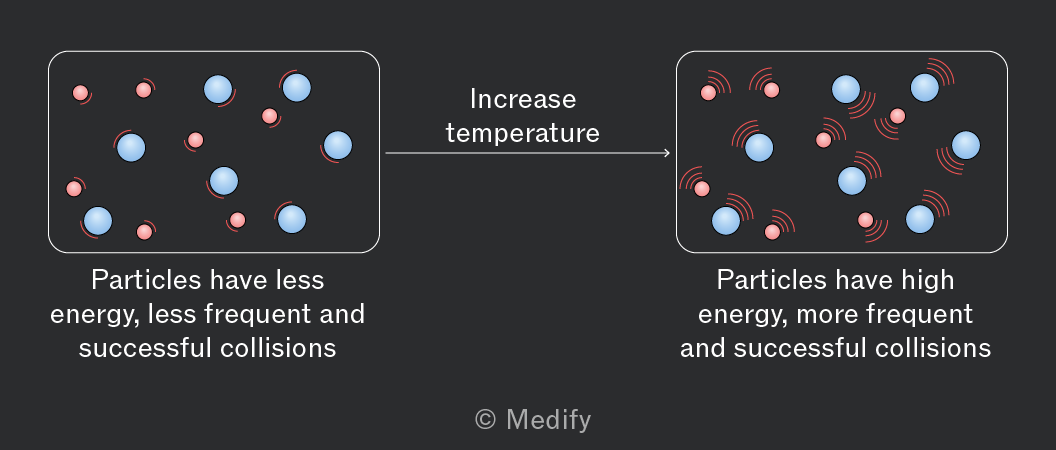
If the temperature of a chemical reaction is increased, the reacting particles gain more kinetic energy and therefore move faster.
This will increase the frequency of collisions and the energy of the collisions, leading to a greater proportion of collisions exceeding the activation energy.
Breaking a solid into smaller pieces increases the surface area, leading to a higher rate of reaction.
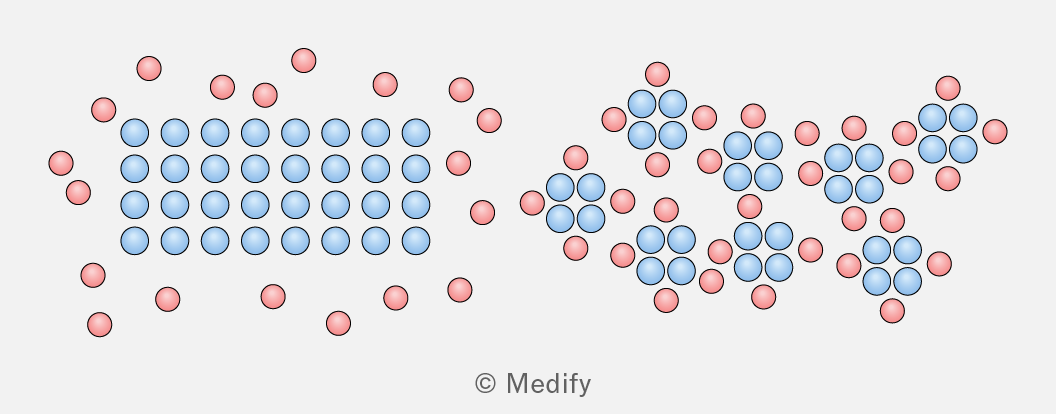
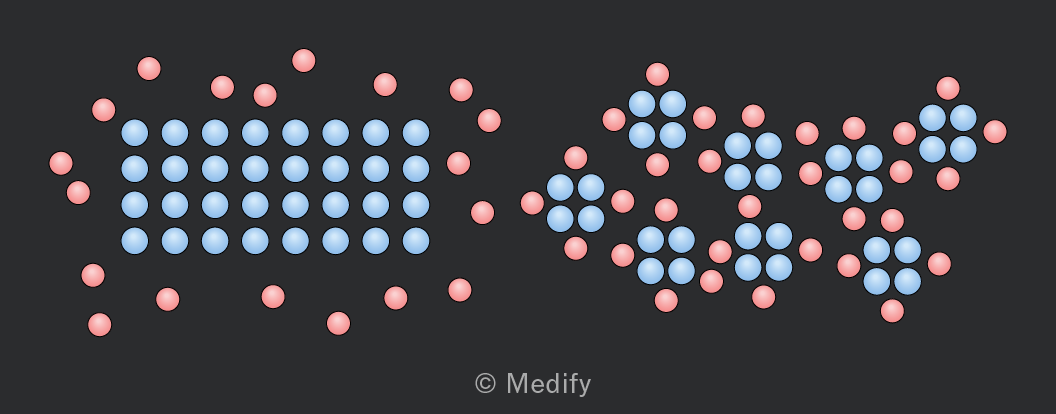
If the surface area of a solid reactant is increased, more particles are exposed to react with other reactants.
This will increase the frequency of collisions and therefore the frequency of effective collisions
Catalysts increase the rate of a chemical reaction but are not used up by the overall reaction.
Catalysts increase the rate of a chemical reaction by providing an alternative reaction pathway with a lower activation energy.
This can be shown on enthalpy profiles.
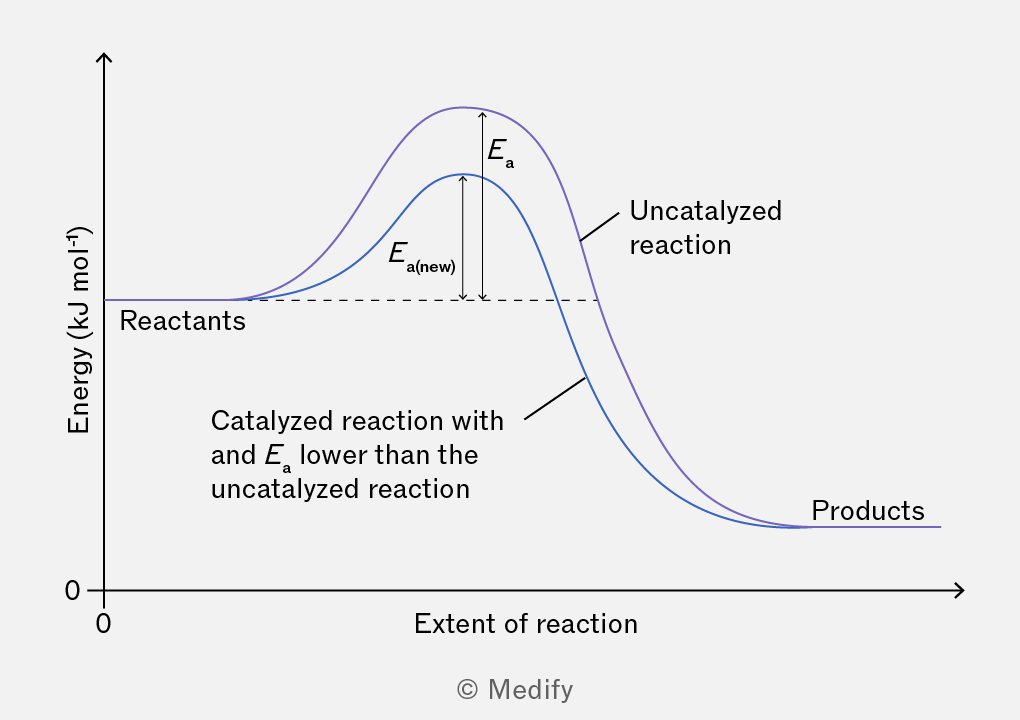
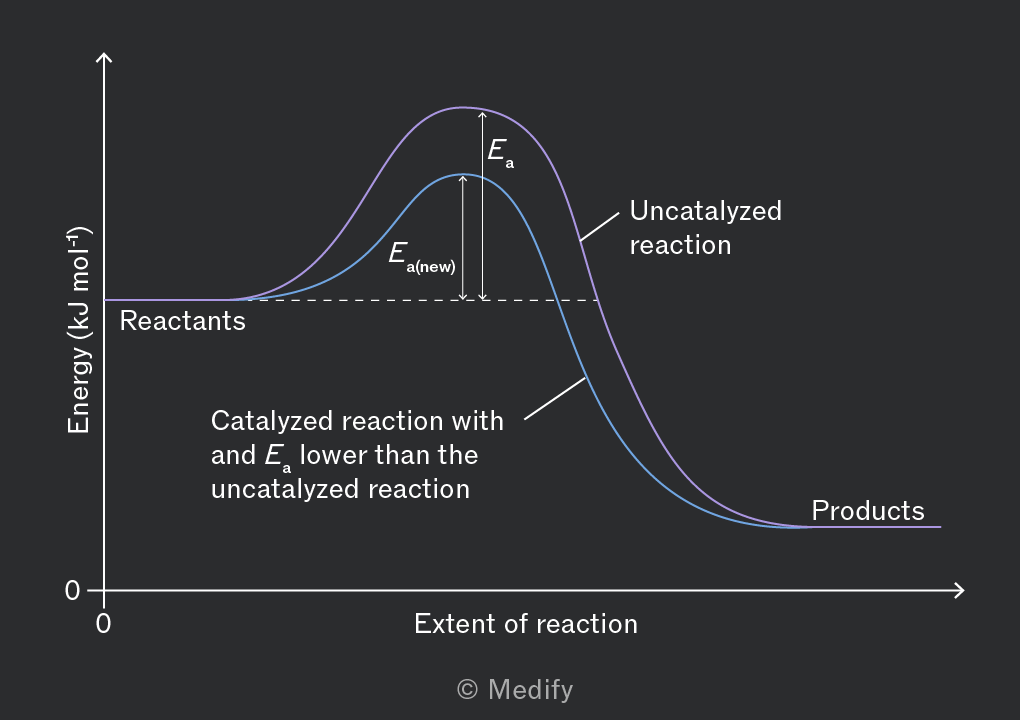
Although catalysts increase the rate of a chemical reaction they do not impact the total frequency of collisions. However, they do increase the proportion of successful collisions and therefore the frequency of successful collisions.
There are two different types of catalysts.
Homogeneous catalysts are catalysts which are in the same phase as the reactants in the chemical reaction. For example gaseous chlorine free radicals in the decomposition of the gaseous ozone layer.
Heterogeneous catalysts are catalysts which are in a different phase to the reactants in the chemical reaction. For example the use of solid iron in the Haber process where the reactants – nitrogen and hydrogen – are in the gaseous phase.
Catalysts provide an alternative reaction pathway with a lower activation energy. This allows chemical reactions in industry to be carried out at lower temperatures and pressures.
- Lower temperature: less energy required.
- Lower pressure: reduces the amount of electricity required to artificially increase the pressure.
Reductions in energy consumption are directly linked to a reduction of cost and lower carbon emissions.
The Maxwell-Boltzmann distribution curve is a graphical representation showing the distribution of energies of molecules at a particular temperature.
The Maxwell-Boltzmann distribution curve plots the number of molecules on the axis and energy of the molecules on the axis.
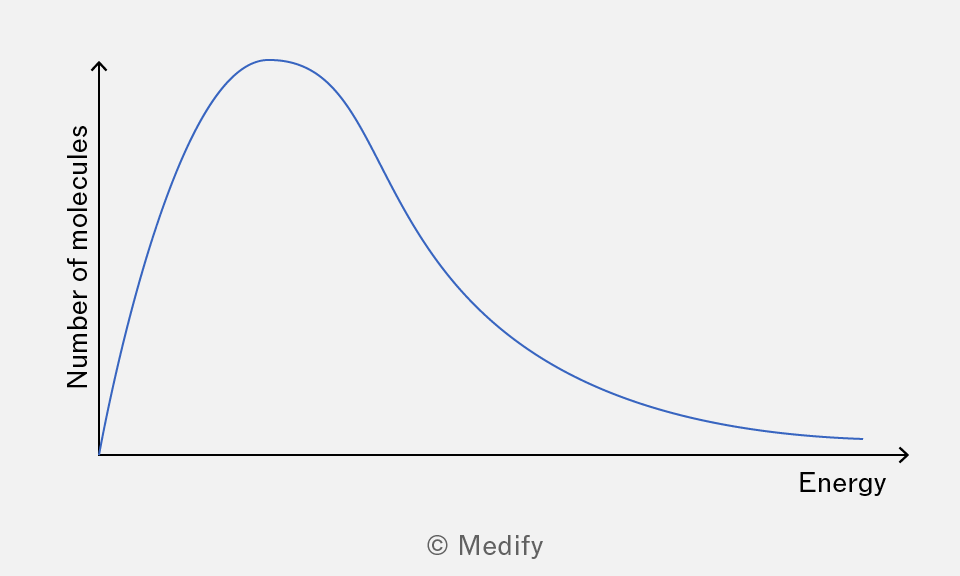
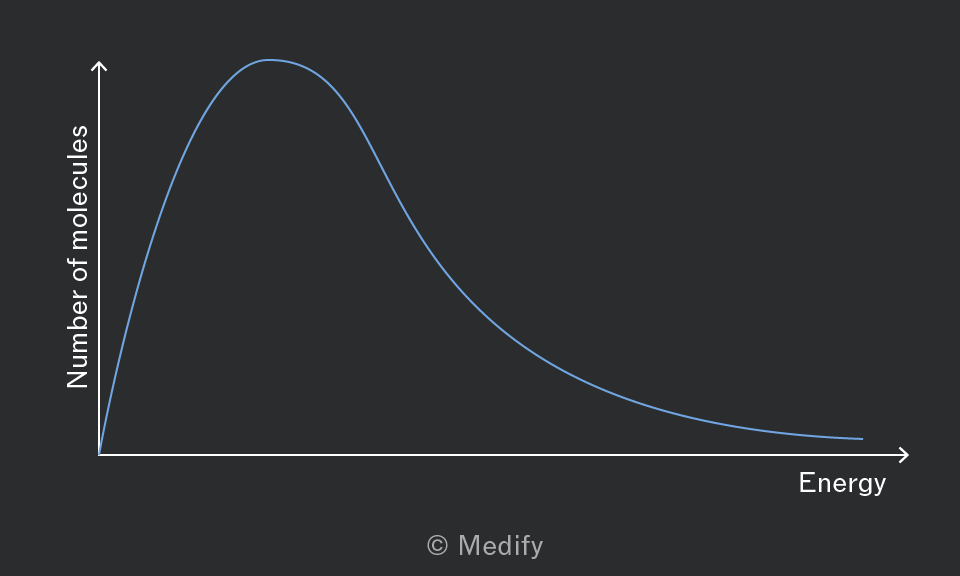
The area under the curve in the Boltzmann distribution is equal to the number of molecules in the substance.
Upon changing conditions, the total area under the curve does not change.
The peak of the curve represents the most probable energy, ; the mode.
The curve is asymptotic (does not reach the axis), as molecules have no maximum kinetic energy, and starts at the origin , as molecules must have a non-zero energy.
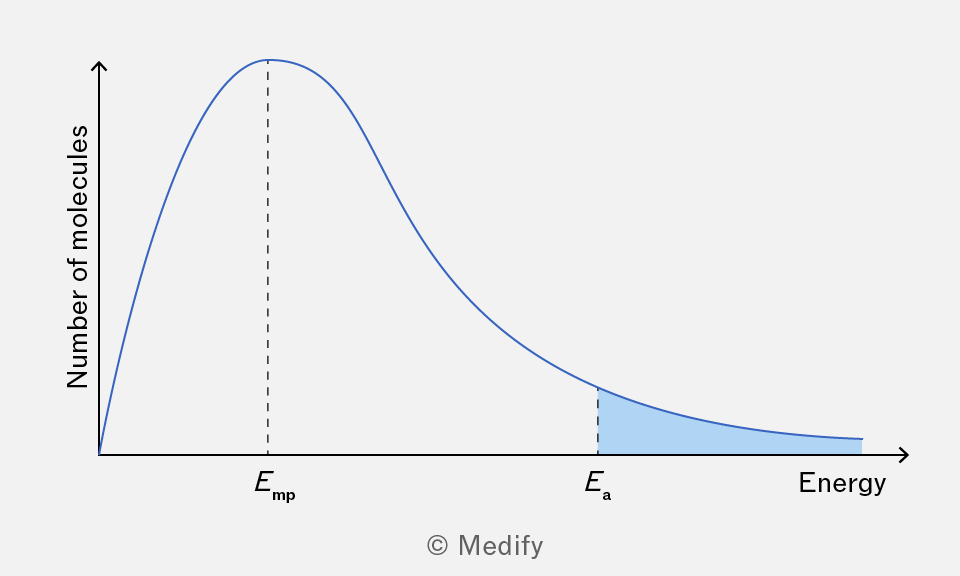
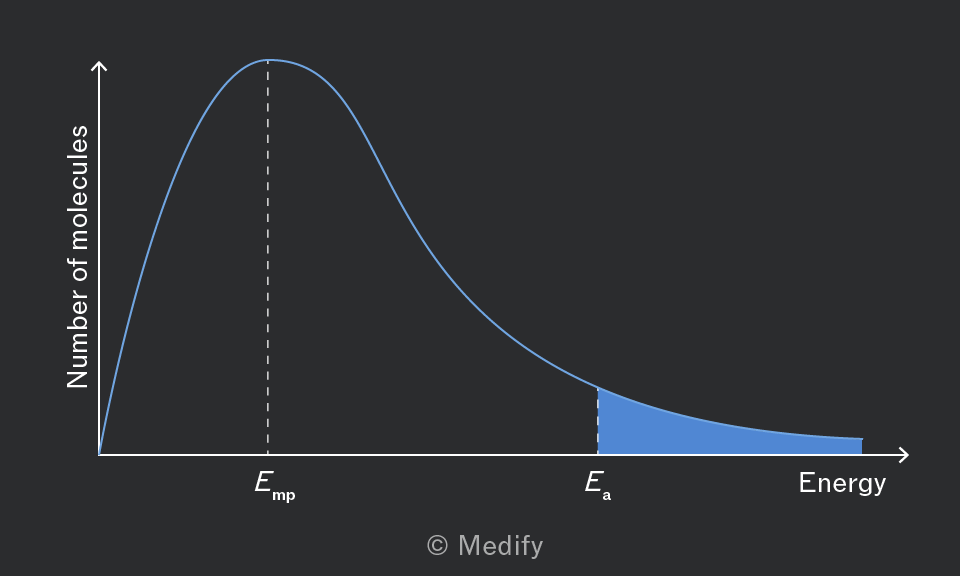
The curve becomes useful in explaining reaction kinetics, as only molecules with energy equal to or greater than the activation energy will result in effective collisions. This is the area under the curve to the right of the line.
Increasing the temperature shifts the Maxwell-Boltzmann distribution curve to the right and down.
The total area under the curve remains unchanged, meaning a shift to the right must be accompanied by a lower peak height.
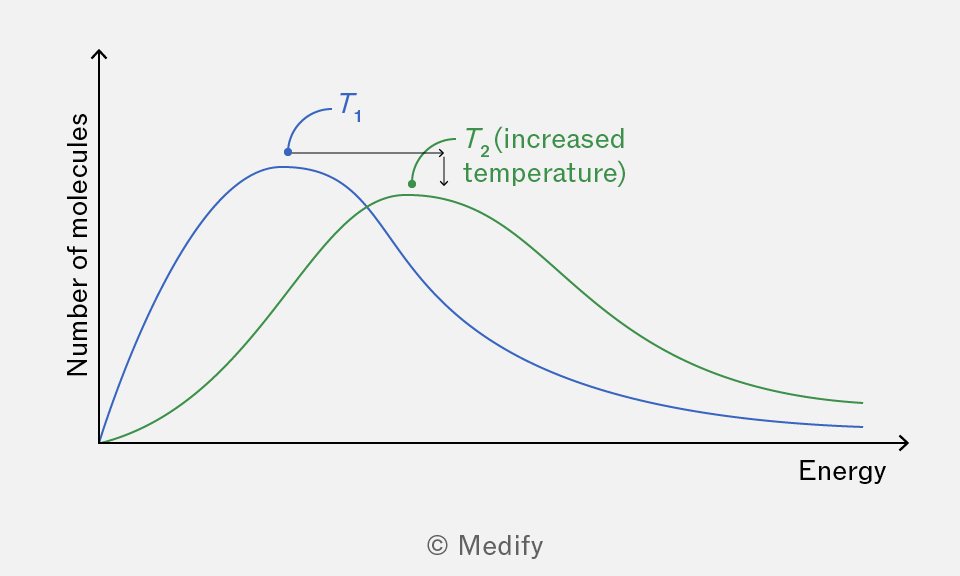
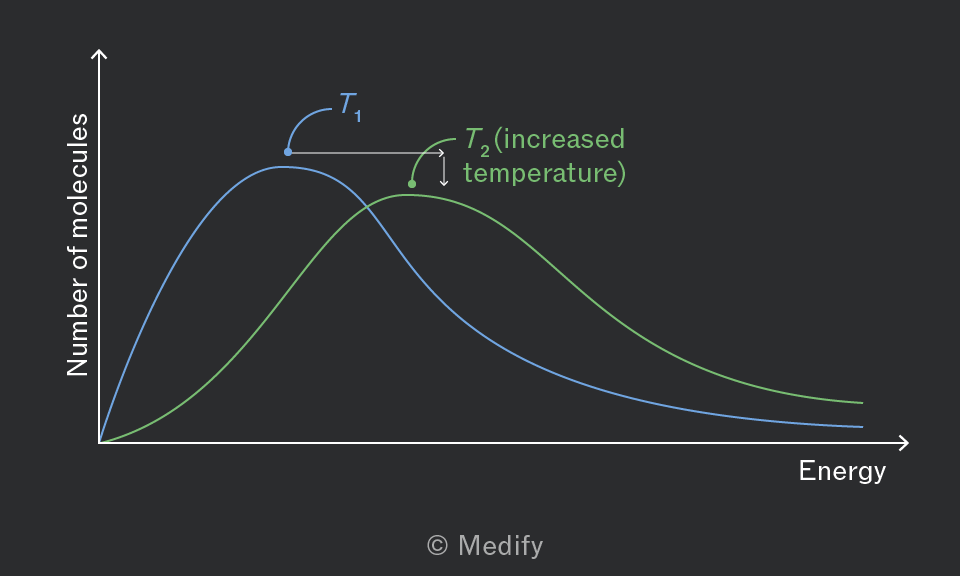
For decreasing temperature, the curve shifts to the left and the peak height increases.
The Maxwell-Boltzmann distribution shows how a small increase in temperature, from to , results in a larger proportion of molecules having sufficient energy to overcome the activation energy barrier and react.
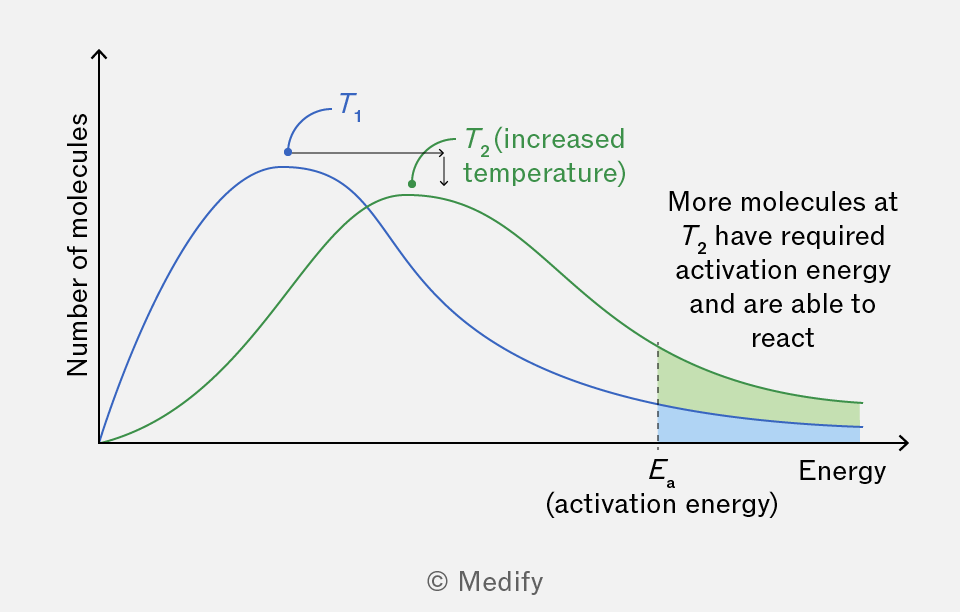
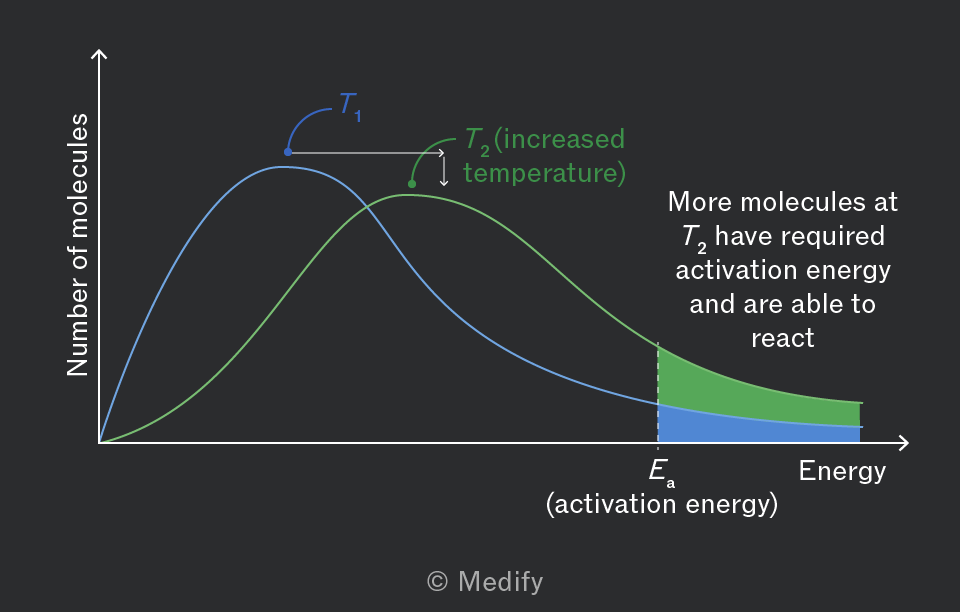
Since more molecules are able to collide with sufficient energy to, the frequency of successful collisions increases, leading to a faster reaction rate at higher temperatures.
The use of a catalyst has no effect on the energy distribution or the shape of the Maxwell-Boltzmann distribution curve.
Catalysts lower activation energy so the position of the activation energy is shifted to the left.
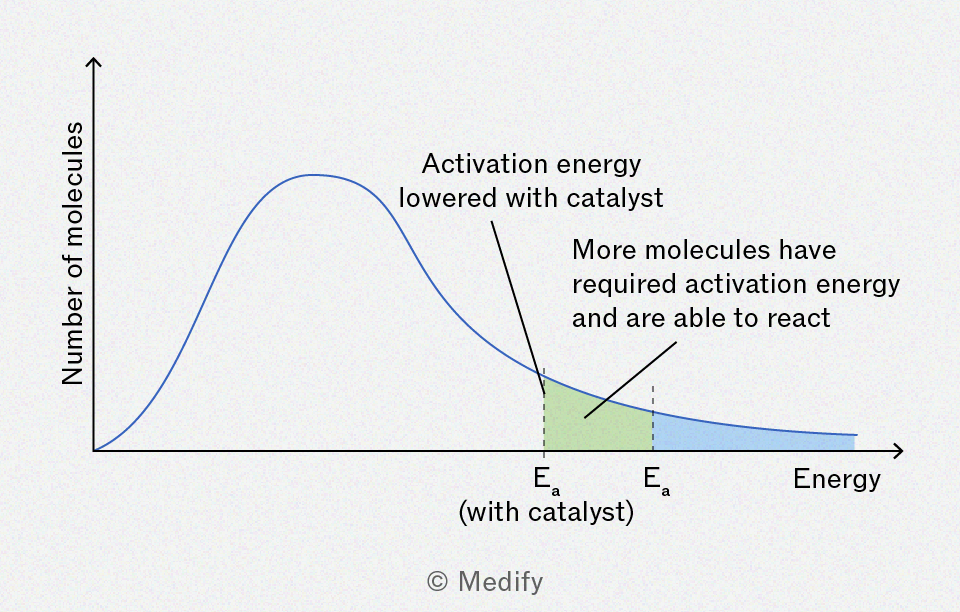
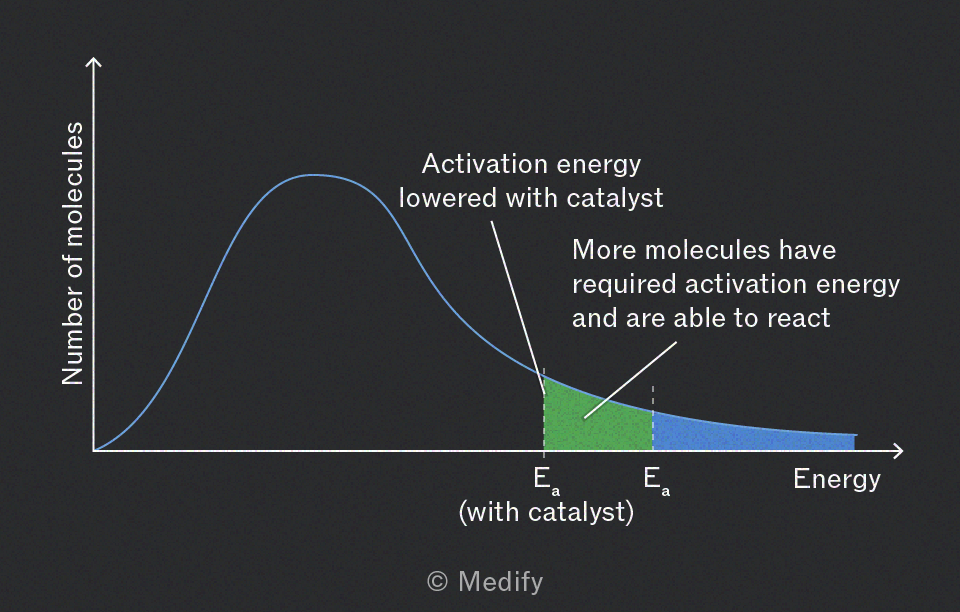
This means that a greater proportion of molecules have an energy exceeding the activation energy and are able to react; a greater number of collisions per unit time are effective, and there is a faster rate of reaction.
The rate of a chemical reaction measures the change in concentration in reactants or products over time.
This is expressed as:
where:
- concentration has units of
- time has units of
- rate has units of .
The order of reactant refers to the exponent to which the concentration of a reactant is raised in the rate equation.
It represents how the rate of reaction is proportional to the concentration of that particular reactant.
where:
- = the concentration of reactant in
- = the order of the reactant
- = ‘is proportional to’.
When the concentration of a reactant has no impact on the rate of the reaction it is called zero order.
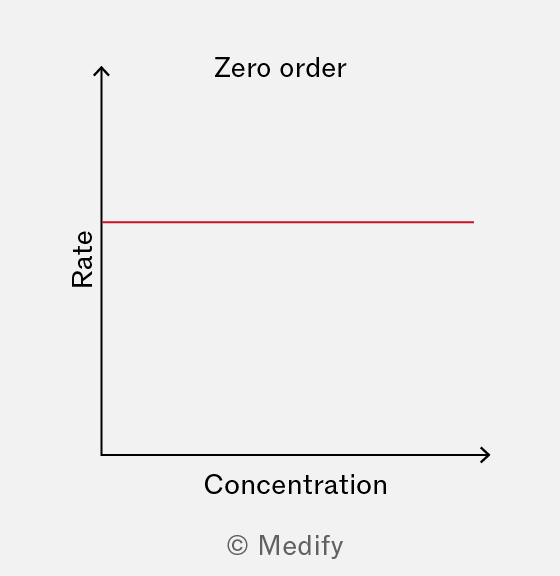
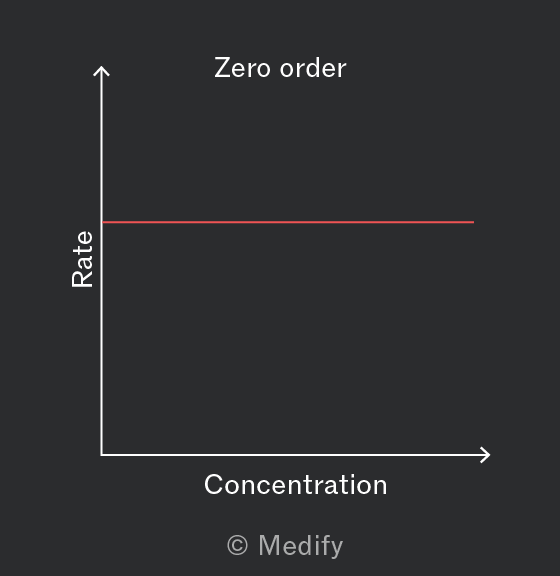
regardless of the concentration of . There is a zero gradient.
This can be seen on a rate–concentration graph as a horizontal line.
When the rate of reaction depends on the concentration raised to the power of one it is called first order.
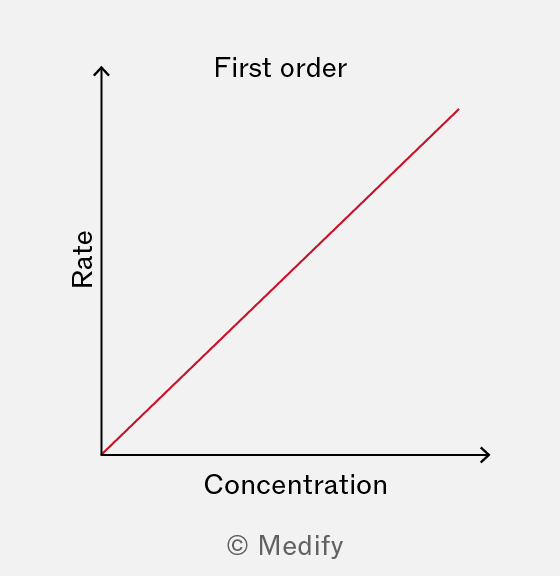
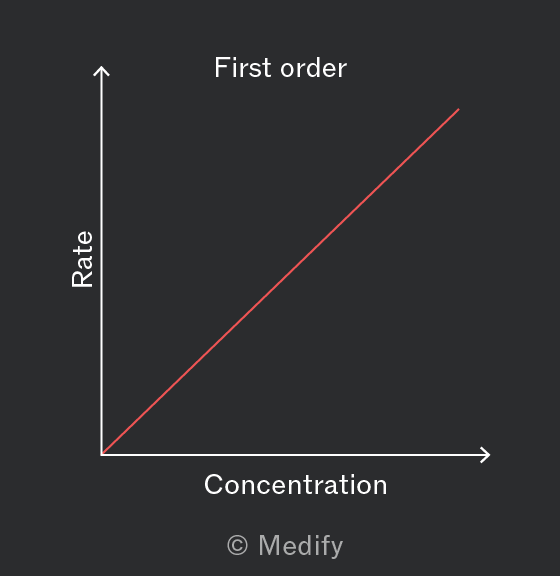
This can be seen on a rate–concentration graph as a directly proportional relationship; when the concentration of is doubled the rate will also double.
When the rate of reaction depends on the concentration of a reactant raised to the power of two it is called second order.
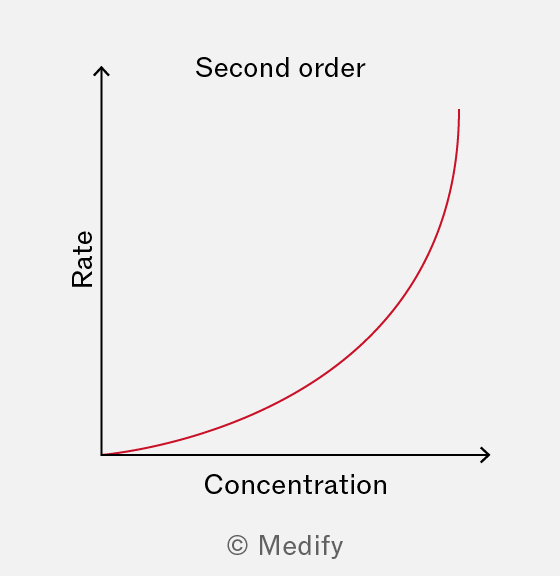
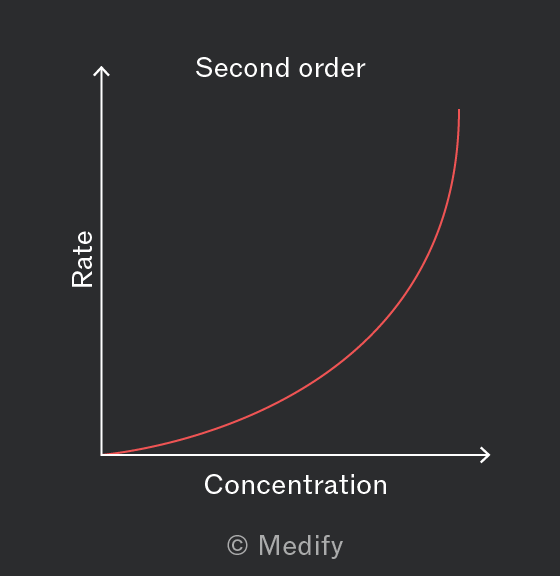
This can be seen on a rate–concentration graph as an increasing gradient; when the concentration of is doubled the rate will quadruple.
The rate equation shows the mathematical relationship between the rate of reaction, the reactant concentrations and the rate constant.
where:
- = rate constant
- = concentration of
- = order of reactant
- = concentration of
- = order of reactant .
The rate constant, , represents the proportionality constant in the rate equation. It relates the rate of a chemical reaction to the concentrations of reactants.
Rate constants are temperature specific; changing the temperature will change the rate constant.
The overall order of a reaction is the sum of the orders of the reactants in the chemical reaction.
The stages in a multi-step chemical reaction do not occur at the same rate. The rate equation is determined by all the steps up to and including the slowest step, known as the rate-determining step.
For example in the two-step reaction of carbon monoxide, , with nitrogen dioxide, :
First step:
Second step:
The first step is slow and is therefore the rate determining step. Only will feature in the rate equation.
To calculate the units of the rate constant, , input the units for rate and concentration into the rate equation:
where:
- rate has the units of
- and have the units of
- and are the reaction orders with respect to and .
Rearrange the rate equation to make the subject, substitute in the units, then simplify.
For a second order reaction so:
Zero order concentration–time graphs, obtained through continuous monitoring, are linear with a constant negative slope.
![A zero order concentration-time graph showing a linear decrease in concentration of a substance [A] over time. The y-axis represents concentration in mol dm⁻³, ranging from 0 to 2, while the x-axis represents time in seconds, ranging from 0 to 200. A rate calculation is included, indicating a rate of 0.01 mol dm⁻³ s⁻¹.](https://d3nzlfkeryzt6j.cloudfront.net/bldqas98kprwnr4pdhl7hzgpdbmj)
![A zero order concentration-time graph showing a linear decrease in concentration of a substance [A] over time. The y-axis represents concentration in mol dm⁻³, ranging from 0 to 2, while the x-axis represents time in seconds, ranging from 0 to 200. A rate calculation is included, indicating a rate of 0.01 mol dm⁻³ s⁻¹.](https://d3nzlfkeryzt6j.cloudfront.net/vdkmvg07toa4pcypk0ahn3zyay30)
For a zero-order reaction, the gradient of the concentration–time graph is constant and gives the rate constant, .
The unit for in a zero order reaction is .
First order concentration–time graphs are curved and initially show a rapid decrease in concentration, which slows down over time.
![Graph showing the concentration of substance [A] in mol dm⁻³ over time in seconds. The blue curve represents a decreasing exponential trend, while the red line indicates a linear decrease, both starting from a concentration of 6 mol dm⁻³ at time zero.](https://d3nzlfkeryzt6j.cloudfront.net/gfbjhda3zuxtzw1or5od87195whl)
![Graph showing the concentration of substance [A] in mol dm⁻³ over time in seconds. The blue curve represents a decreasing exponential trend, while the red line indicates a linear decrease, both starting from a concentration of 6 mol dm⁻³ at time zero.](https://d3nzlfkeryzt6j.cloudfront.net/44a5701e6ezkpnje3duowvtfzbr7)
For a first-order reaction, the gradient of the concentration–time graph changes over time.
The rate at a particular time, , is given by the slope of the tangent to the curve at that point.
- Draw a tangent to the curve at the specific time, .
- Determine the slope of this tangent using:
First order reactants have a constant half-life.
The half-life, , refers to the time it takes for the concentration of a reactant to reduce by half during a reaction.
In the example below the concentration of bromine halves every .
It takes for the concentration to change from to and a further for the concentration to change from to .
![A graph showing the concentration of bromide ions [Br-] in mol dm-3 plotted against time in seconds. The curve is decreasing, indicating a decline in concentration over time, with specific points marked at approximately 100 seconds and corresponding concentration values.](https://d3nzlfkeryzt6j.cloudfront.net/d9oipw2dcyjwoonci9ykfjug804y)
![A graph showing the concentration of bromide ions [Br-] in mol dm-3 plotted against time in seconds. The curve is decreasing, indicating a decline in concentration over time, with specific points marked at approximately 100 seconds and corresponding concentration values.](https://d3nzlfkeryzt6j.cloudfront.net/pdq67nlh3390c2t76y1hlktxgnij)
Therefore, the half-life, , for the first order reactant, bromine, is .
The rate constant, , for a first order reaction can be determined from the half-life using the equation:
where:
- is the rate constant.
- is the half life of the reaction.
Using the half-life as :
The unit for rate constant using this relationship is always .
The equation is only relevant for first order reactions and the value of is specific to the reactant being studied.
Reactions can be monitored by measuring the mass change over time.
Procedure:
- Weigh the reaction vessel empty.
- Add the reactants and record the initial mass.
- At specific time intervals, reweigh and record changes.
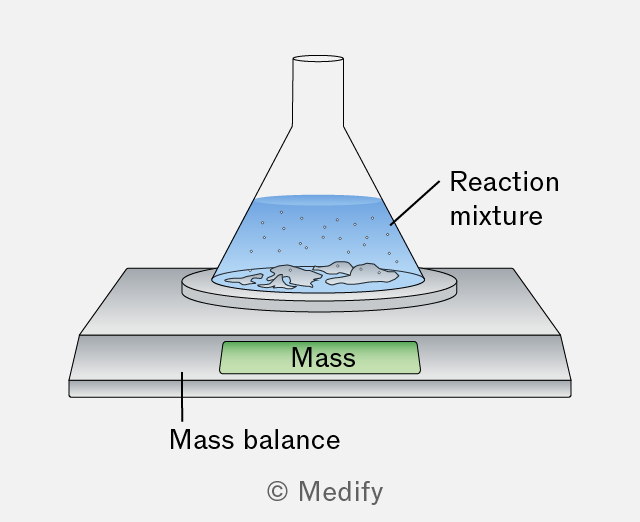
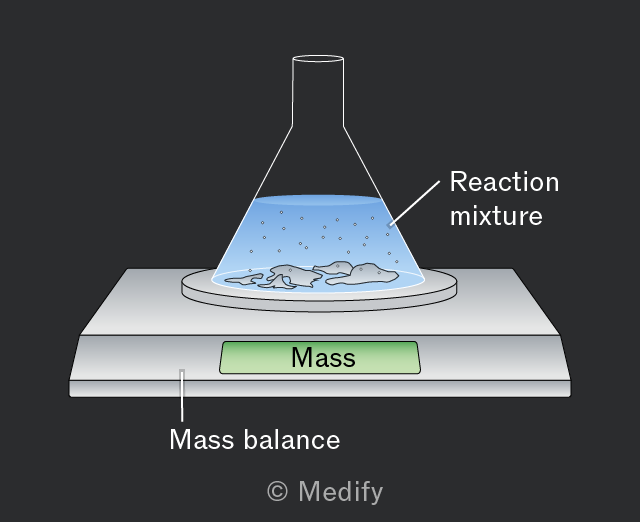
Mass loss indicates consumption of solid or liquid reactants and formation of a gaseous product.
Mass gain implies consumption of a gaseous reactant and incorporation in a solid or liquid product.
In the reaction of solid magnesium with aqueous hydrochloric acid, hydrogen gas is produced, leading to a decrease in the mass of the reaction vessel.
Changes of gas volume during a reaction reflect consumption of gaseous reactants, or formation of gaseous products.
Use a gas syringe or displacement method to measure gas volume changes.
Record initial volume and measure at specific time intervals.
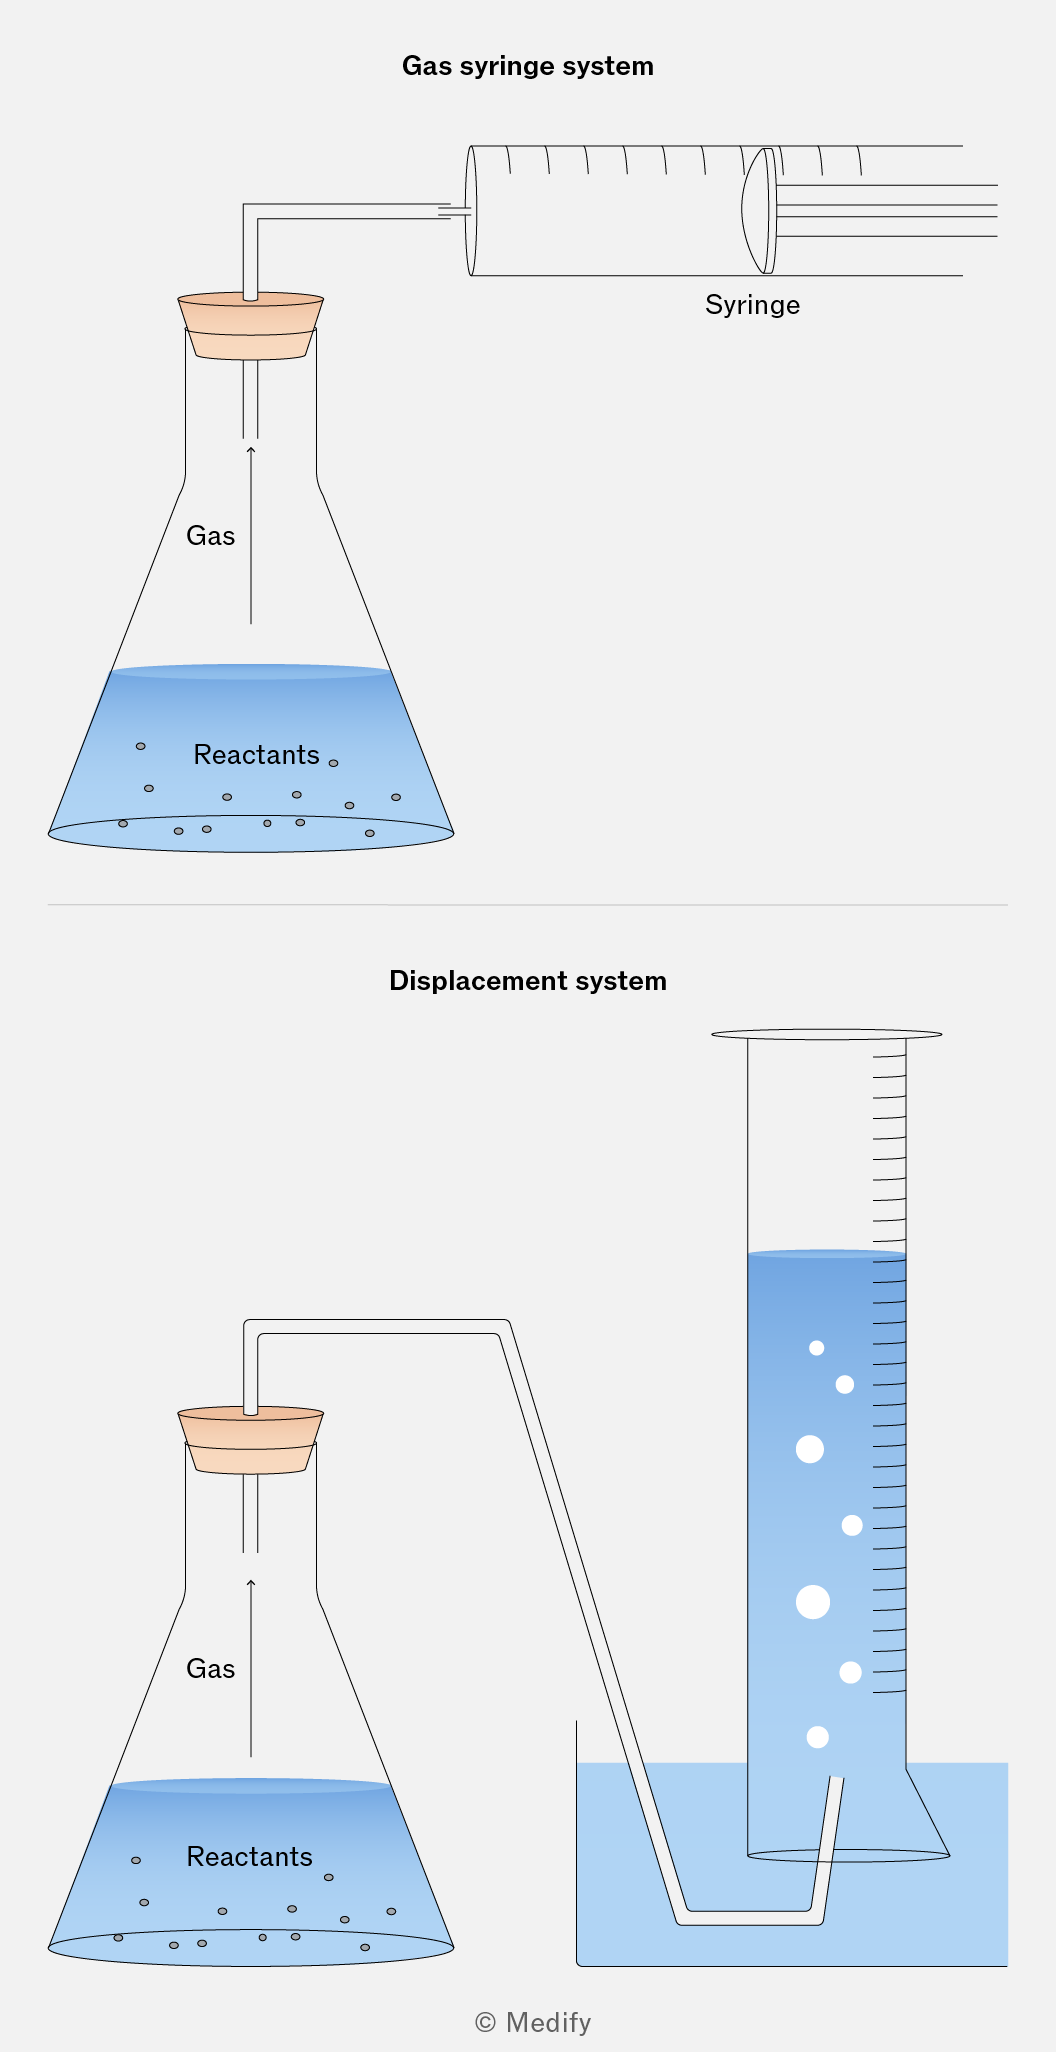
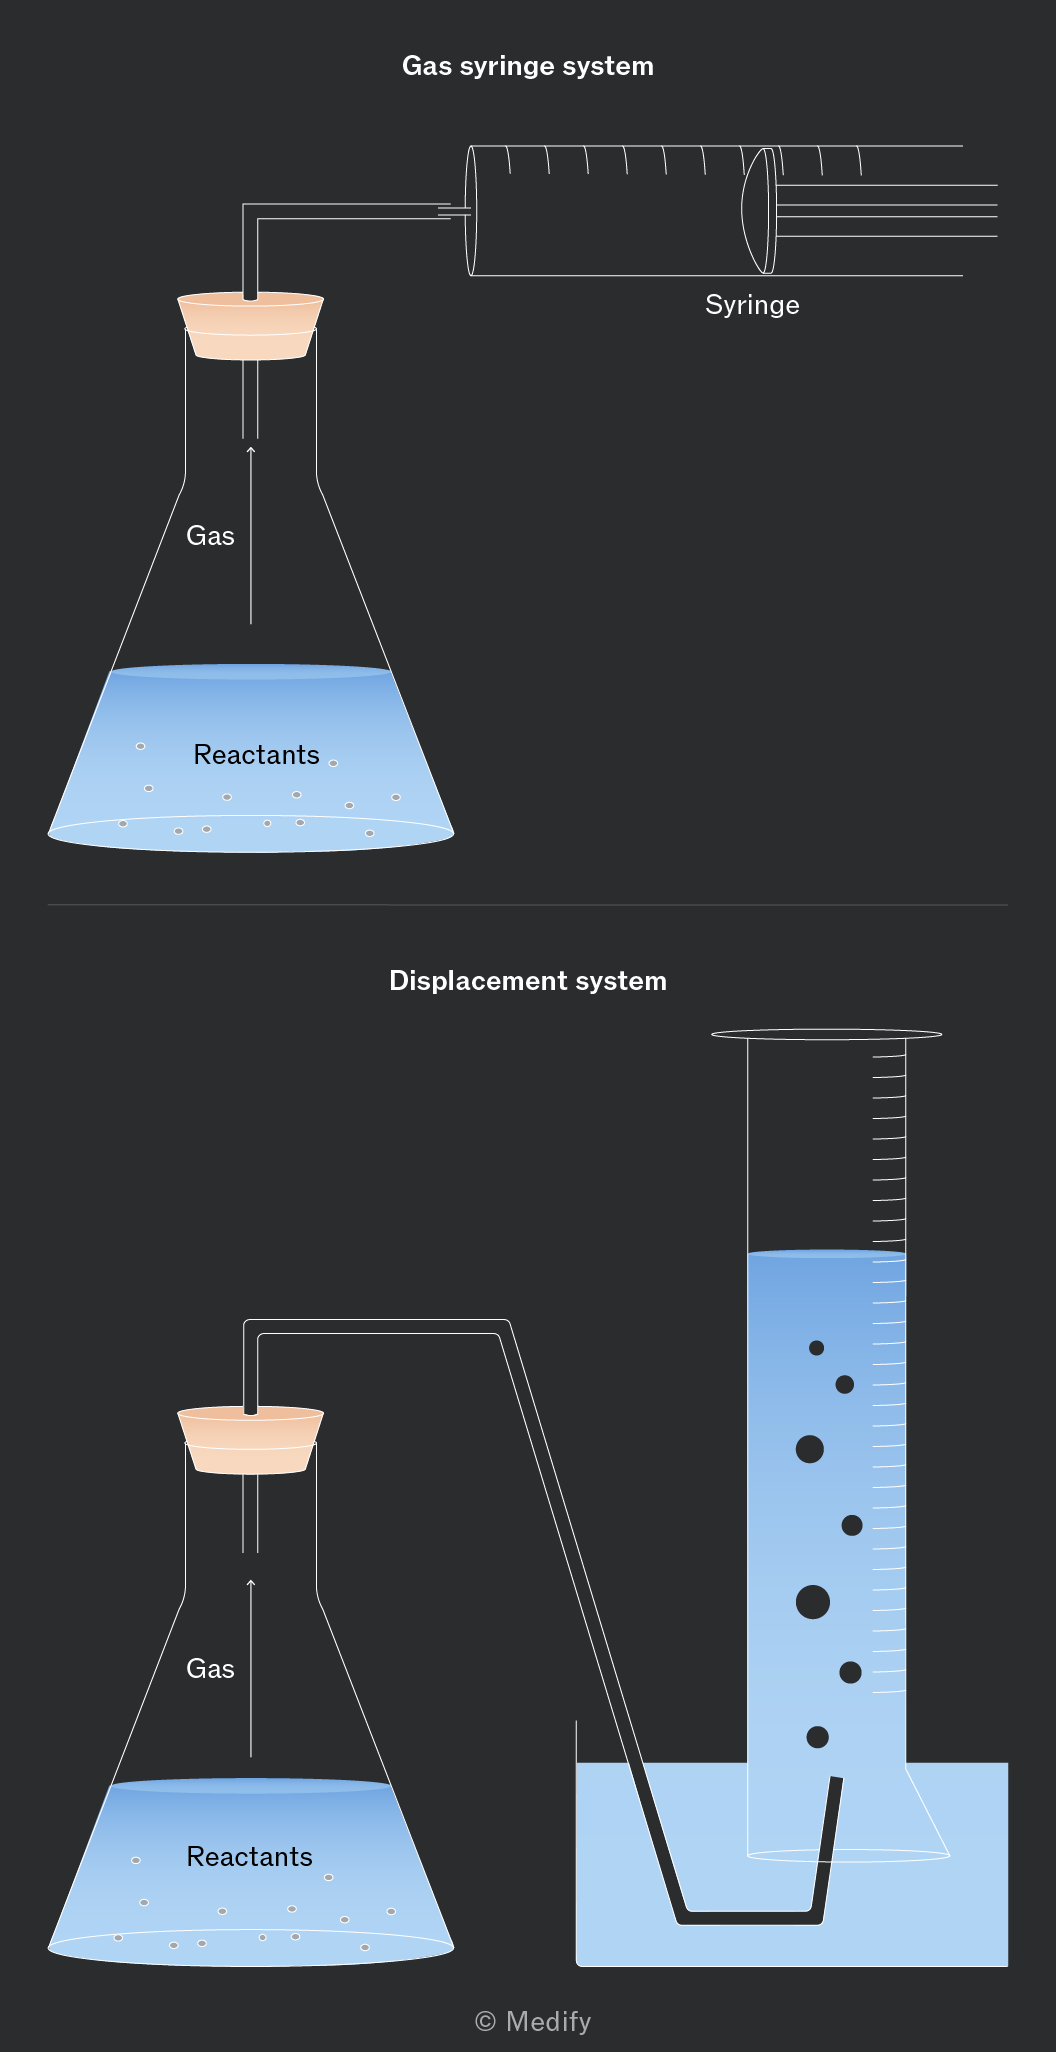
Hydrochloric acid reacts with magnesium to produce hydrogen gas, leading to an increase in gas volume as the reaction proceeds. Gas collection can be used to monitor the reaction rate.
Time is a crucial parameter for monitoring reaction rates.
Use a stopwatch or digital timer to record the time taken to reach specific reaction milestones. Accurate timing ensures precise determination of reaction rates.
The time taken for the milestone to be reached is inversely proportional to the reaction rate. This means that longer times indicate slower rates.
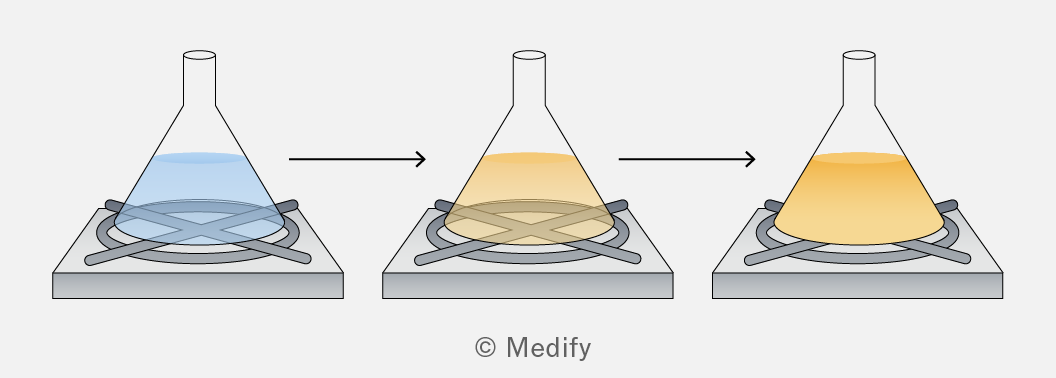
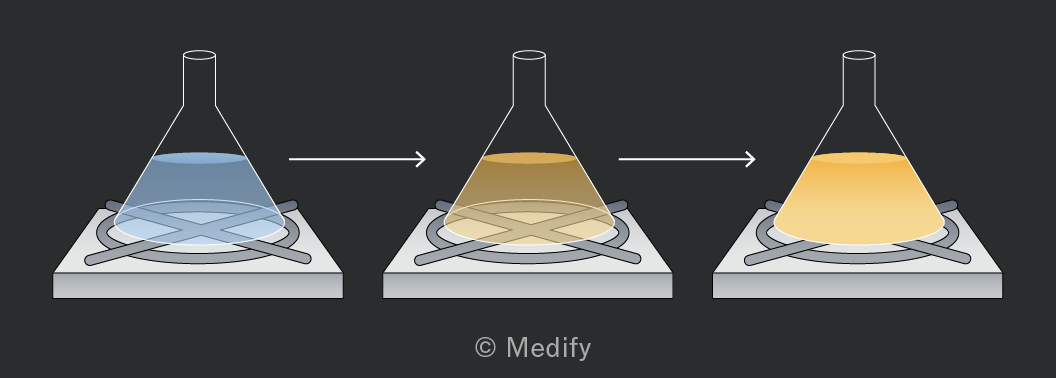
The milestone used will depend on the reaction but could include a colour change, onset of gas evolution, or a predefined temperature change.
In the reaction between sodium thiosulfate and hydrochloric acid, a precipitate of sulfur is formed, causing the solution to become cloudy. The reaction milestone is the point at which a covered cross is obscured.
The initial rates method determines the rate law and rate constant by measuring the reaction rate at the very start when reactant concentrations have changed minimally. Initial concentrations are used in calculations.
Initial rates data can be collected by assessing progress after a fixed short period of time, or by measuring the time required for the reaction to progress to a defined milestone.
The final output is generally a rate–concentration graph or a table.
The iodine clock reaction is an initial rates experiment that measures the time required for a set amount of iodine to form.
A specific amount of sodium thiosulfate is included in the reaction mixture and this reacts with the iodine as it is formed.
When enough iodine has been produced to consume the sodium thiosulfate the excess iodine reacts with starch in the reaction mixture a colour change to blue–black is observed.
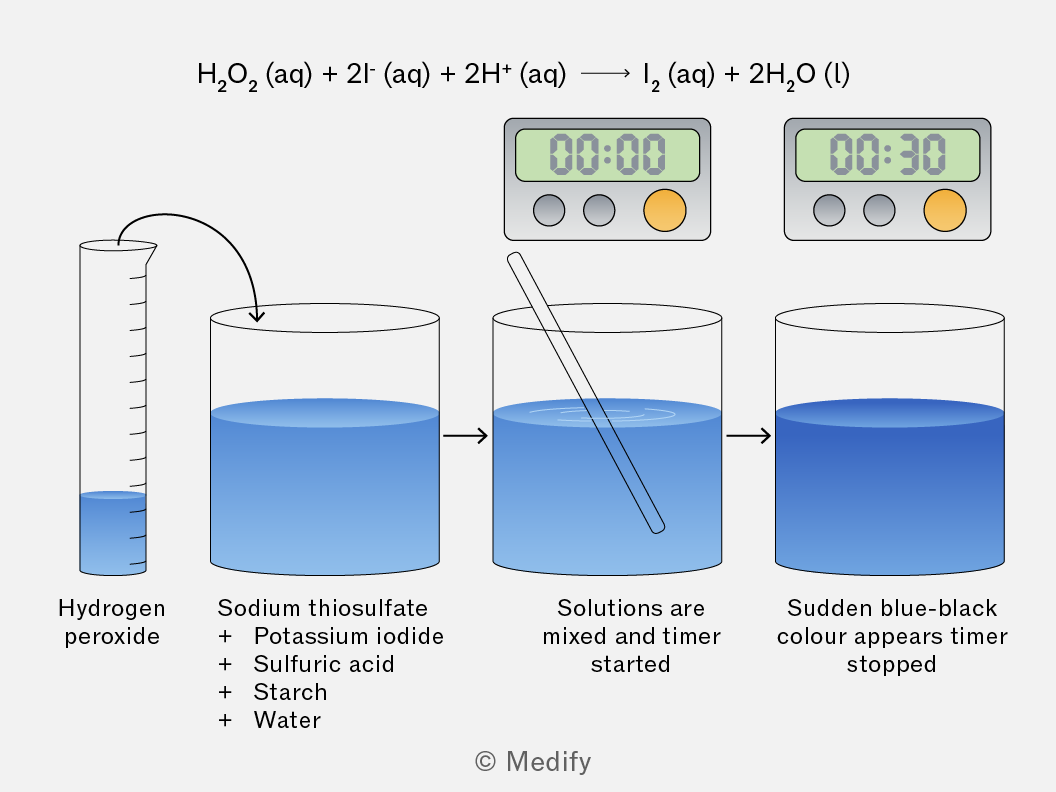
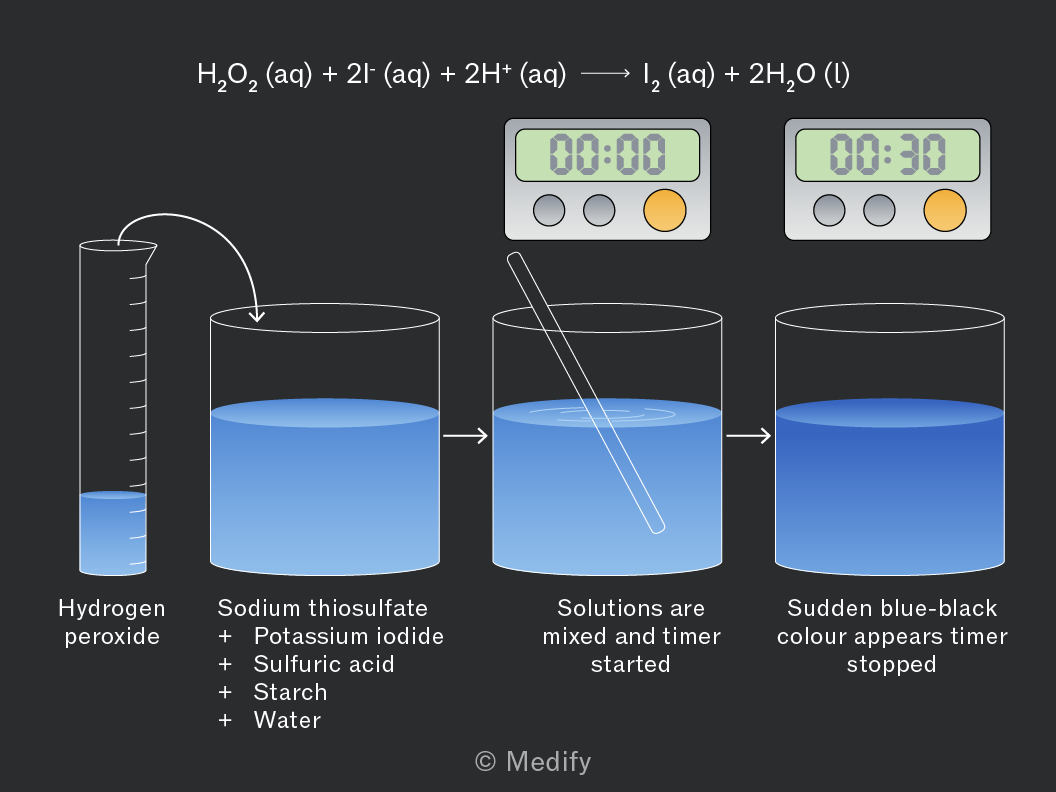
The rate in each instance is calculated by considering the concentration of iodine produced at the point of the colour change and dividing this by the time taken.
There is a ratio of . The concentration of iodine produced will be half the initial concentration of sodium thiosulfate in the reaction mixture.
Continuous monitoring involves measuring the concentration of reactants or products at regular intervals throughout the reaction. The output is generally a concentration–time graph.
Continuous monitoring data can be collect by:
- colorimetry: measures the absorbance of a specific wavelength of light by the reaction mixture, which is directly related to the concentration of a coloured species.
- gas collection: measures the volume of gas produced or consumed in the reaction over time.
- titration: samples are withdrawn from the reaction mixture at regular intervals and titrated to determine concentration.
- mass loss: measures the decrease in mass of the reaction mixture due to the evolution of gas.
Colorimetry can be used in continuous monitoring when a reactant or product has a distinct colour.
To monitor the rate of reaction using colorimetry a calibration curve is required.
Procedure to generate a calibration curve:
- Prepare standard solutions of known concentrations of the coloured species.
- Measure their absorbance using a colorimeter.
- Plot absorbance vs. concentration to create a calibration curve.
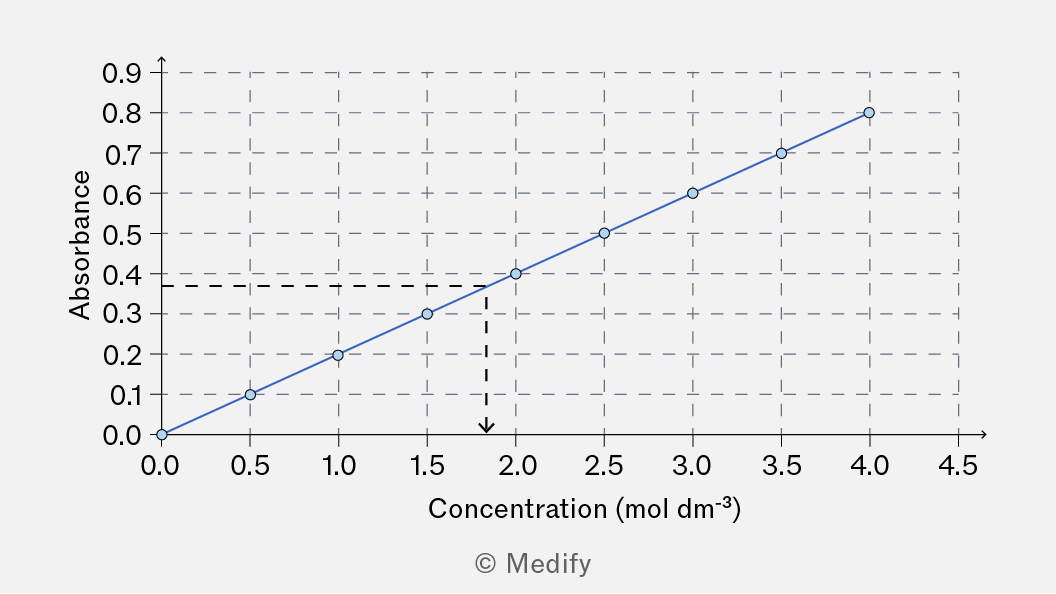
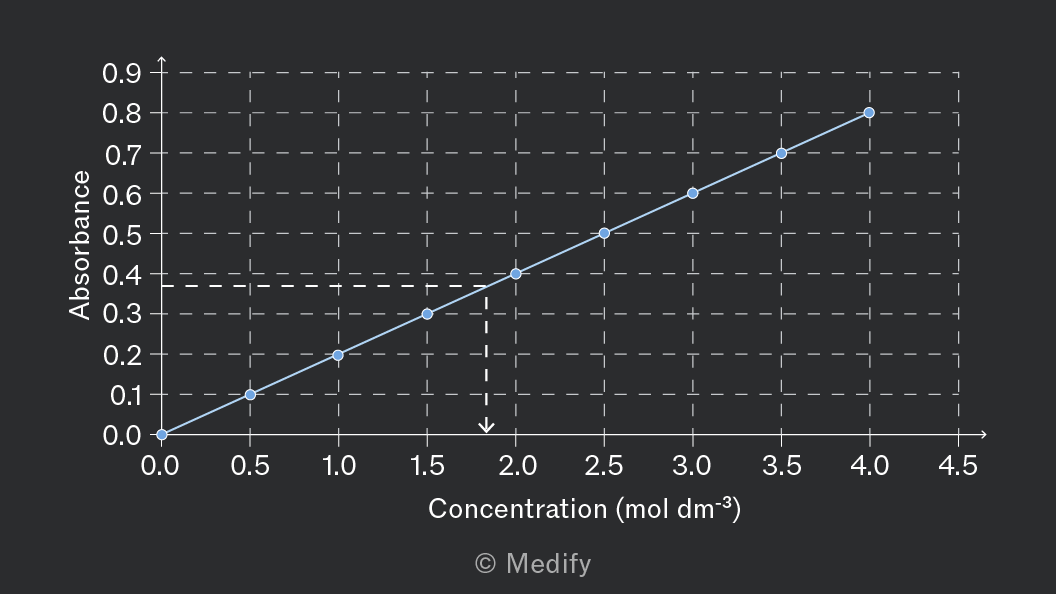
Use the calibration curve to convert absorbance readings from the reaction you are monitoring to concentrations.
Results can then be analysed using a concentration–time graph.
To calculate the rate of reaction at a specific point of the chemical reaction using a concentration–time graph.
- Draw a tangent to the line of best fit at the specified concentration or time. Make sure you draw the tangent as large as possible to increase accuracy.
- Use your tangent to construct a right-angled triangle.
- Determine the .
- Determine the .
- To calculate the gradient, which is equal to the rate of the chemical reaction use: .
If the initial rate of reaction is required, the tangent should originate at .
The graph below illustrates how to draw a tangent and extract the relevant data from a concentration–time graph in order to calculate reaction rate.
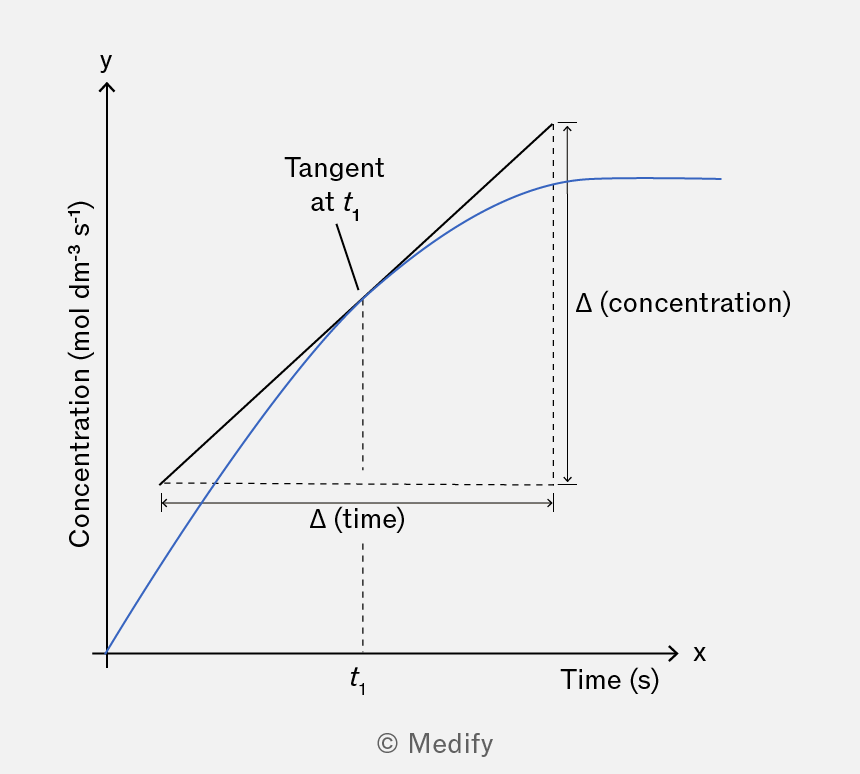
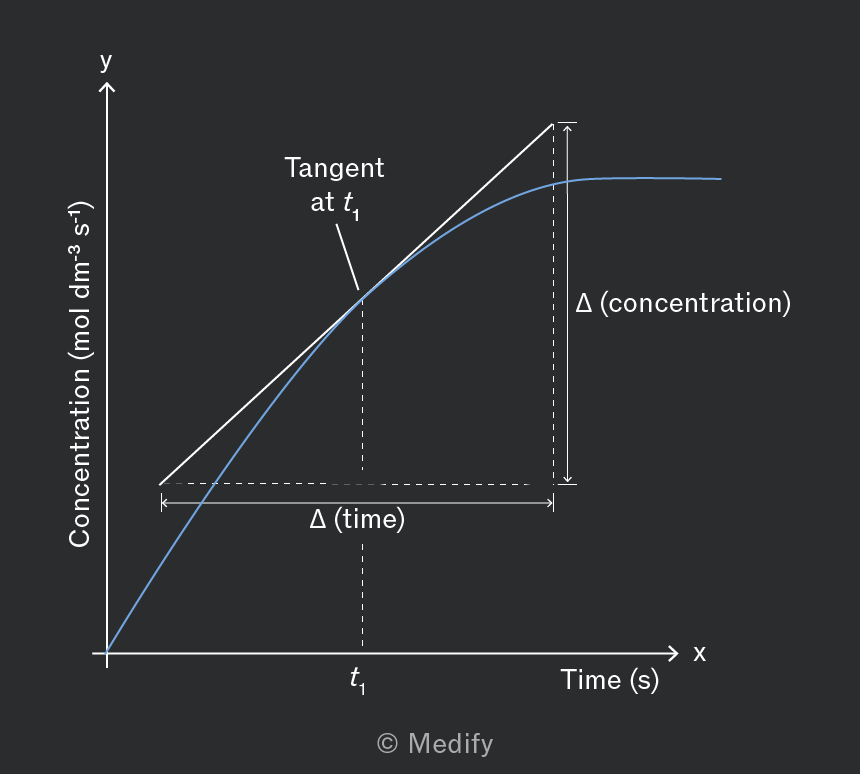
The x-axis for time is often in minutes. When calculating the it is important to convert the time to seconds.
The gradient will commonly have the units of .
This method can also be used if there is a change of mass, change in volume etc. If this is the case, the units for the gradient will be different.
The rate equation can be determined from experimental data using the initial rate method.
To analyse this data, find a pair of reactions where only one concentration changes to find the order with respect to that reagent.
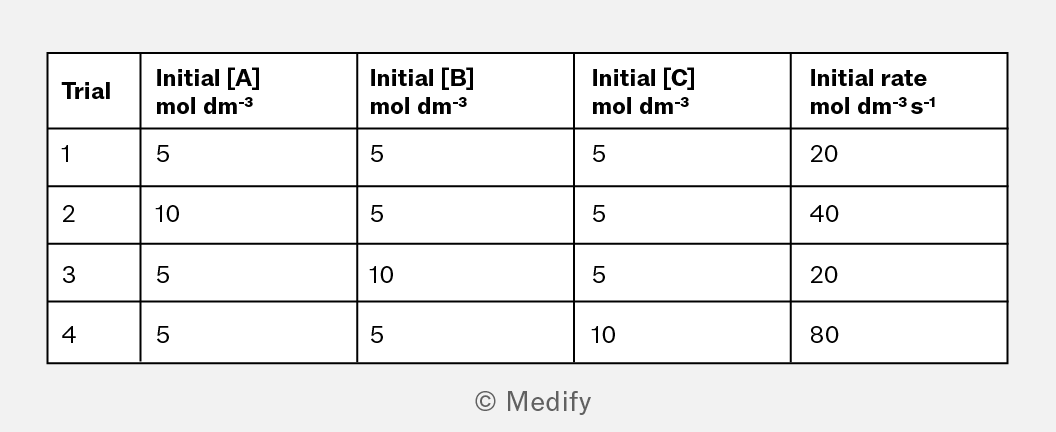
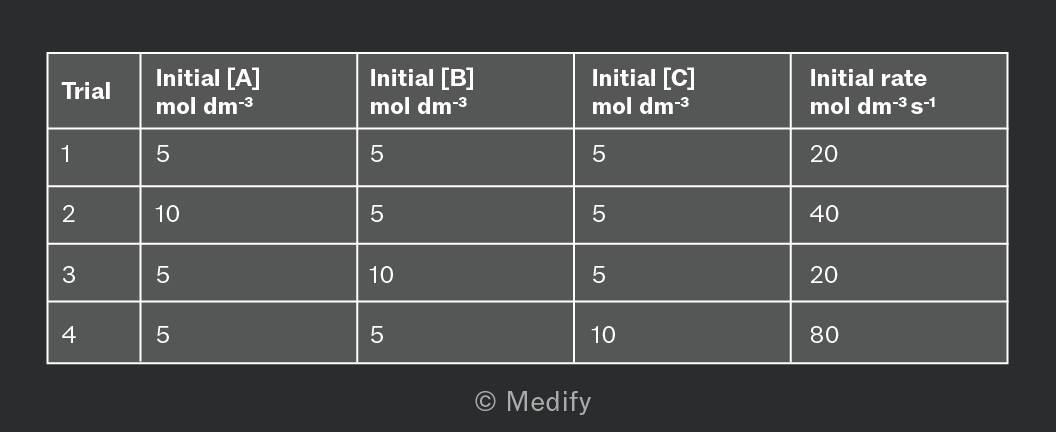
is a first order reactant: between trial 1 and 2, only changes. is doubled and the initial rate also doubles.
is a zero order reactant: between trial 1 and 3 only changes. is doubled and the initial rate remains constant.
is a second order reactant: between trial 1 and 4 only changes. is doubled and the initial rate quadruples (increases by a factor of
Therefore the rate equation for this reaction would be:
The stages in a multi-step chemical reaction do not occur at the same rate. The rate equation is determined by all the steps up to and including the slowest step, known as the rate-determining step.
For example in the two-step reaction of carbon monoxide, , with nitrogen dioxide, :
First step:
Second step:
The first step is slow and is therefore the rate determining step. Only will feature in the rate equation.
When provided with a chemical equation, the rate equation, and the steps in a multi-step mechanism, the rate-determining step can be deduced.
Given this chemical equation:
the rate equation is:
and the two-step mechanism is:
The rate equation tells us that only is involved in the rate-determining step. The concentration of the nucleophile will not influence the reaction rate.
This means the slowest step must be step 1.
Reaction mechanisms can be proposed using a balanced chemical equation and the rate equation.
Given the chemical equation:
and the rate equation:
The reaction is first order overall. This tells us that only one molecule of is involved in the rate determining step; this must be the first step. The second molecule will feature in a subsequent step.
A feasible two-step mechanism for this reaction is:
- (rate determining step)
The rate constant, , is only valid for a given temperature. The value of increases exponentially with increasing temperature.
Higher temperatures increase the kinetic energy of particles and shift the Maxwell-Boltzmann distribution to the right. The proportion of particles with kinetic energy activation energy is increased.
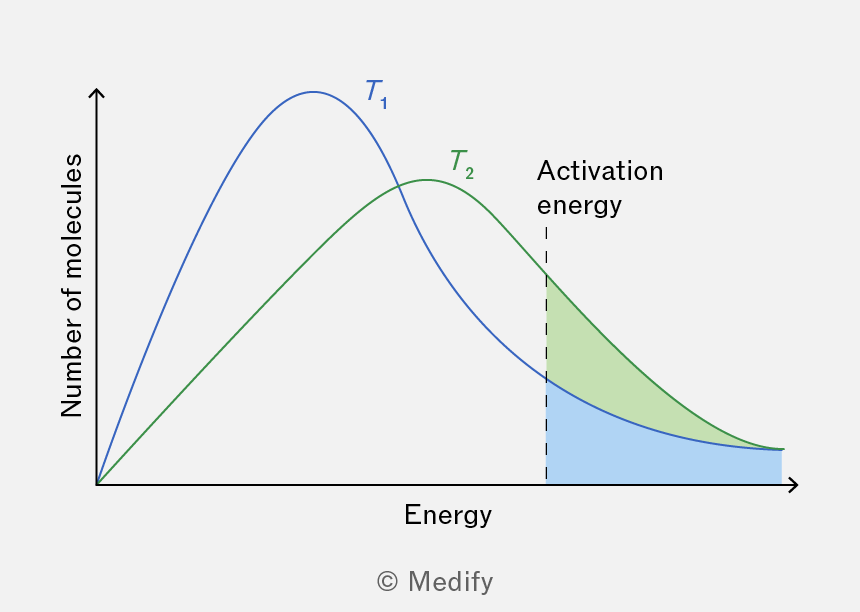
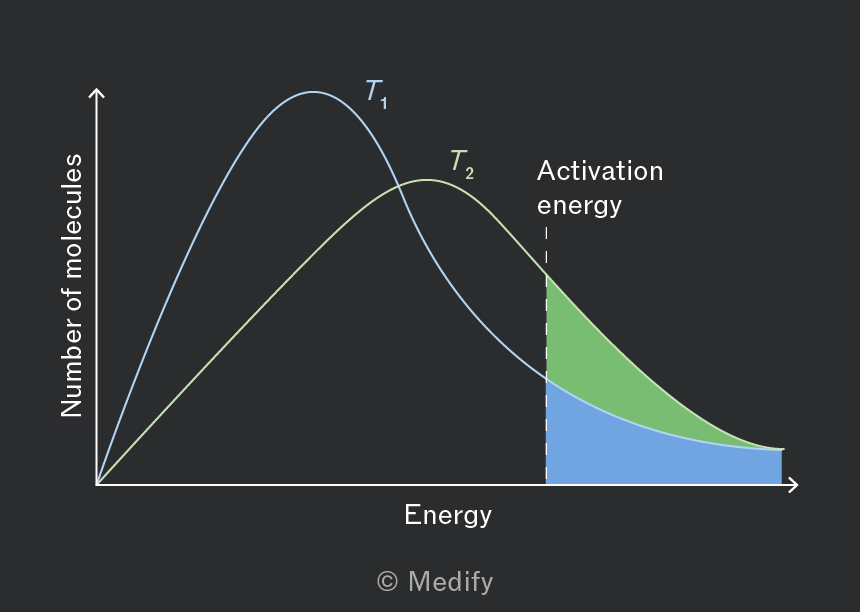
At higher temperatures there is increasing frequency of successful collisions; more collisions overcome the activation energy within a set time. This represents a higher rate of reaction.
If the rate of reaction increases, whilst the concentration of reactants remains constant, the value to must increase.
The Arrhenius equation describes the relationship between the rate constant, of a chemical reaction and temperature, It provides insight into how temperature influences the rate of a reaction.
The Arrhenius equation is represented as follows:
where:
- is the rate constant
- is the pre-exponential factor
- is the activation energy in
- is the gas constant
- is the temperature in kelvin.
To calculate the rate constant, , you can substitute the known values directly into the Arrhenius equation:
The gas constant, has a value of which will be privided.
The pre-exponential factor, , is sometimes called the frequency factor. It reflects the proportion of collisions with the correct orientation. It is constant for a given reaction under specific conditions and, unlike the rate constant, , the pre-exponential factor does not change with temperature.
The units for the pre-exponential factor, , match those of for a given reaction.
Ensure units are correct. Temperatures must be converted to kelvin, K, and activation energy, , to .
Where no graph is available, can be calculated algebraically using the linear form of the Arrhenius equation.
Note that you would be given the derived equation in an exam and do not need to be able to construct it.
Given you have rate constants, and , at two temperatures, and you can form a pair of simultaneous equations.
This derivation can then be used to calculate .
The Arrhenius equation can be manipulated to form a linear equation by taking the natural logarithm of both sides:
This can be plotted on a graph.
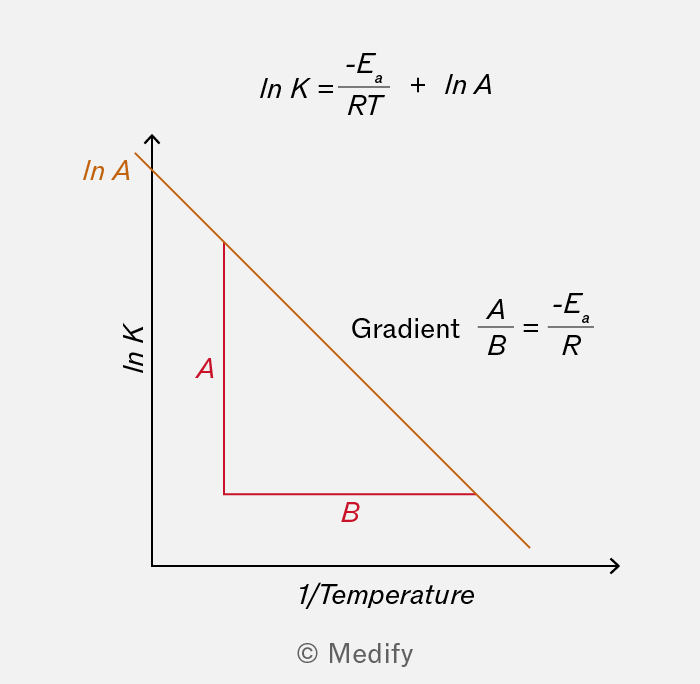
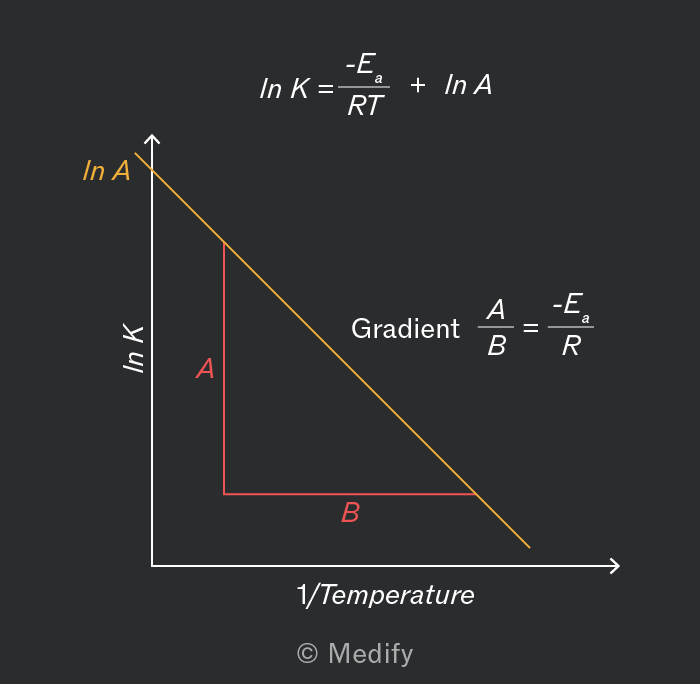
When is plotted against and , the gradient is and the y-intercept is .
These values can be extracted from the graph.