Methods of analysis and detection
On this page
Some nuclei possess a net non-zero magnetic moment, which means they exhibit a net magnetic force. and are key examples of nuclei with net non-zero magnetic moments.
When placed in an external magnetic field, as in a nuclear magnetic resonance (NMR) spectrometer, the nuclei’s magnetic moment can align with or against the direction of the external magnetic field. The energy gap between these alignments is detectable in NMR spectroscopy. It is the resonant frequency of the nucleus.
The surrounding nuclei in a molecule, the molecular environment, influences the size of the resonant frequency observed. This results in a separate signal being observed by all non-identical nuclei within a molecule.
Chemical shift, denoted by , is the difference between the resonant frequency of the observed nucleus and that of a reference compound, which is assigned an arbitrary value of zero on the NMR spectrum.
The zero value of the reference peak is found on the right hand side of an NMR spectrum.
Tetramethylsilane (TMS) is used as the standard reference for chemical shift measurements in NMR spectroscopy.
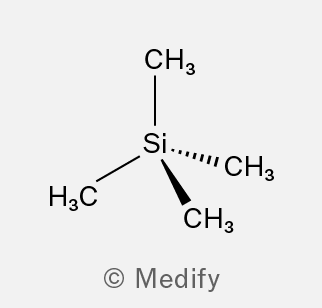
TMS is ideal as a standard reference because it has four equivalent carbon and proton environments, which is why it gives a single, sharp absorption peak on the NMR spectrum.
The sample is mixed with a drop of TMS. The TMS peak is assigned an arbitrary value of 0 at the far right of the spectrum. The chemical shifts of all other peaks are recorded relative to the TMS peak, the shift increases in value going left.
Silicon has a low electronegativity compared to carbon, hydrogen, oxygen, and nitrogen and so allows more nuclear shielding in TMS than in most test samples. Most other groups therefore absorb at a frequency higher than TMS and appear to its left on the spectrum.
Deuterium is an isotope of hydrogen with a neutron in its nucleus. It has the relative isotopic mass of 2 and is written as or .
The nucleus of deuterium is not active in NMR spectroscopy; it does not possess a net non-zero magnetic moment.
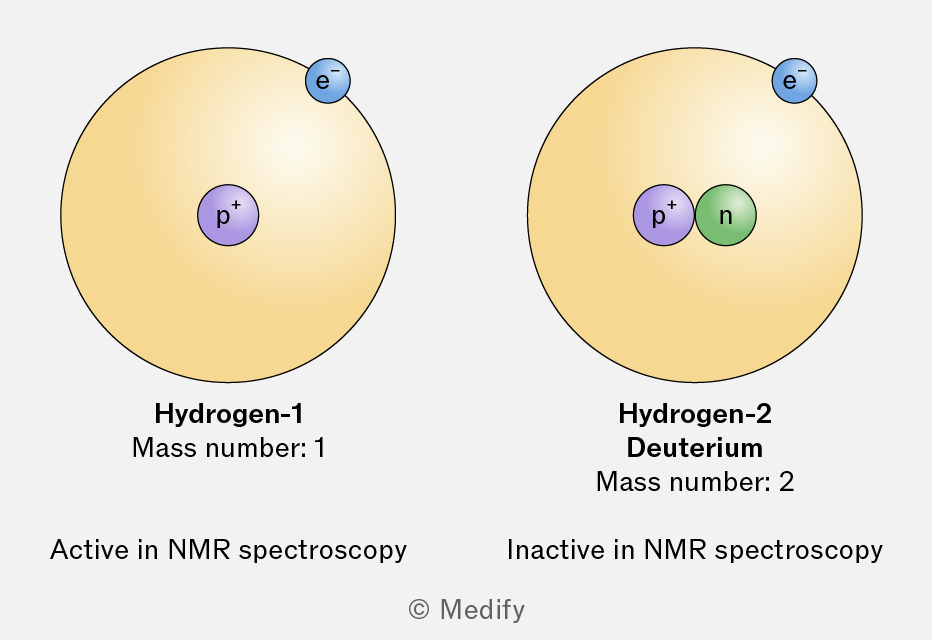
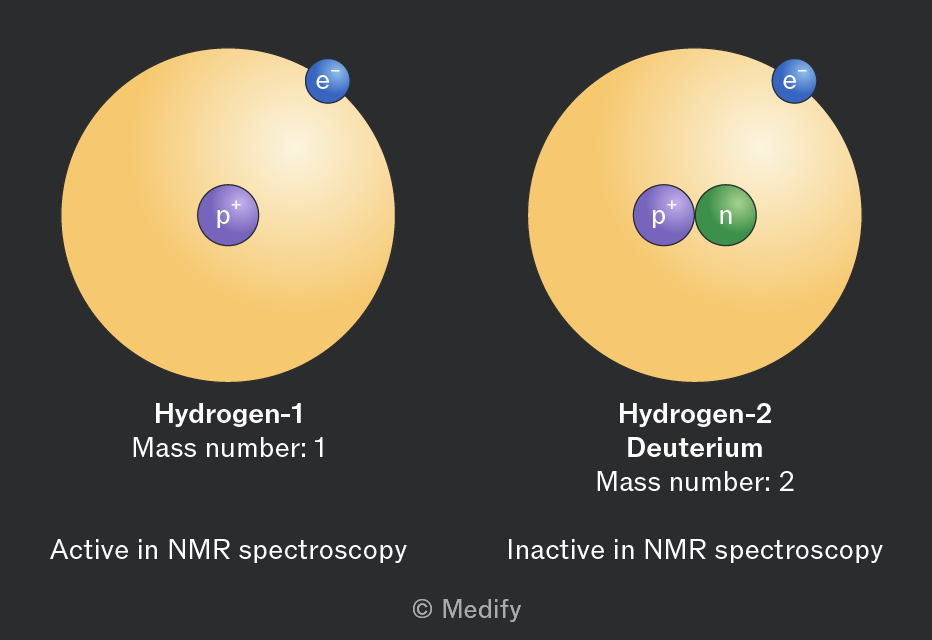
In NMR spectroscopy, the solvent used for dissolving the sample must not contain any spin active nuclei as these would produce signals obscuring those of the test sample.
Deuterated solvents are used. Deuterated means all the atoms have been replaced with NMR inactive atoms.
Commonly used solvents for NMR are deuterated trichloromethane , deuterated dimethylsulfoxide and deuterated water .
NMR active atoms, bonded to different atoms or chemical groups, have different exposure to the external magnetic field. This is commonly referred to as a different environment.
Nuclei in a different chemical environment display resonance at different chemical shifts. This results in distinct peaks being produced on the carbon-13 NMR spectrum.
When analysing molecules, it is important to consider symmetry. If two carbon atoms are positioned symmetrically within an organic molecule, they are called equivalent carbons as they are equally shielded from the external magnetic field and therefore display the same chemical shift.
The NMR spectrum is a plot of energy absorption against chemical shift () measured in parts per million (ppm).
A carbon-13 NMR spectrum helps study the structure of organic molecules by revealing information about:
- the number of different carbon environments present – from the number of peaks.
- the type of environment each carbon is in – from the chemical shift ().
Carbon-13 NMR gives a simpler spectra than proton NMR spectroscopy due to the lack of nuclear coupling.
The relative abundance of carbon-13 is only 1% meaning that the incidences of coupling between NMR active nuclei are infrequent and not visible on the spectrum.
Interactions between and are removed from the spectrum carbon-13 NMR spectroscopy: the spectrum are proton decoupled.
More structural information can be obtained from a proton NMR spectrum than a carbon-13 NMR spectrum.
The high-resolution proton NMR spectrum provides information about:
- The number of different proton environments – from the number of peaks.
- The type of environment each proton is in – from the chemical shift () values.
- The relative numbers of protons in each environment – from the area under the peaks.
- The number of non-equivalent protons adjacent to the proton being observed – from the splitting pattern.
A proton NMR peak is split into sub-peaks due to interaction with the spin states of nearby protons, belonging to different chemical environments.
This splitting of the main peak into sub-peaks is called spin-spin splitting or spin-spin coupling.
Spin-spin splitting does not occur when the adjacent protons are in an equivalent chemical environment.
The ‘ rule’ gives the number of sub-peaks expected from a single proton environment. This is one greater than the number of nonequivalent protons on the adjacent atoms.
The table below shows the common spin-spin splitting patterns in organic molecules.
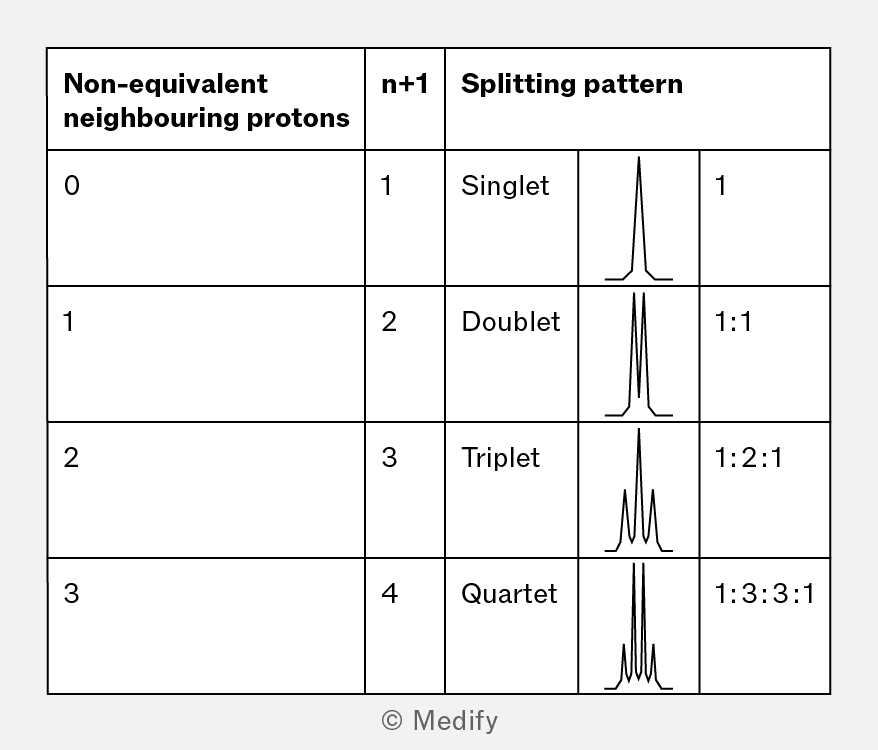
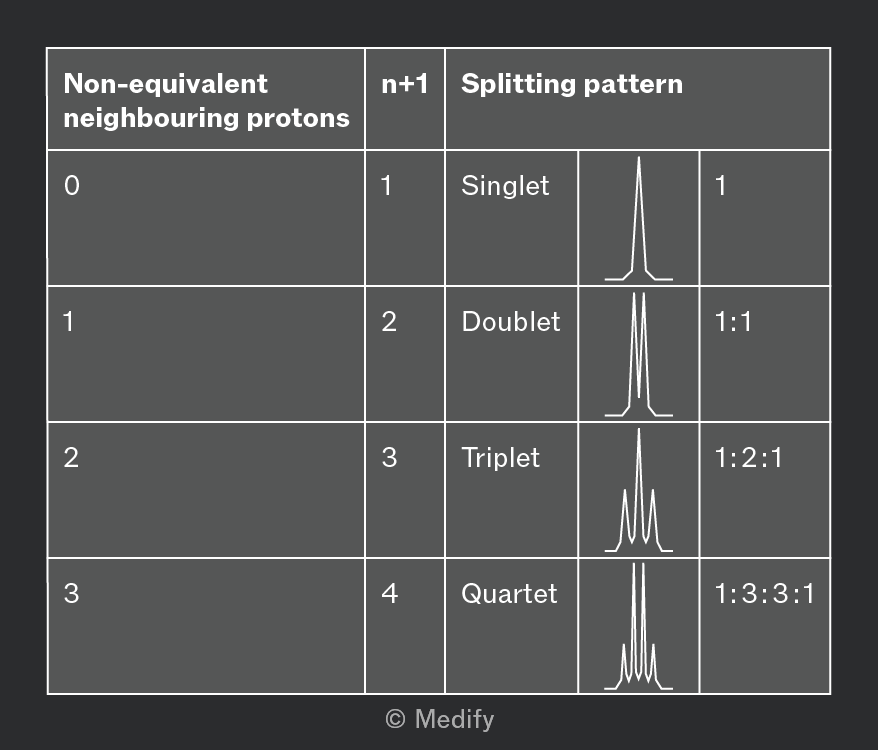
If the main peak is split into more than four sub-peaks, it is called a multiplet.
Protons directly attached to oxygen atoms (e.g. in the group) or nitrogen atoms (e.g. in the group), are sometimes referred to as a labile proton. These protons exchange with other labile protons in the sample or solvent, to varying degrees.
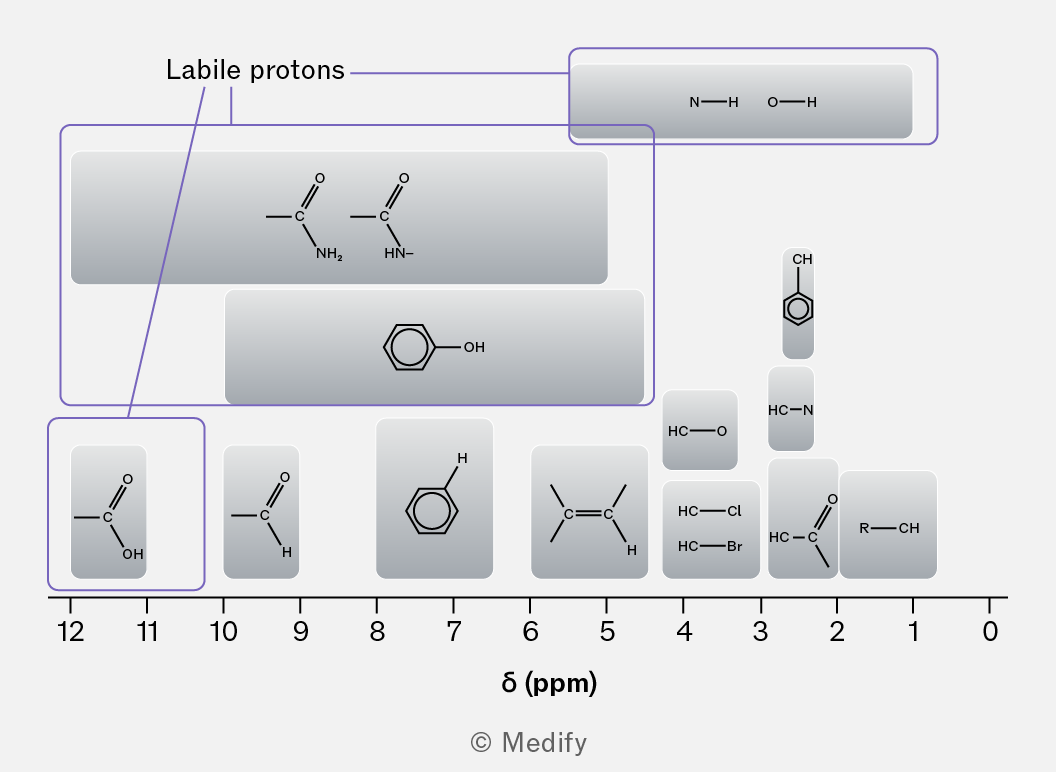
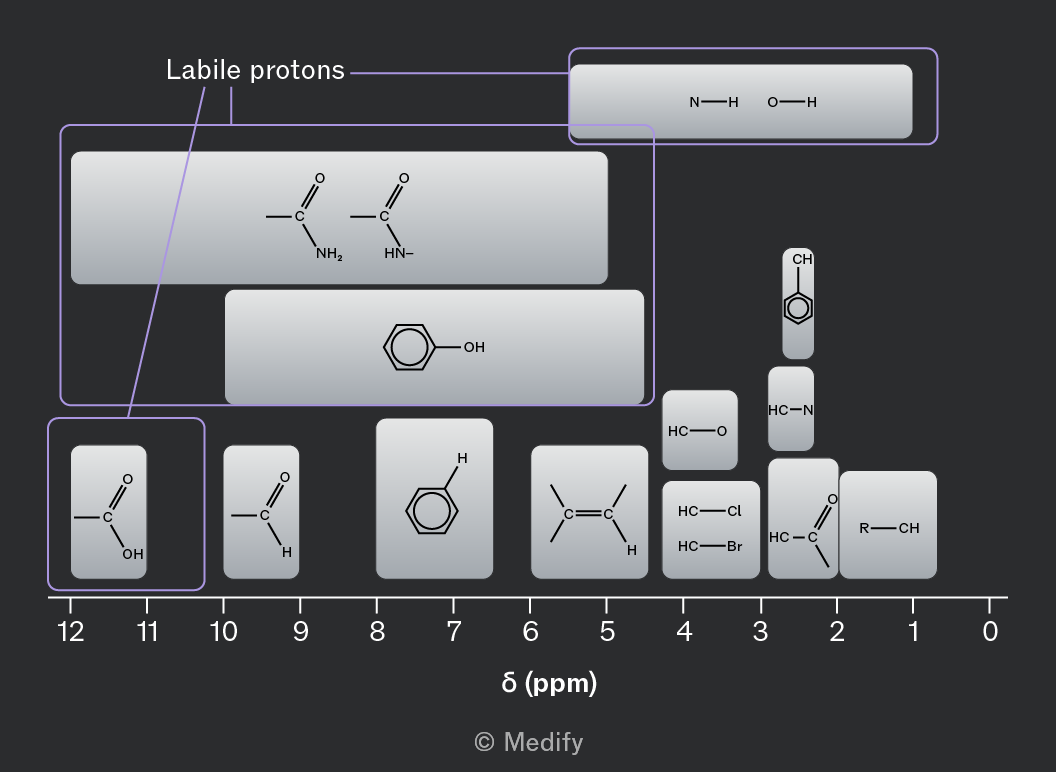
Labile protons:
- Usually show as shorter, broader peaks on an NMR spectrum.
- Do not usually cause the splitting of the peaks of adjacent protons.
- Do not usually have their signals split by adjacent protons.
- Have a wide range of possible chemical shifts – this changes heavily with solvent and sample concentration.
In order to get definite evidence of labile and protons in the sample, the proton exchange method can be used.
- A proton NMR spectrum is obtained in deuterated organic solvent.
- A small volume of deuterated water () is added and the mixture is shaken.
- A second spectrum is obtained.
- Peaks no longer present in the second run are linked to labile protons from or .
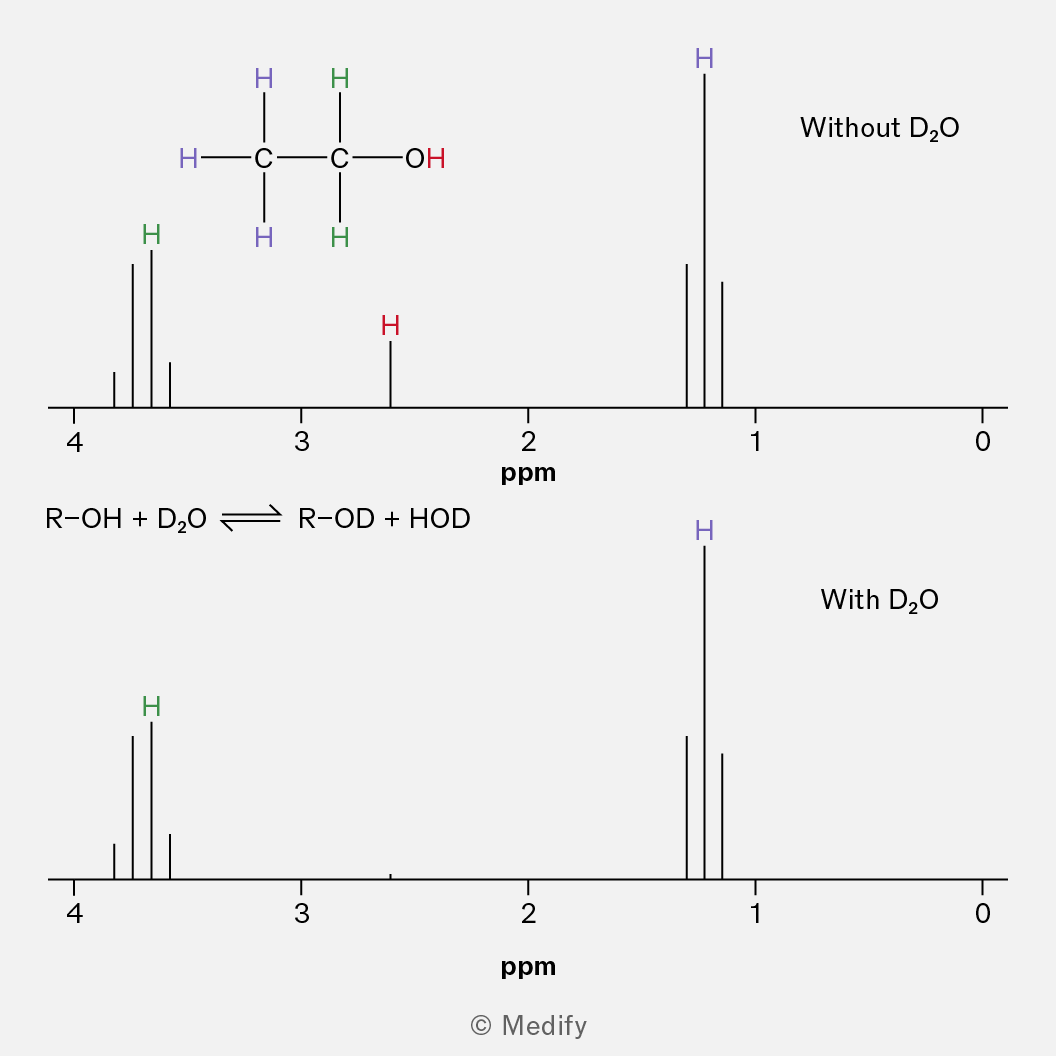
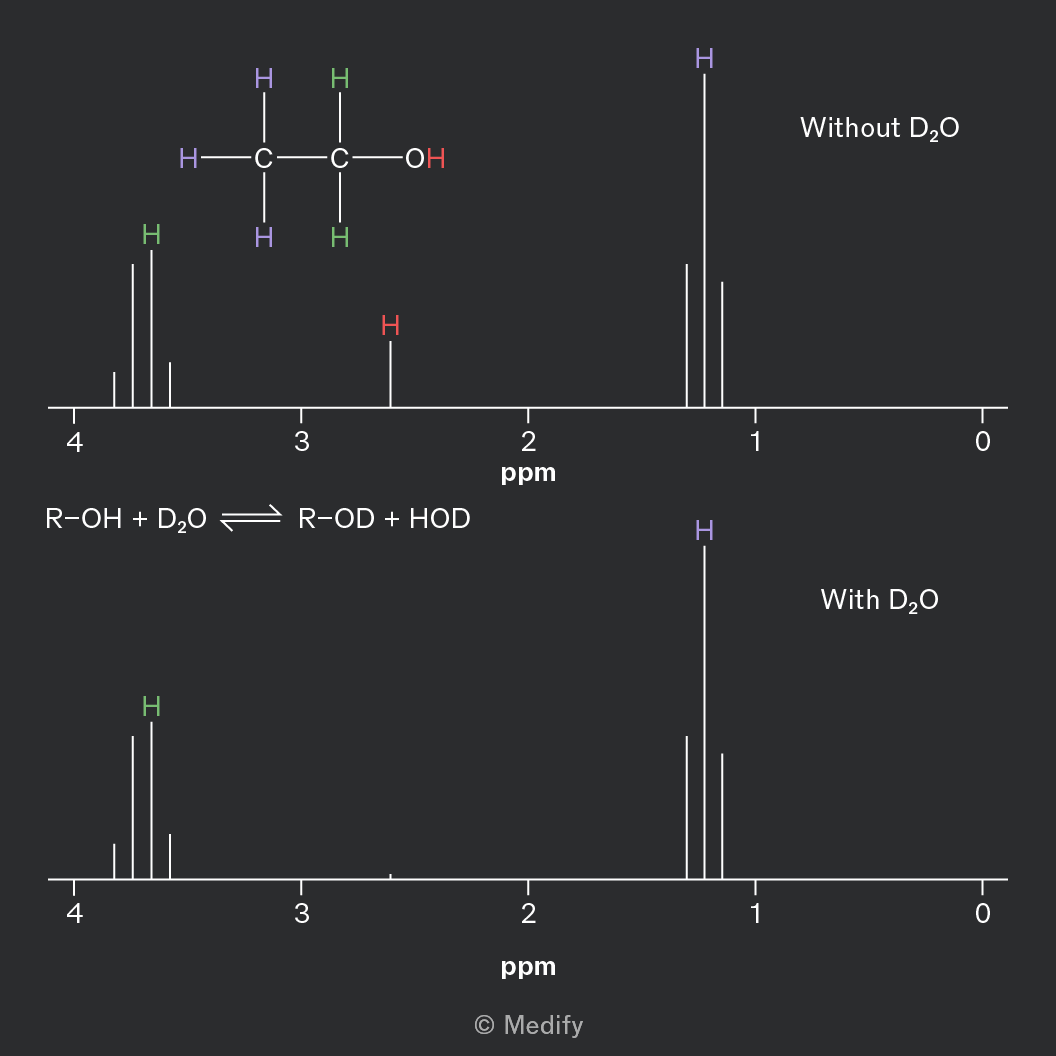
Deuterium, from , exchanges with the or protons in the sample. As deuterium is not visible on NMR the deuterated groups, or are not detected.
Identifying the number of non-equivalent proton environments tells you how many peaks to expect on a proton NMR spectrum.
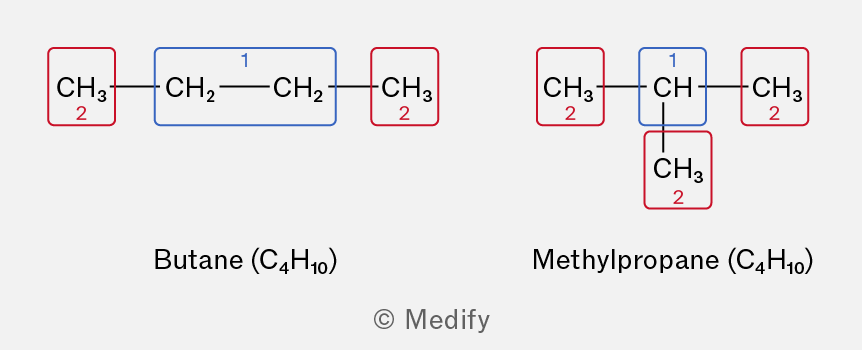
Both butane and its isomer methylpropane have two proton environments.
The number of protons in each environment, and therefore the integrated area under the peaks, is different.
Identifying whether neighboring proton environments are equivalent tells if splitting is expected in a proton NMR spectrum.
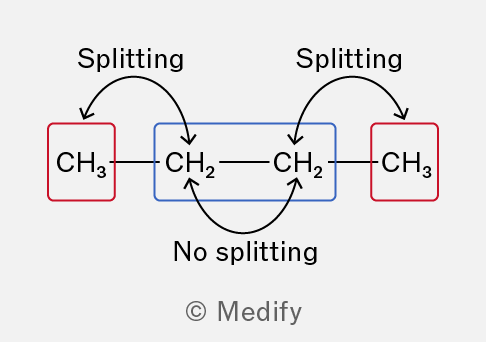
The neighboring groups in butane are in the same environment. They produce a combined signal which is split by the terminal protons forming a quartet.
Each is only split by the two neighboring protons, not the total number of equivalent protons in the environment. The peak produced is a triplet, not a multiplet.
The molecules below are sorted according to the number of non-equivalent proton environments they possess.
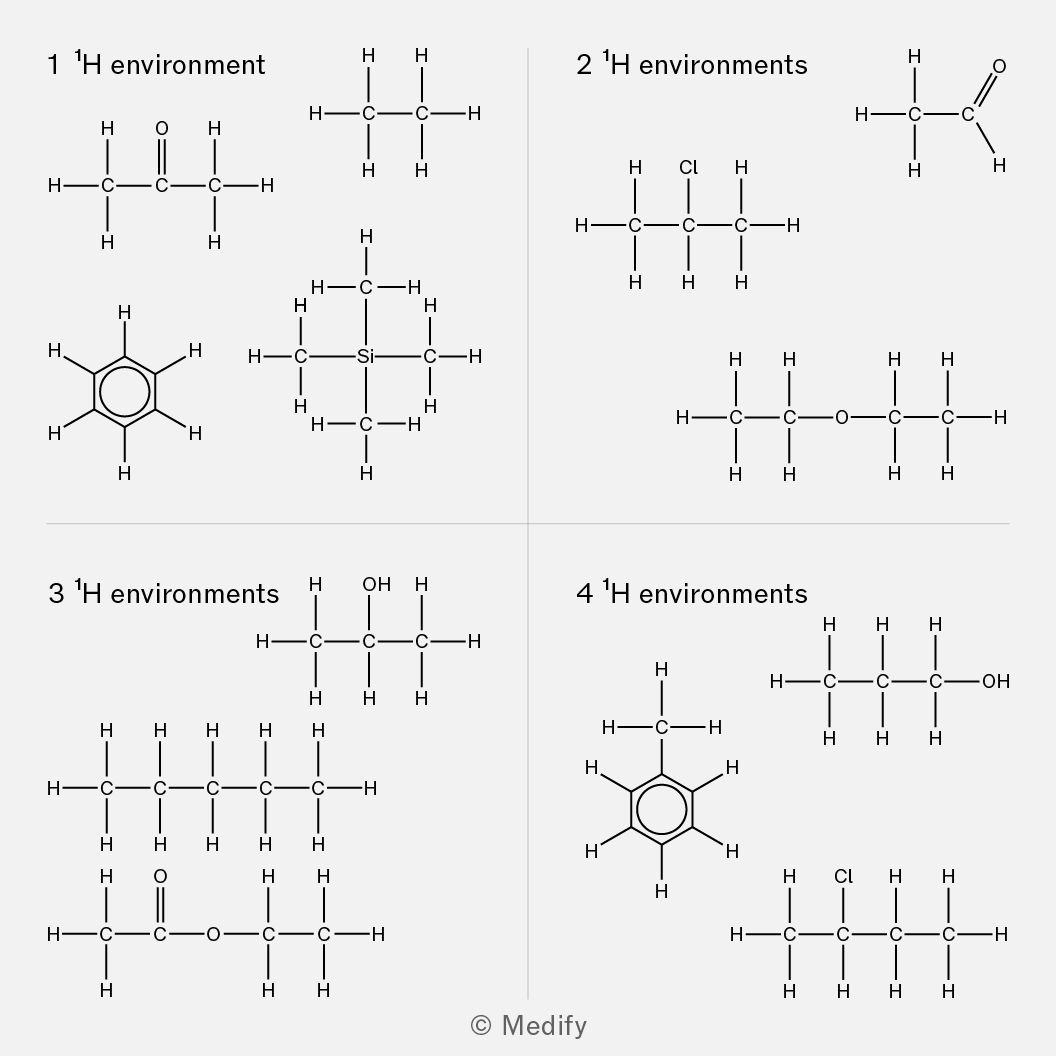
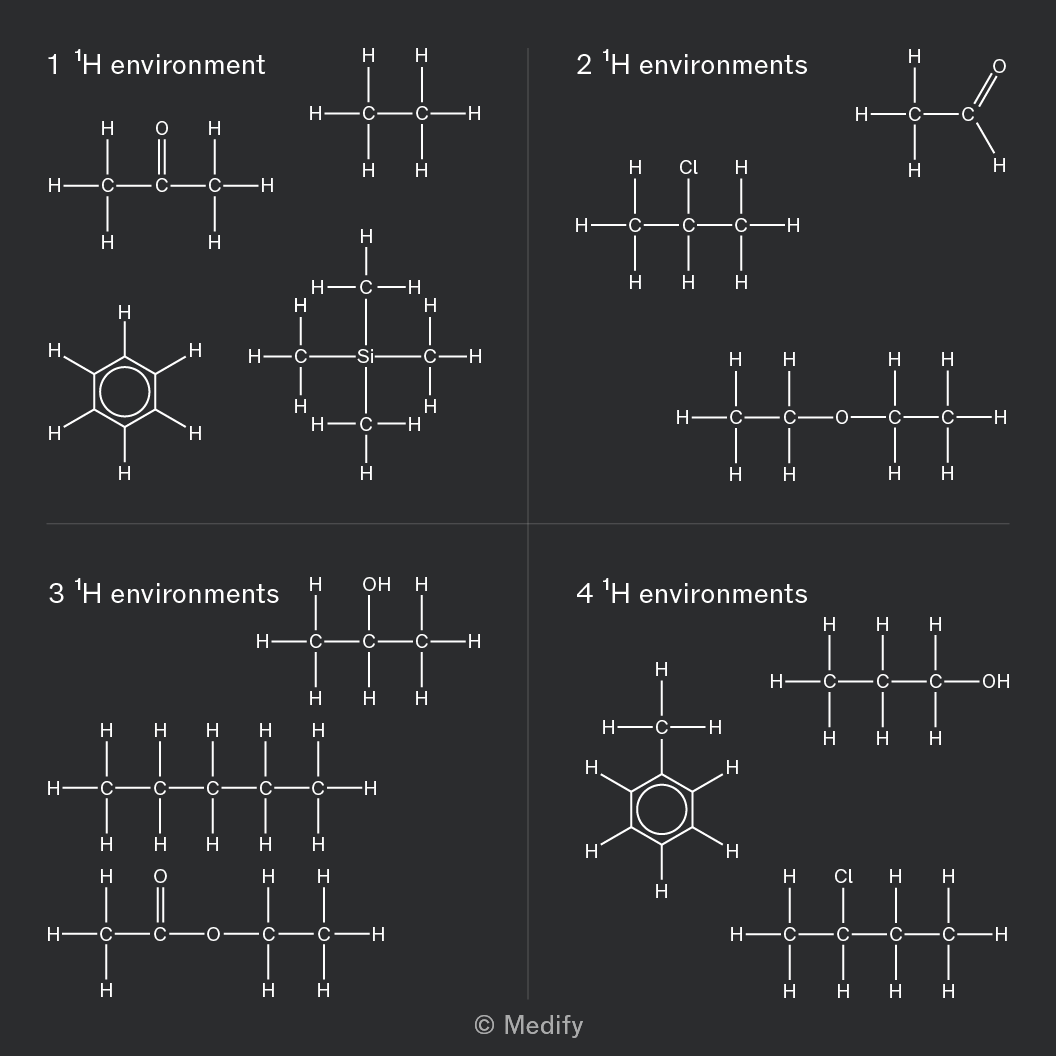
Note that:
- Asymmetry in esters and amides means that alkyl groups either side cannot be equivalent.
- Protons on alcohols and amines are counted although they are not visible on the NMR spectrum when is present.
- In aromatic compounds the ortho, meta and para positions are considered different environments.
Using skeletal displayed formula, in whole and especially in part, can lead to difficulties in counting protons and equivalent proton environments.
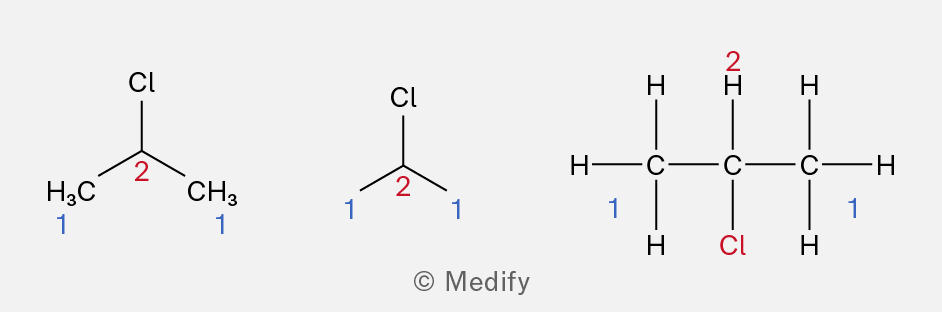
Identifying the number of non-equivalent carbon environments tells you how many peaks to expect on a carbon-13 NMR spectrum.
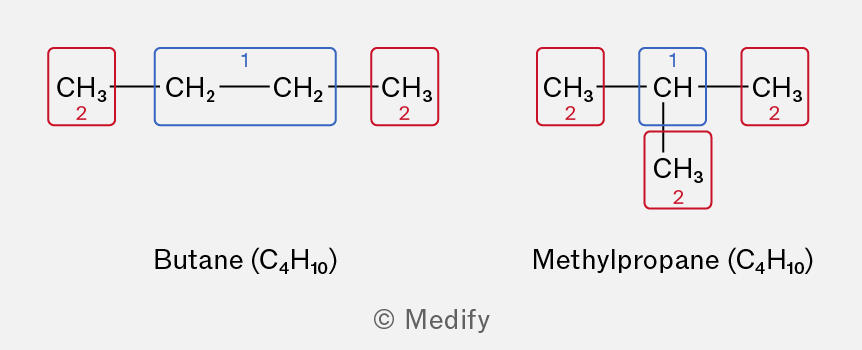
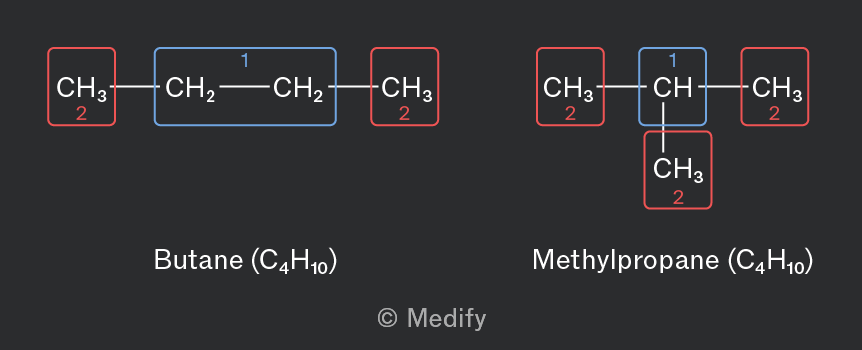
Both butane and its isomer methylpropane have two carbon environments.
The number of carbons in each environment, and therefore the integrated area under the peaks, is different. Butane will show relative peak intensity of 1:1 whereas methylpropane will show relative intensity at 1:3.
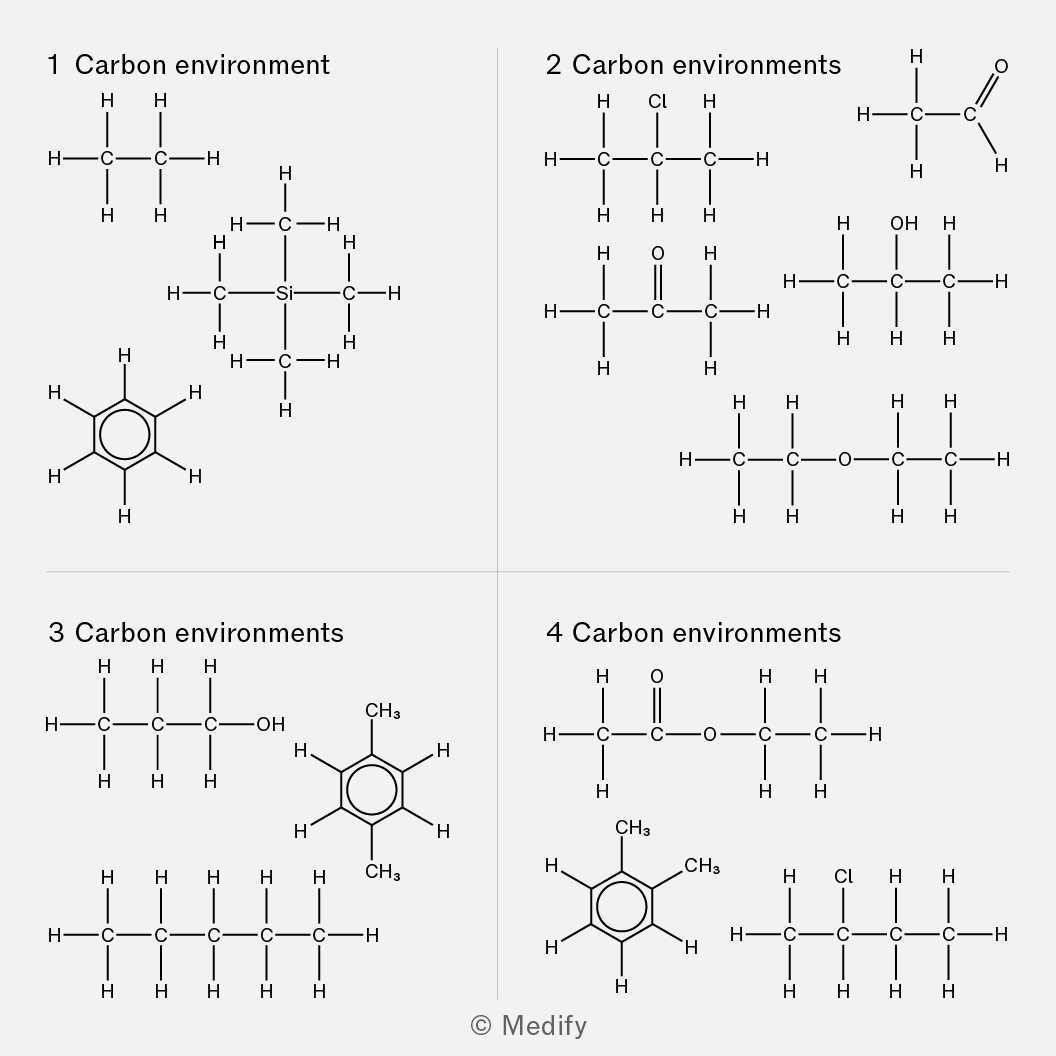
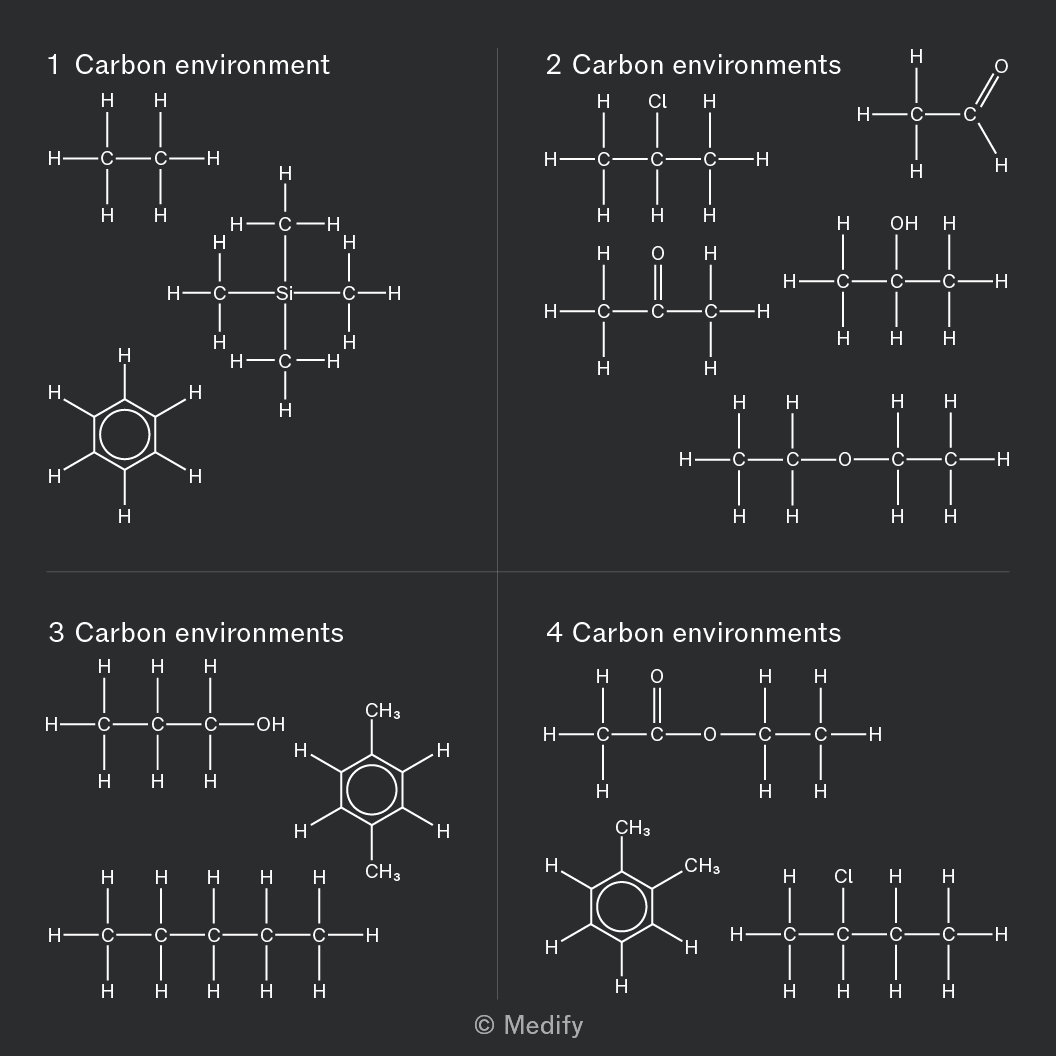
The molecules below are sorted according to the number of non-equivalent carbon environments they possess.
Infrared (IR) spectroscopy is an analytical technique that enables chemists to identify vibrations from covalent bonds within molecules.
This is useful for working out the characteristic functional groups within organic compounds.
Vibrational movement of covalent bonds exists as two main types: bond stretching, and bond bending.
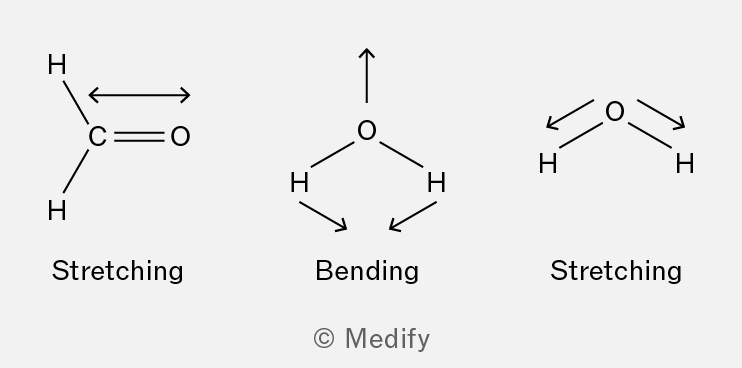
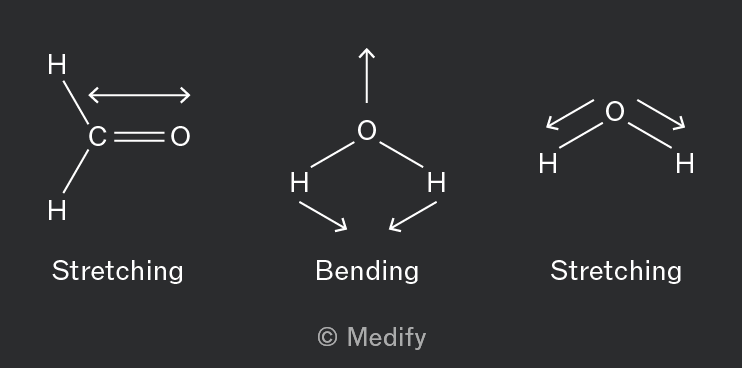
Each vibration is associated with a particular wavelength and frequency. When exposed to IR radiation the bonds absorb radiation at their characteristic wavelength and vibrate more vigorously.
An IR spectrum is a plot of transmittance against wavenumber (reciprocal of wavelength).
Wavenumbers are typically recorded from 400 to 4000 cm-1.
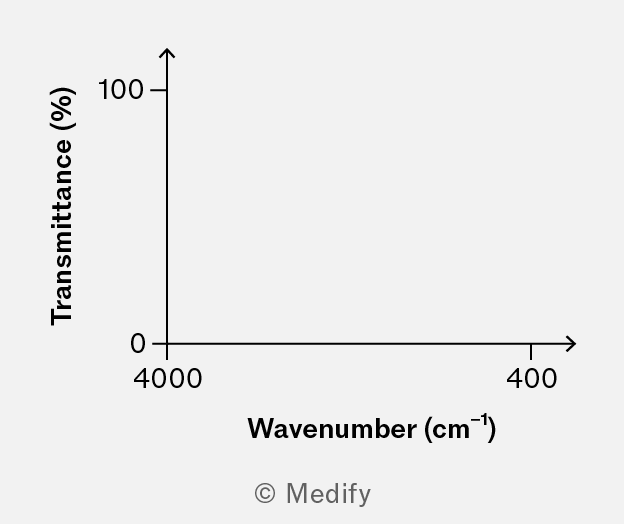
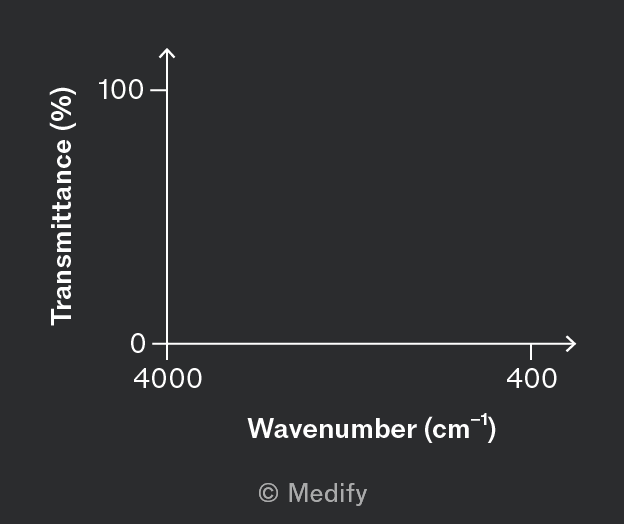
Each peak in the spectrum corresponds to absorption by a specific vibrational mode of the molecule.
Spectra can be analysed by comparing absorption regions with a database of expected wavenumbers for different functional groups.
Vibrational absorptions are seen where there are inverted peaks; in these regions there is a reduction in the radiation able to pass through the sample.
The deeper the peak the more radiation has been absorbed. These prominent peaks are most distinctive, and therefore most useful in characterisation.
The IR spectrum for propanal is shown below.
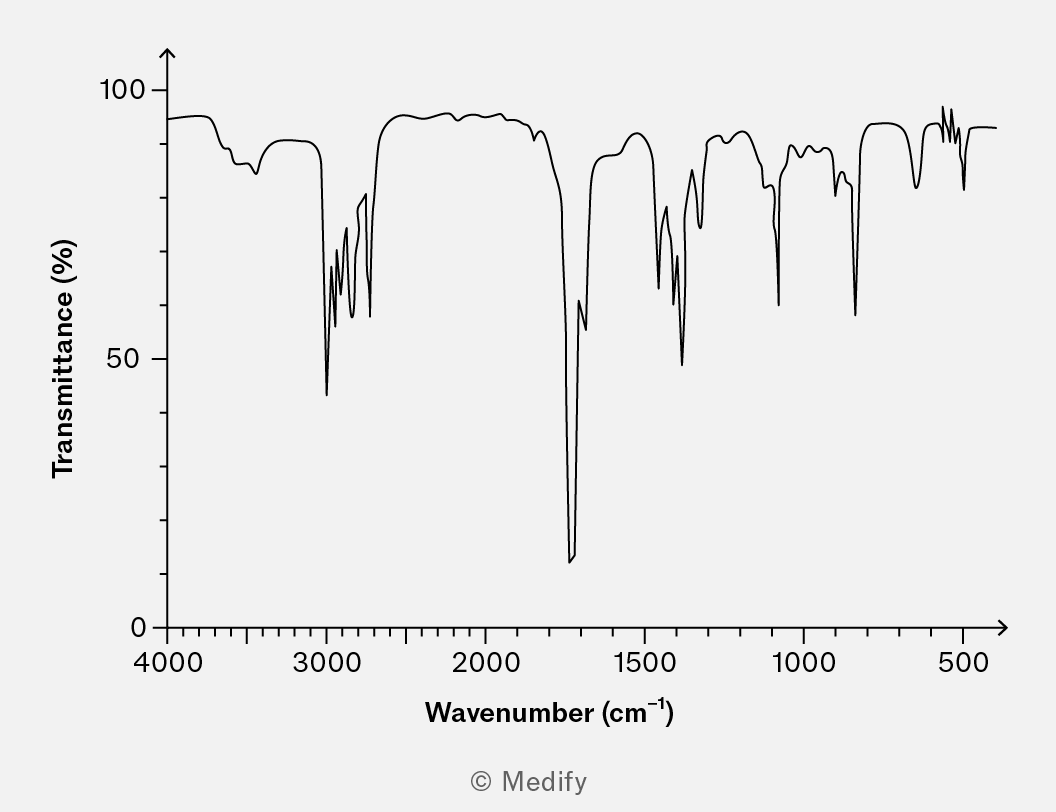
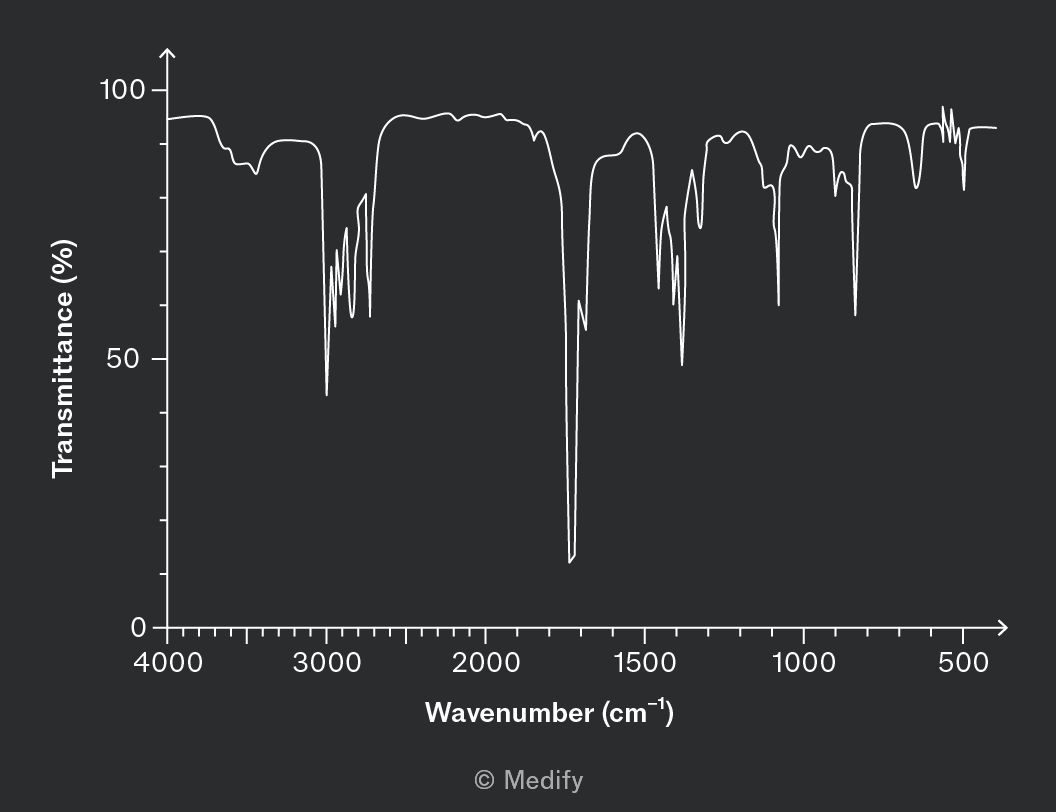
It has a prominent peak around 1700 cm-1 which is characteristic of the carbonyl functional group present in .
IR radiation is only absorbed by covalent bonds that have a permanent dipole, such as , and . The dipole does not need to be large but it must exist.
Vibrations from bonds without a permanent dipole, such as or , are invisible in IR spectrometry.
Non-polar molecules containing polar bonds, such as linear , have a combination of IR visible and invisible vibrating modes dependent on symmetry.
The most abundant atmospheric gases, and , show no change in dipole moment and do not interact with infrared radiation.
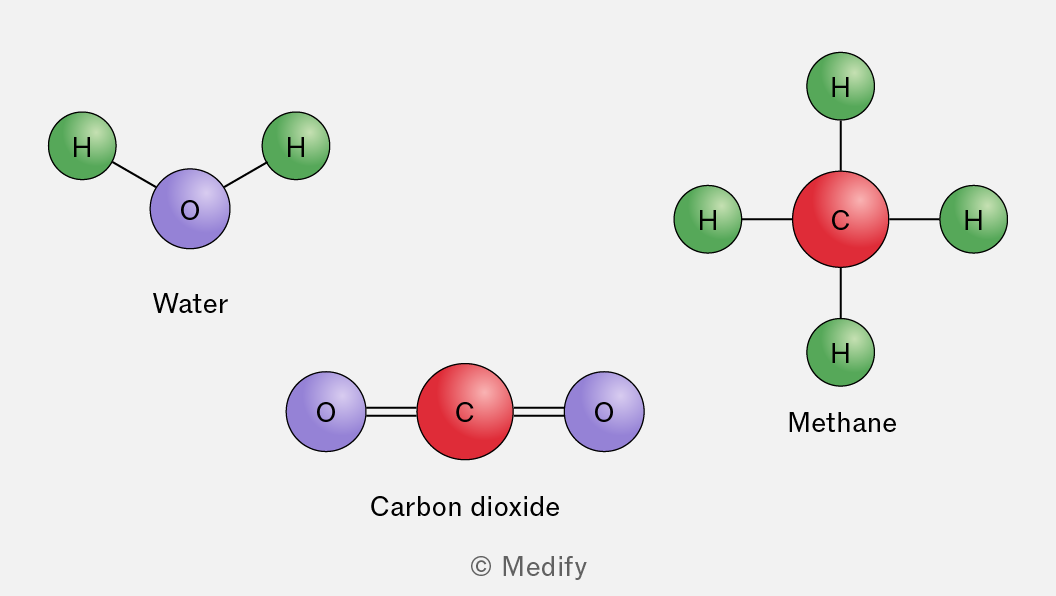
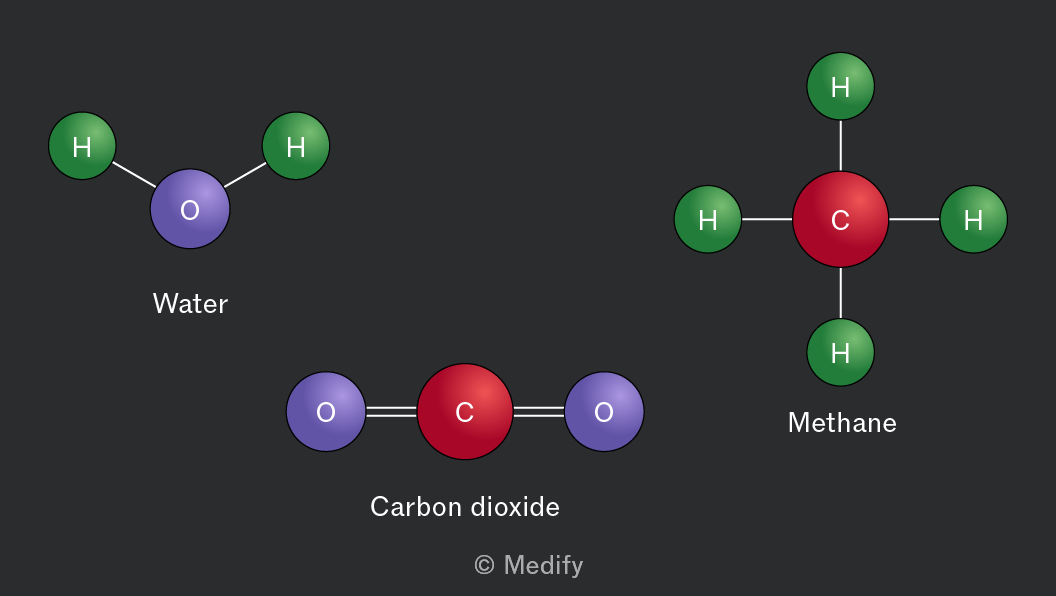
Some atmospheric gases do absorb IR radiation; these include , , and .
These gases are known as greenhouse gases.
When solar radiation enters the earth’s atmosphere, it is absorbed by the earth’s surface and oceans before being re-emitted at longer wavelengths, mainly as IR radiation.
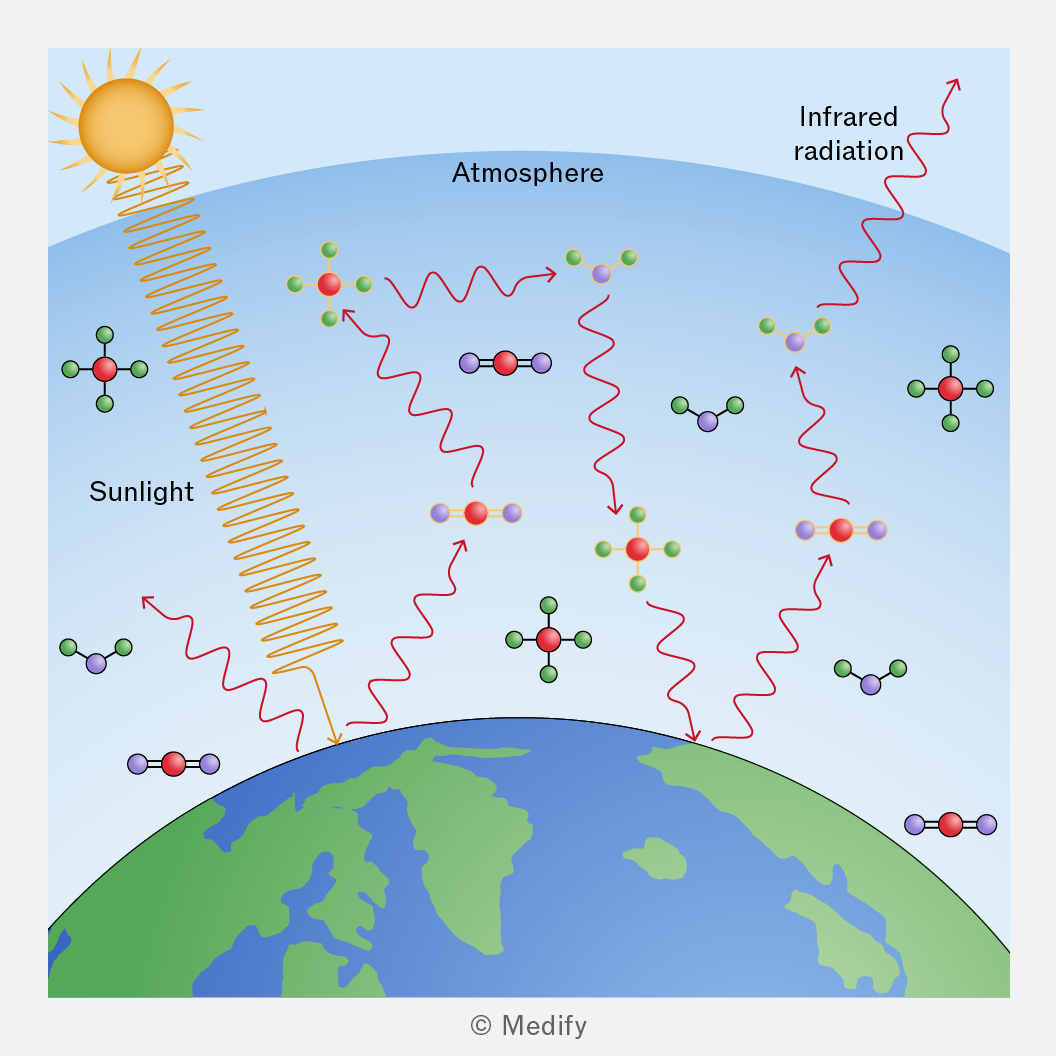
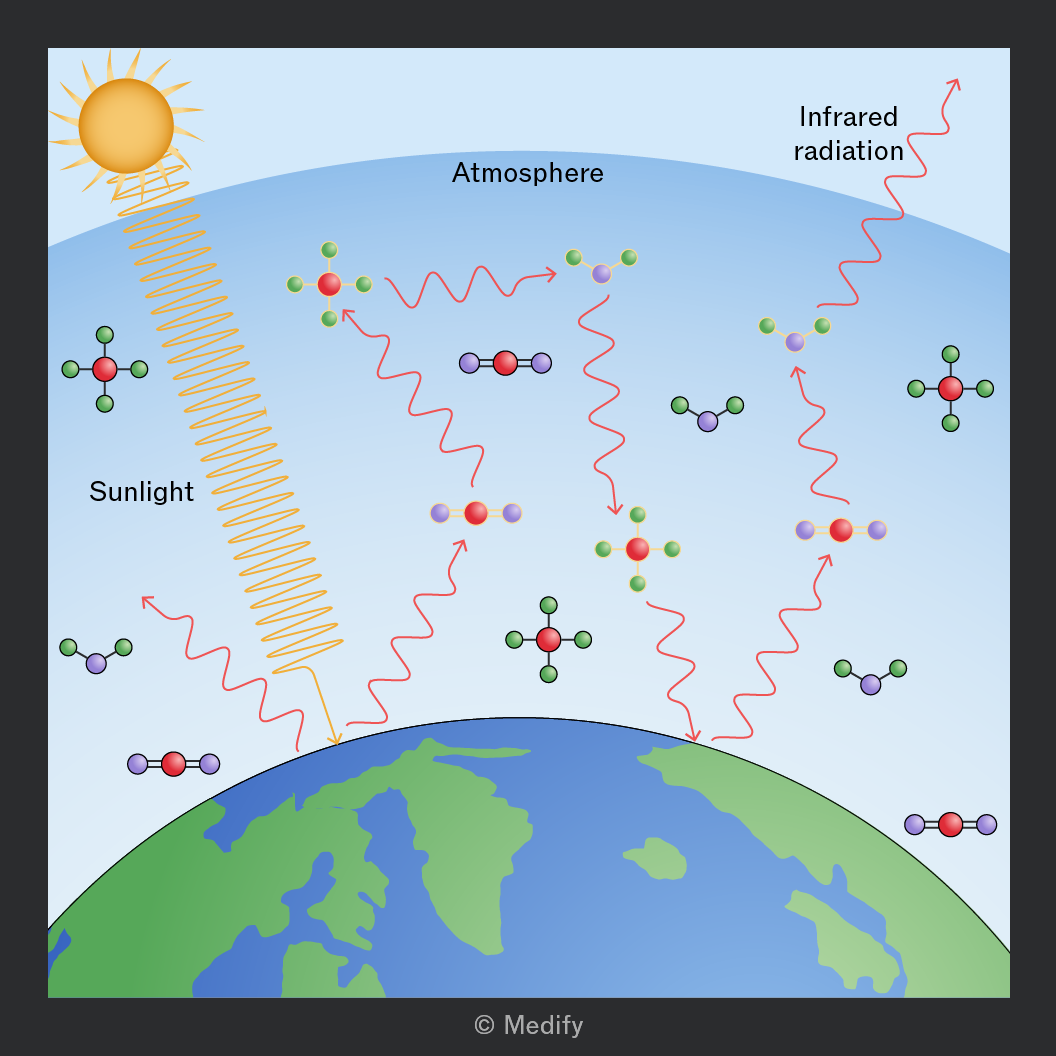
The increased presence of atmospheric gases that interact with IR radiation cause a greater proportion of this radiation to be held within the atmosphere rather than entering space. This causes heating of the atmosphere, and scientists refer to this as global warming.
Human activity, most notably the extraction and combustion of fossil fuels, have led to much greater levels of atmospheric in recent history.
Increased reliance on renewable energy sources with reduced production such as nuclear, wind, wave, solar, and tidal power, alongside using carbon capture and storage methods should slow greenhouse gas production and global warming.
Different functional groups present in an organic compound can be identified from their IR stretching peaks.
A basic outline of the main groups and their characteristics absorption frequencies in IR is as shown below:
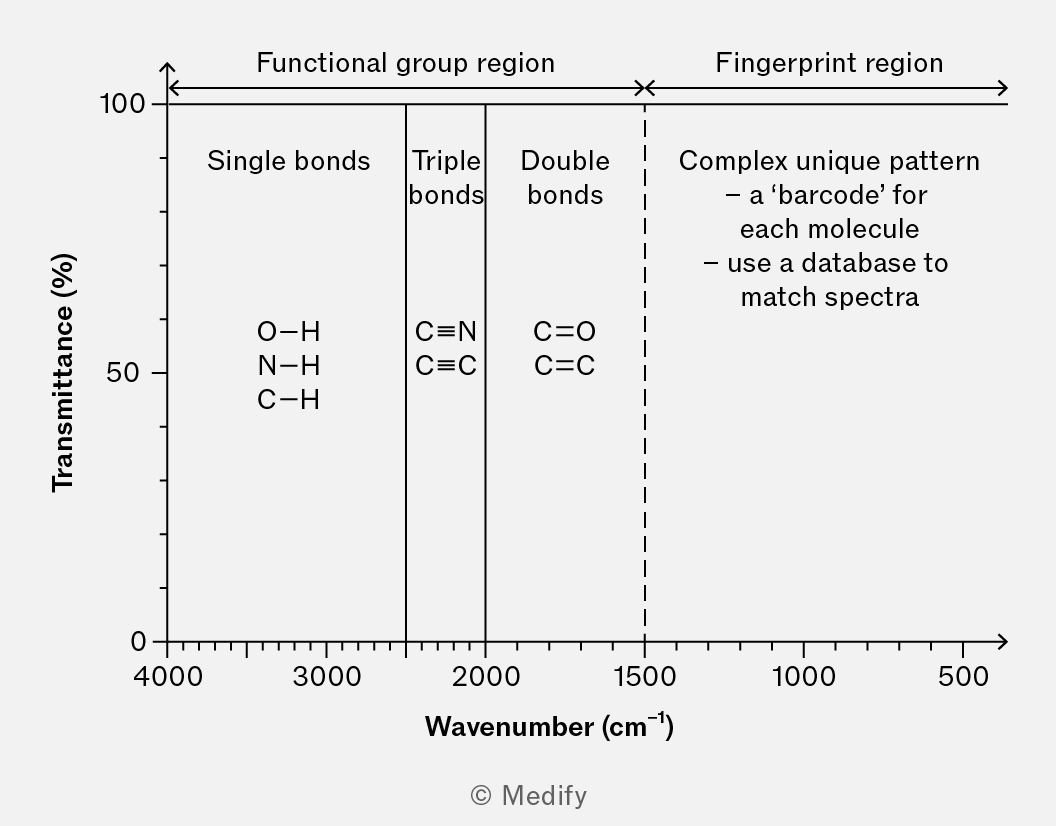
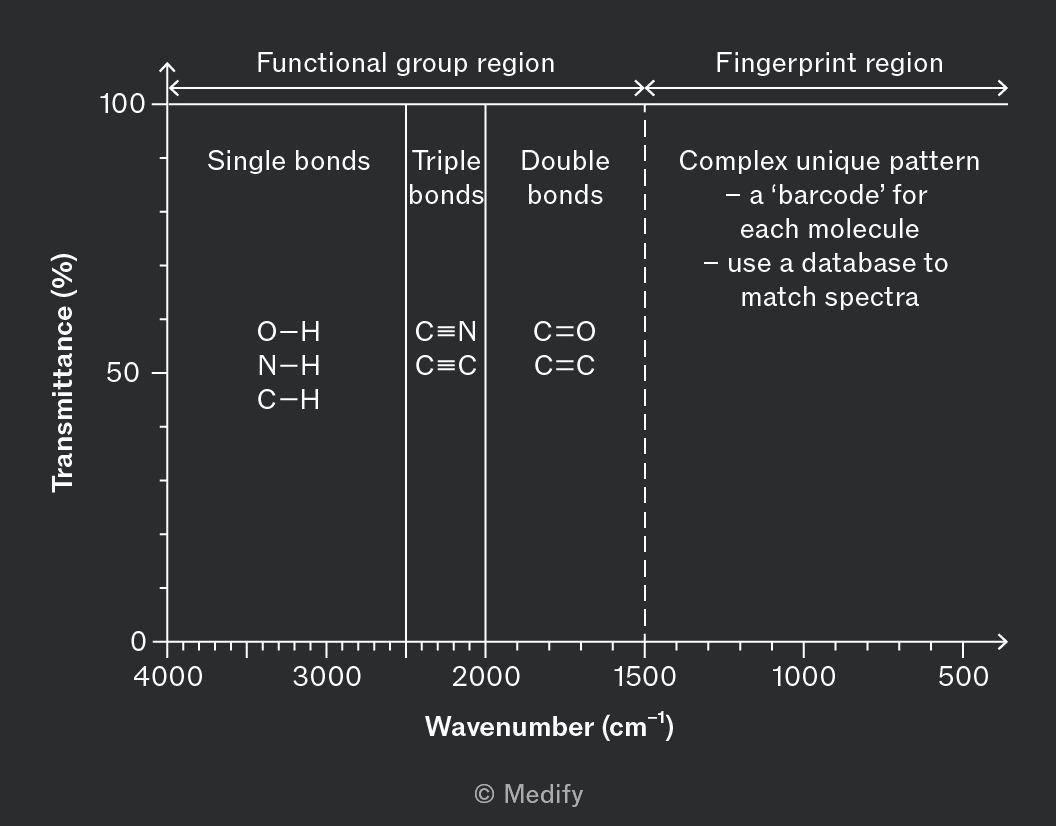
You will not be required to memorise this data.
The absence of particular peaks from a spectrum can also help to confirm the identity of a functional group.
A commonly tested scenario is analysis of an alcohol oxidation. This involves distinguishing unreacted alcohol, aldehydes, ketones, and/or carboxylic acids.
Here we need to look for the absence, or presence, of the carboxylic acid’s broad peak. Likewise, the absence or presence of an alcohol peak. This will give a definitive answer on the presence of a carboxylic acid or an unreacted alcohol.
Aldehydes and ketones require additional data to identify. The IR spectra could be combined with NMR, mass spectrometry or qualitative tests such as using the Tollens reagent.
The region comprising a series of many overlapping peaks, to the right hand side of the IR spectrum, from 1500 – 500 cm-1, is known as the fingerprint region.
Two similar molecules, such as structural isomers, propan-1-ol and propan-2-ol, will produce a similar spectra in the functional group region, however, there will always be significant differences in the fingerprint region.
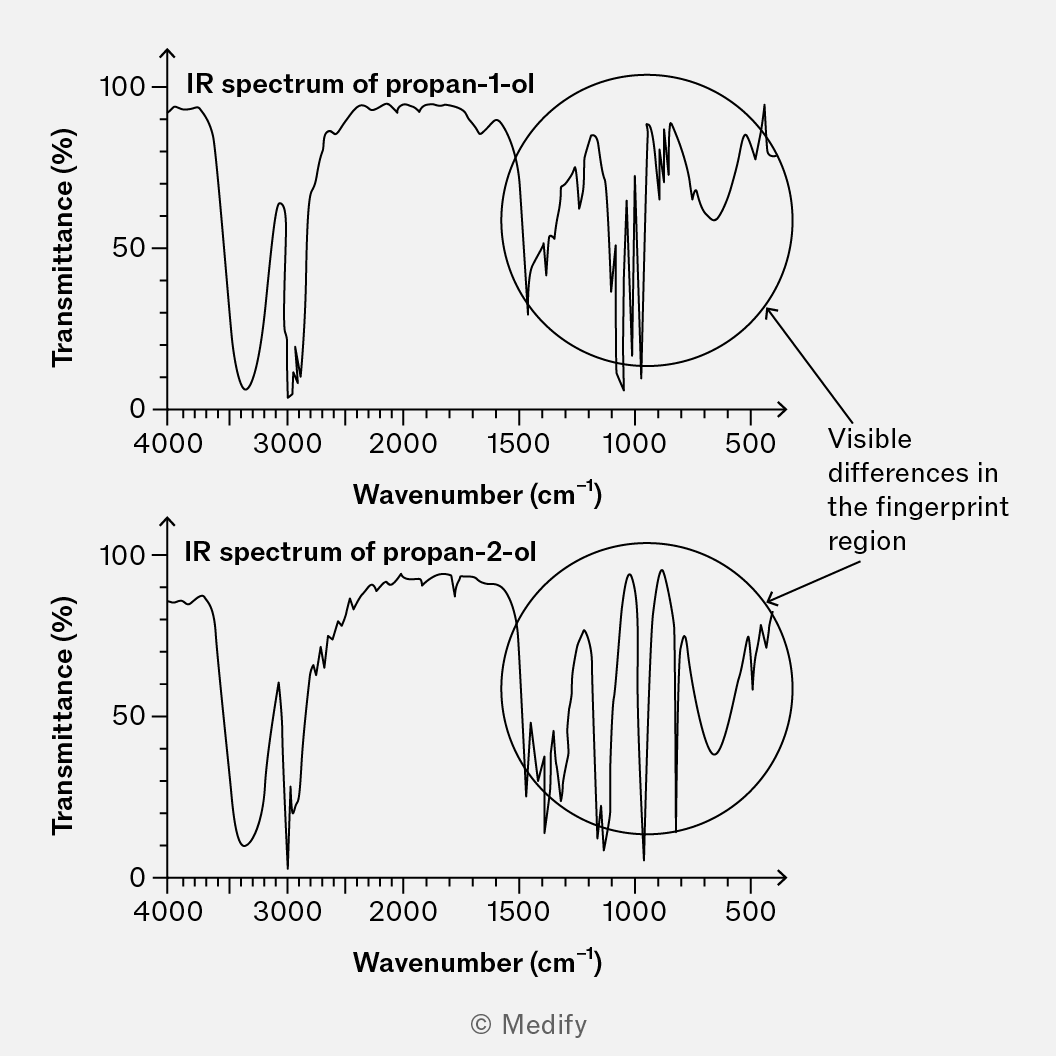
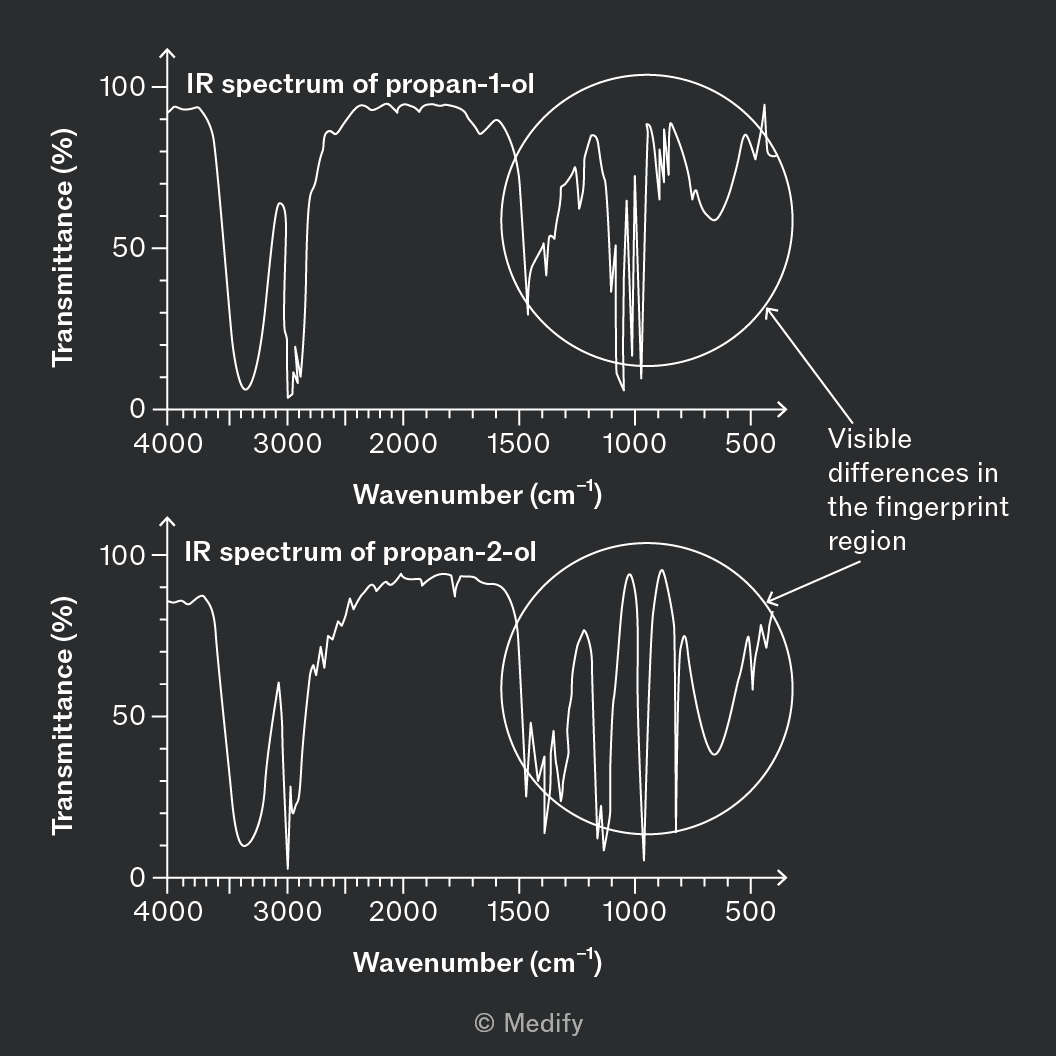
The fingerprint region provides a set of peaks that is uniquely characteristic of each compound, meaning it serves as a molecular fingerprint that allows identification of a molecule.
By comparing the fingerprint region of an unknown compound to reference spectra, chemists can accurately identify the compound. The process is called fingerprinting.
Infrared spectroscopy is used to identify and monitor levels of airborne pollutants and other volatile compounds that are not normally present at significant levels within the Earth’s atmosphere.
Molecules indicative of atmospheric pollution include unburnt hydrocarbon fragments with and bonds, combustion products such as and
Infrared has several specific uses in the fields of forensic investigation, including:
- Detection of accelerant residues from headspace sampling of fire-scene debris looking for evidence of arson.
- Matching components from vehicle paint to samples from road collisions.
- Analysis of breath samples for ethanol content from suspected drink drive cases.
Infrared analysis is a non-destructive technique so criminal evidence is not lost.
Chromatography is a separation technique used in which a mixture of substances, dissolved in a mobile phase, is passed over an inert stationary phase.
Separation is achieved through exploiting the difference in the sample’s solubility in the moving phase compared to its retention by the stationary phase.
Key types of chromatography include:
- Thin layer chromatography (TLC).
- Gas chromatography (GC).
- High pressure liquid chromatography (HPLC).
In thin-layer chromatography (TLC) the stationary phase is coated onto a flat plate. The solvent travels up the TLC plate via capillary action.
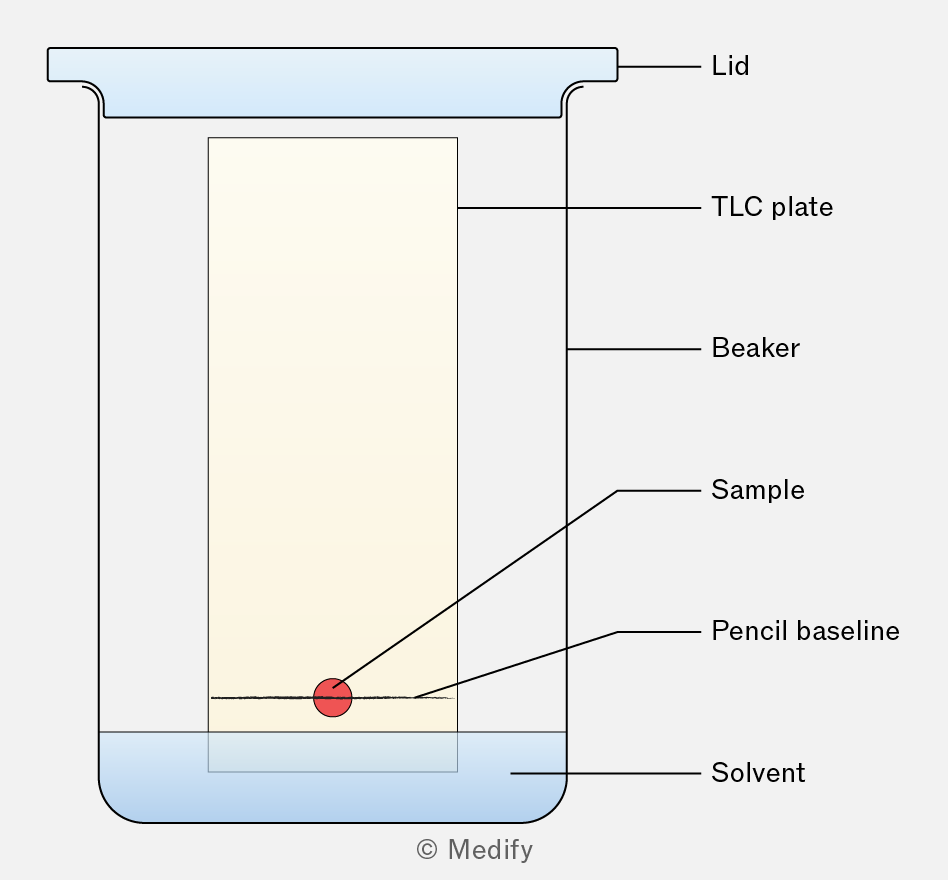
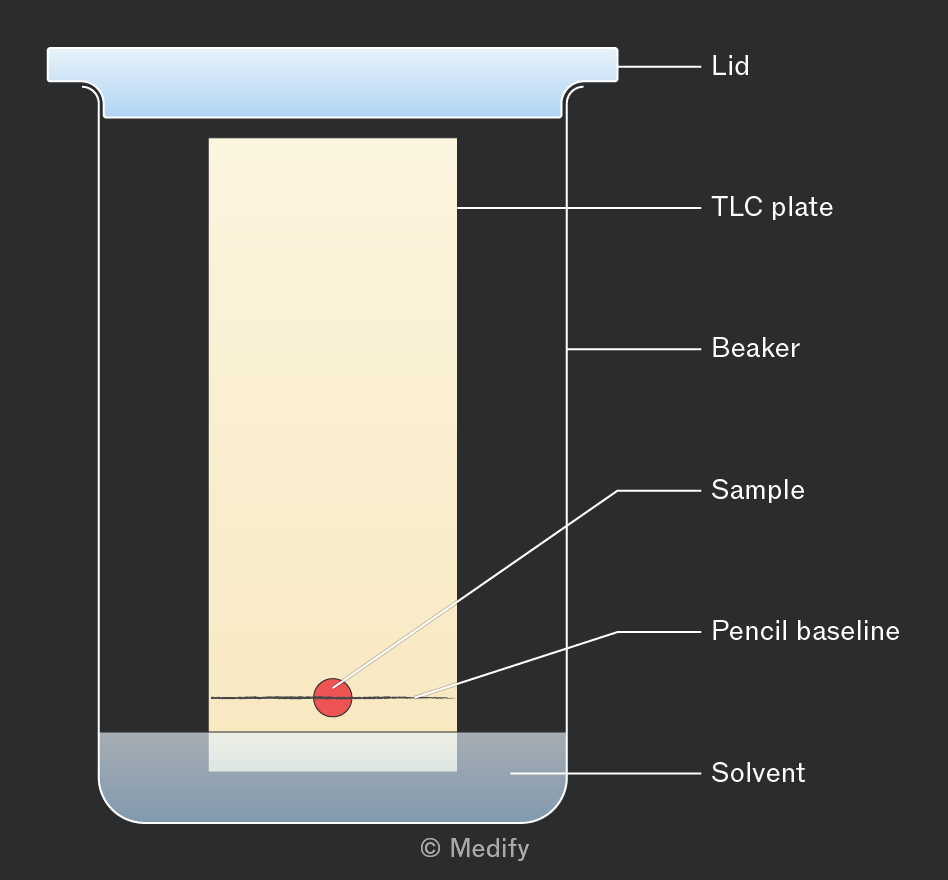
To run a successful TLC experiment:
- Select a solvent in which the sample has some solubility.
- Ensure your baseline is not soluble (use pencil).
- Make sure the solvent level is below the baseline.
- Lid the beaker to reduce evaporation of the solvent front.
- Remove the plate before the solvent reaches the plate’s top.
stands for retention factor and represents how far through a stationary phase a component has moved compared to the distance moved by its solvent.
Compounds can be identified by comparing their values to those of known substances.
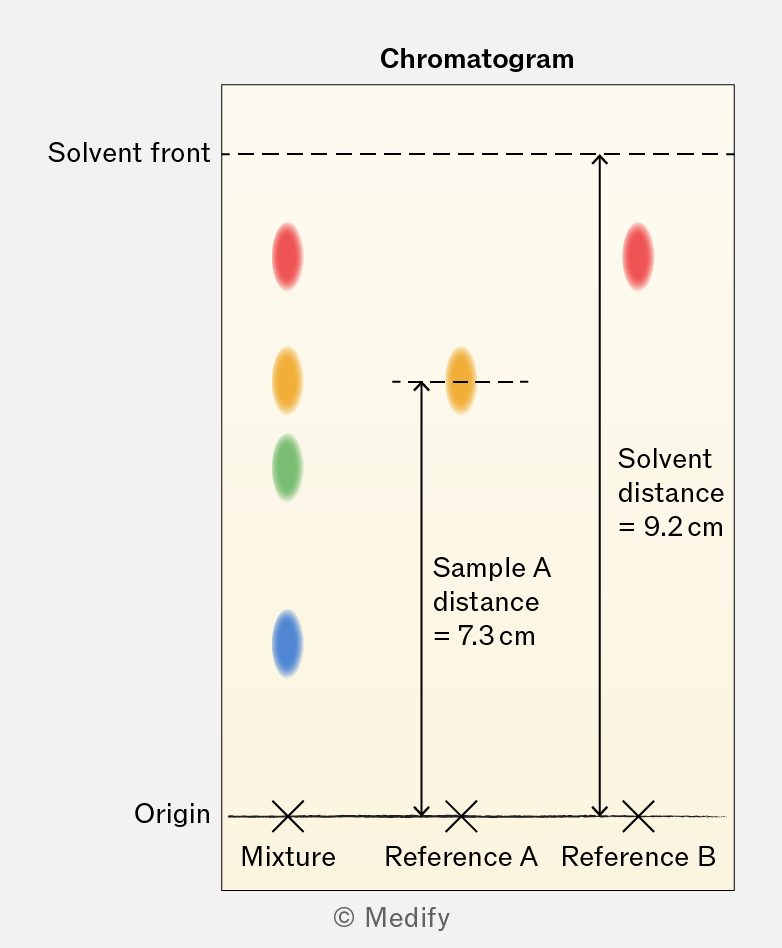
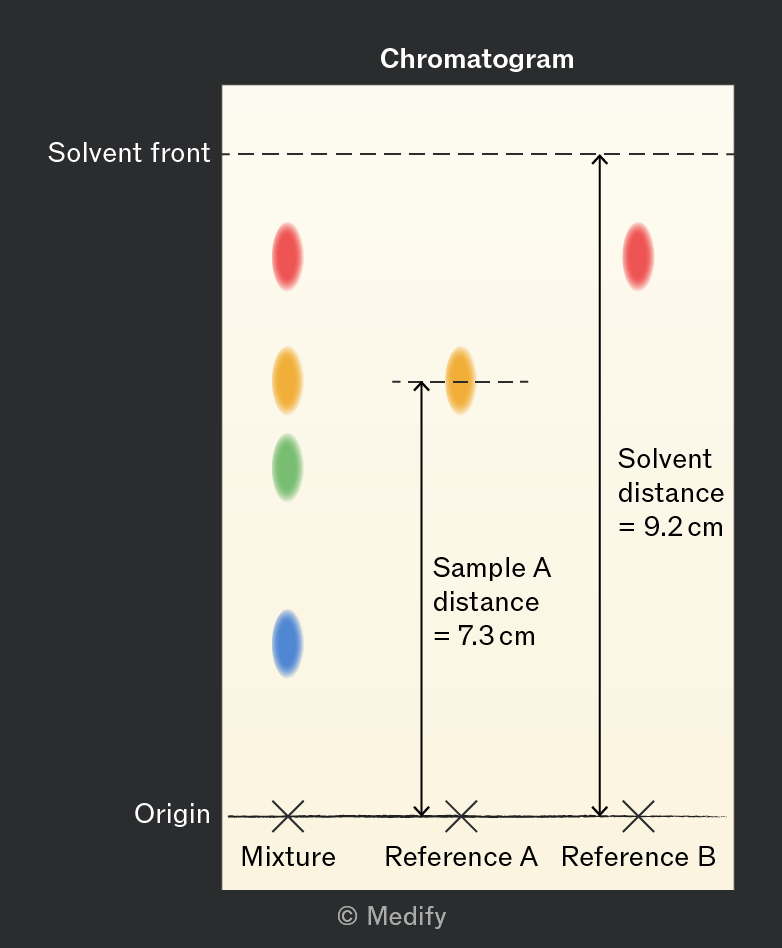
For the chromatogram shown above, the calculated value of reference A is:
The greater the value, the closer the distance moved by a sample is to the distance moved by the solvent. This indicates a sample is more strongly attracted to the solvent than to the stationary phase.
All values will be less than 1.
Note that values are specific to the stationary phase and solvent being used.
High pressure liquid chromatography (HPLC), and gas chromatography (GC), are both forms of column chromatography.
In column chromatography, the stationary phase is packed into the column. The mobile phase, containing the sample, is allowed to pass through the column.
As the solvent moves down the column, the sample components are separated based on solubility in the moving phase compared to retention by the stationary phase. Components that interact more strongly with the stationary phase move more slowly and are extracted out of the column (eluted) later.
The sample is separated into its individual components, which can then be collected and analysed. Pairing separation by column chromatography with analysis by mass spectroscopy (MS) is common in analytical chemistry.
Many conditions in column chromatography must be controlled. These include:
- Type of stationary phase.
- Type of mobile phase.
- Flow rate.
- Temperature.
Under the same conditions molecules will always exhibit the same retention time. This can be used to identify specific compounds from a mixture when compared to a database on reference materials.
Gas chromatography (GC), uses a column packed with an inert solid, or with a solid coated by a liquid. An inert carrier gas is passed through the column under pressure and at a high temperature.
All sample components are injected at the same time; the first component to emerge has the shortest retention time. This means the component has the greatest bonding affinity for the carrier gas compared to the retention by the stationary phase.
In the output spectra for high pressure liquid chromatography (HPLC), and gas chromatography (GC), the area under a sample peak is proportional to the concentration of compound in the sample. This area is the integrated peak height.
A calibration graph can be produced by running samples of the target material at known concentrations through the set-up.
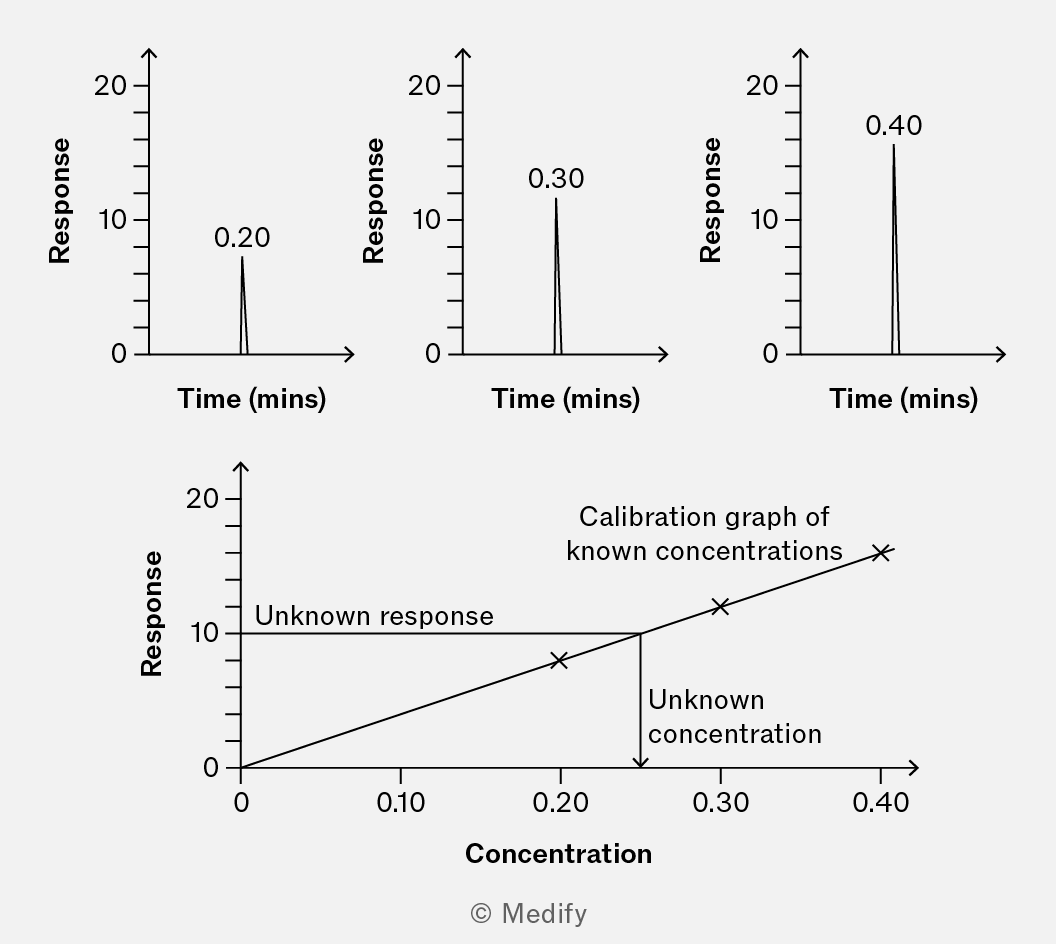
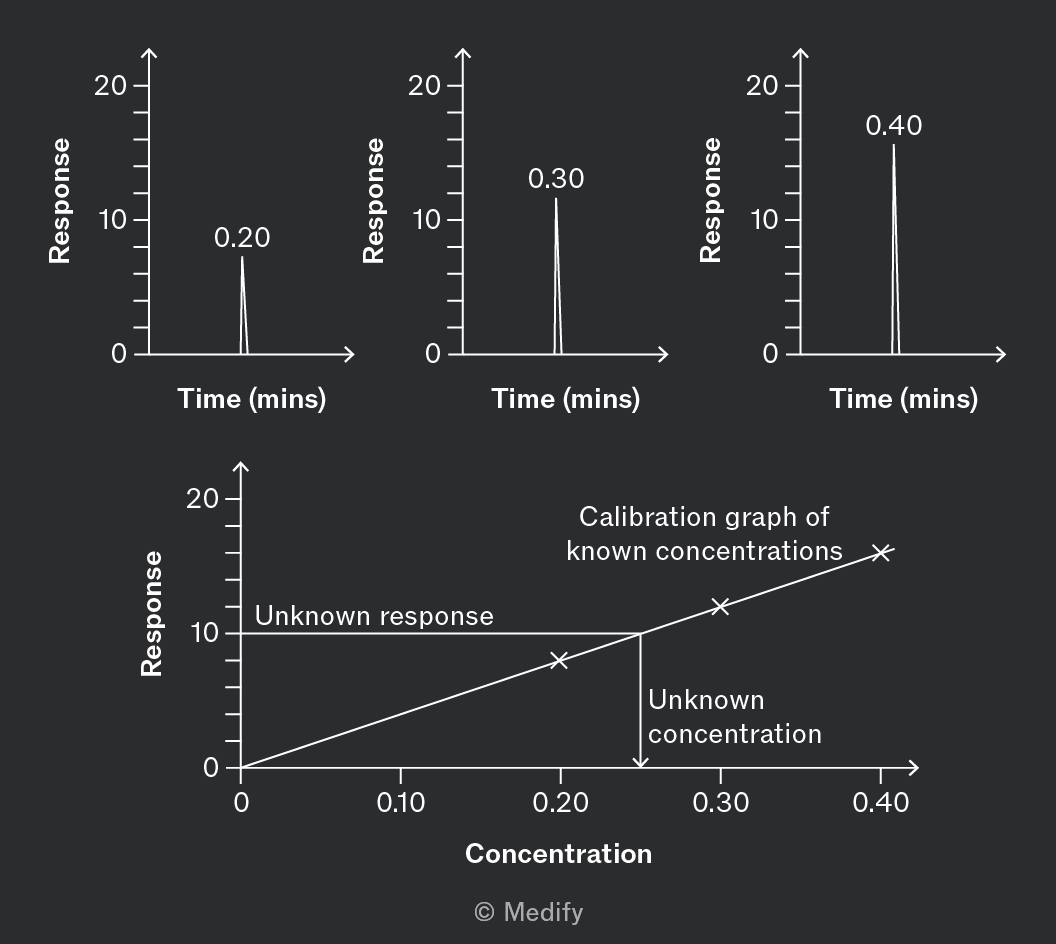
The calibration graph can be used to measure the concentration of a component in the test sample from its integrated peak on the spectra.
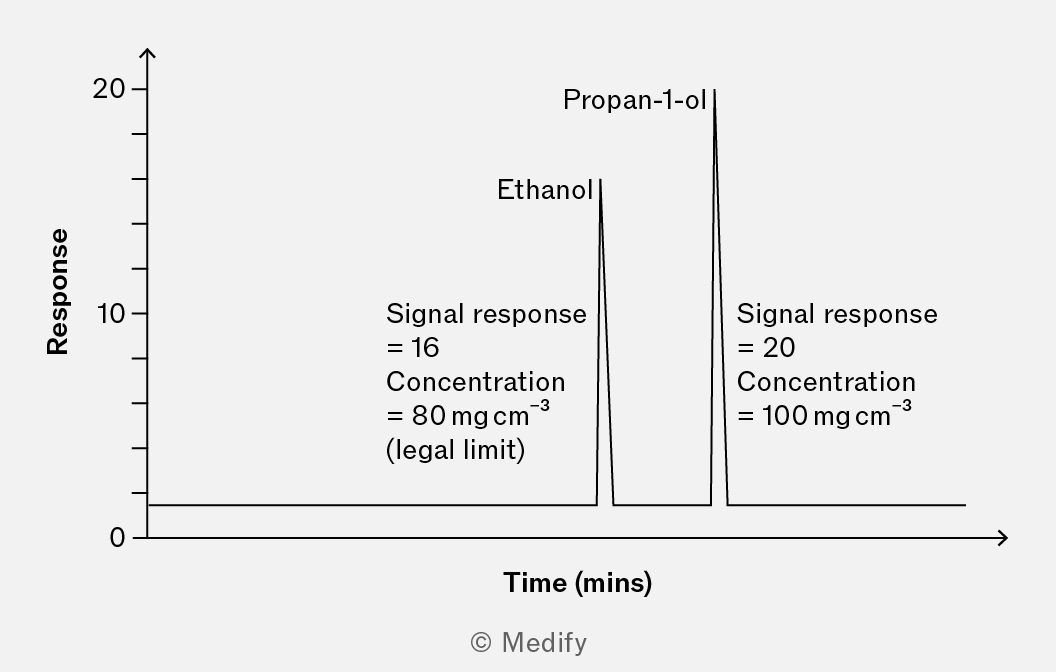
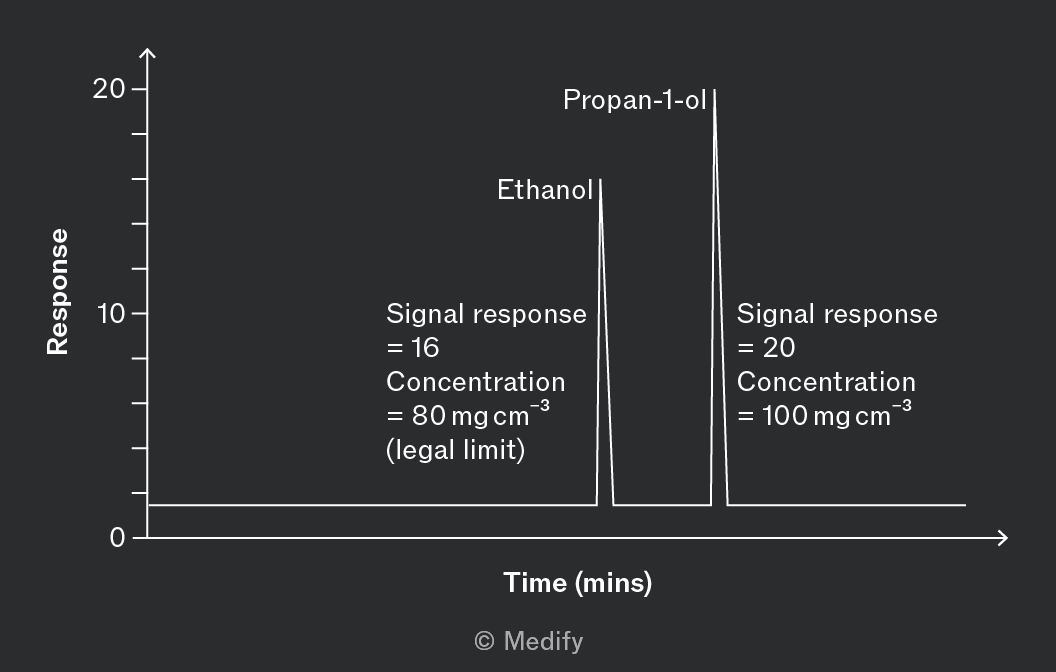
In forensic analysis, a known concentration or quantity of a similar substance, the internal standard, is added to a sample of a substance of unknown concentration.
By measuring the relative signal response the unknown quantity can be calculated.
A known concentration of propan-1-ol is added to a sample of blood or breath when assessing alcohol levels.
By comparing the relative peak area to propan-1-ol, the concentration of blood ethanol can be measured accurately.
A simple time of flight (TOF) mass spectrometer is used to identify the mass of ions.
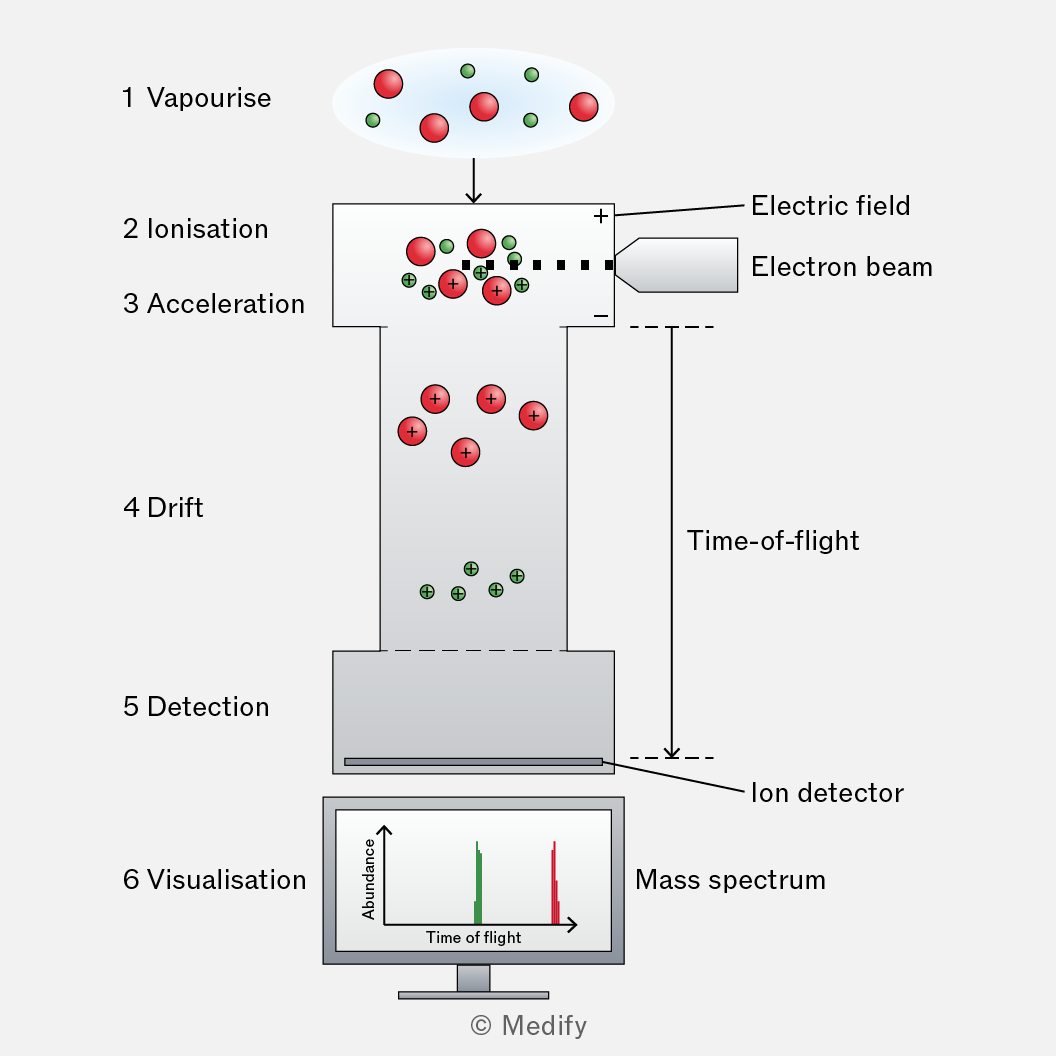
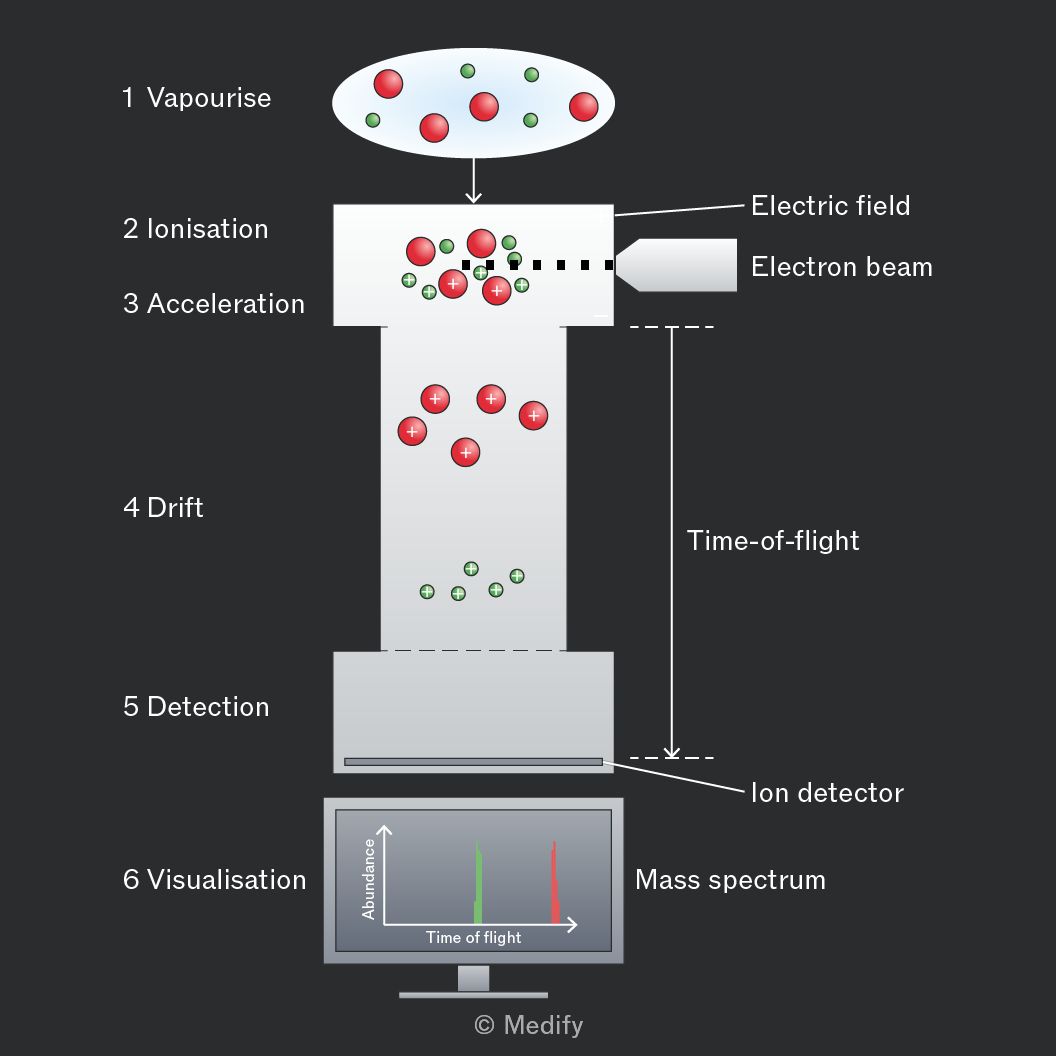
- A sample is vapourised.
- The vapourised sample is bombarded with high speed electrons that knock out an electron in the molecule, causing its ionisation.
- An electric field is applied, which accelerates each ion toward a drift tube.
- The ions all drift with the same kinetic energy, but their velocities differ depending on their mass-to-charge ratios (m/z). Ions with a smaller m/z travel faster and reach the detector first.
- The mass spectrometer detects the ions’ time of flight.
- An electric current proportional to the relative abundance of ions in the beam produces a peak on the mass spectrum at the time it was detected.
The raw data for a mass spectrum is the signal intensity paired with the time of flight.
The data is processed using information from calibration.
Signal intensity can be converted to relative abundance. This sits on the axis.
The conversion is not always normalised, (made so the peaks sum to ), so it is important to check.
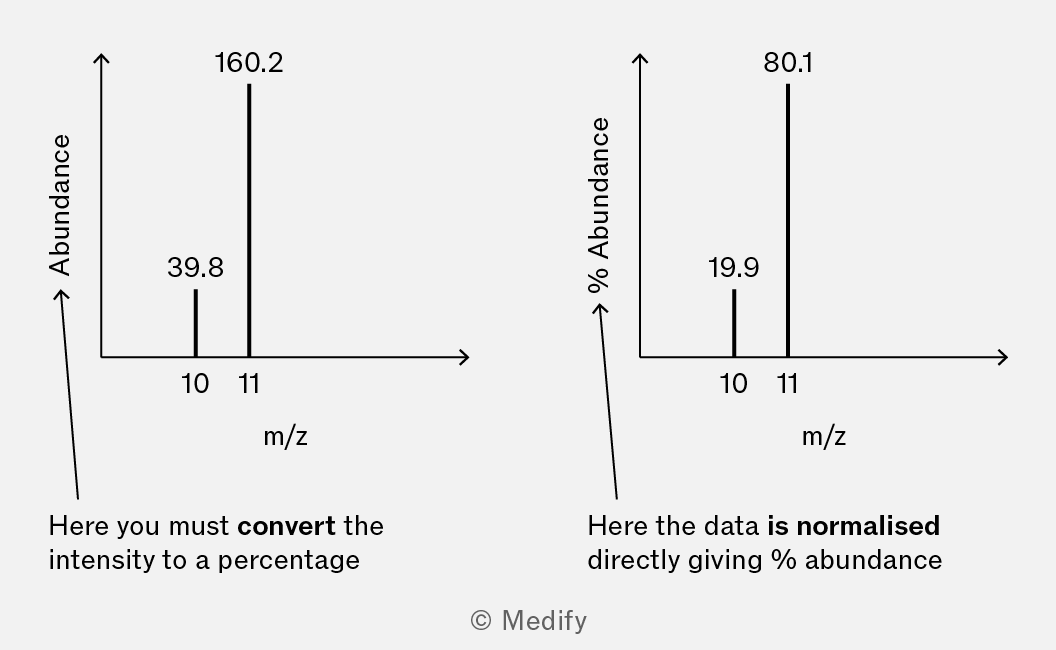
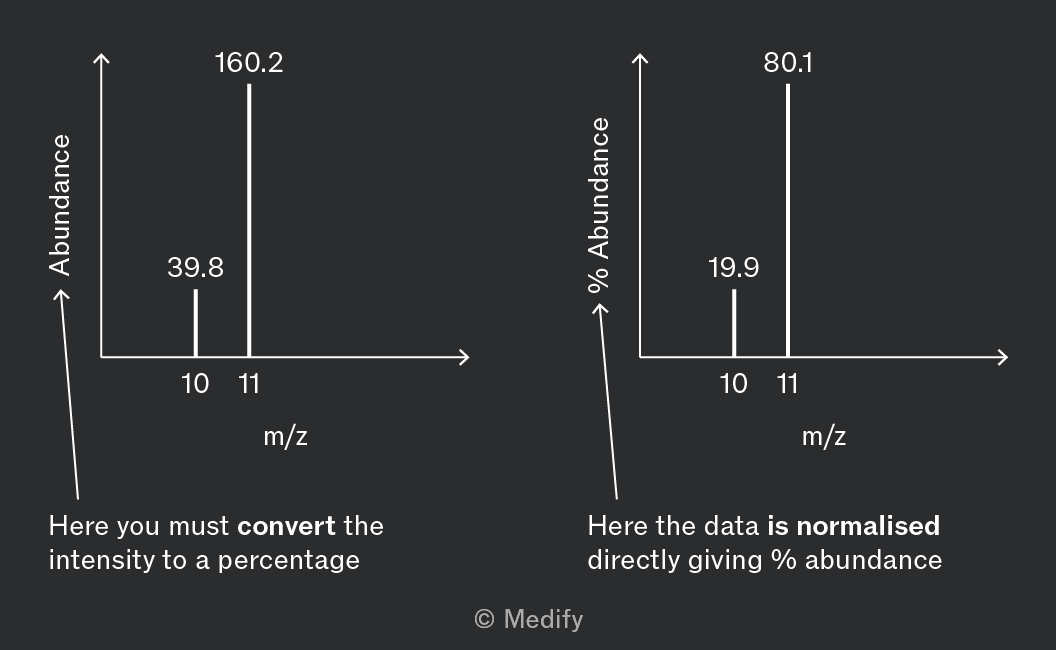
Time of flight is converted to mass to charge ratio (m/z). This sits on the axis.
Organic molecules in a mass spectrometer are vapourised then undergo ionisation, with the loss of an electron from one of the covalent bonds.
This can be represented as:
is the molecular ion, it represents the whole molecule minus one electron.
The singly charged molecular ion peak, , has an m/z equal to the molecule’s relative molecular mass ().
The molecular ion peak has the highest m/z value and is located on the far right of the mass spectrum.
Relative atomic mass, Ar, is the average weighted mass of the isotopes that comprise an element.
Mass spectrometry produces signals linked to the exact molecule detected. The signal is related to the actual mass of the isotopes present and not the relative atomic mass.
Mass spectra of organic molecules will exhibit a tiny peak at 1 mass unit greater than the molecular ion.
This is called the M+1 peak and is caused by the presence of the carbon-13 isotope which comprises of all carbon atoms.
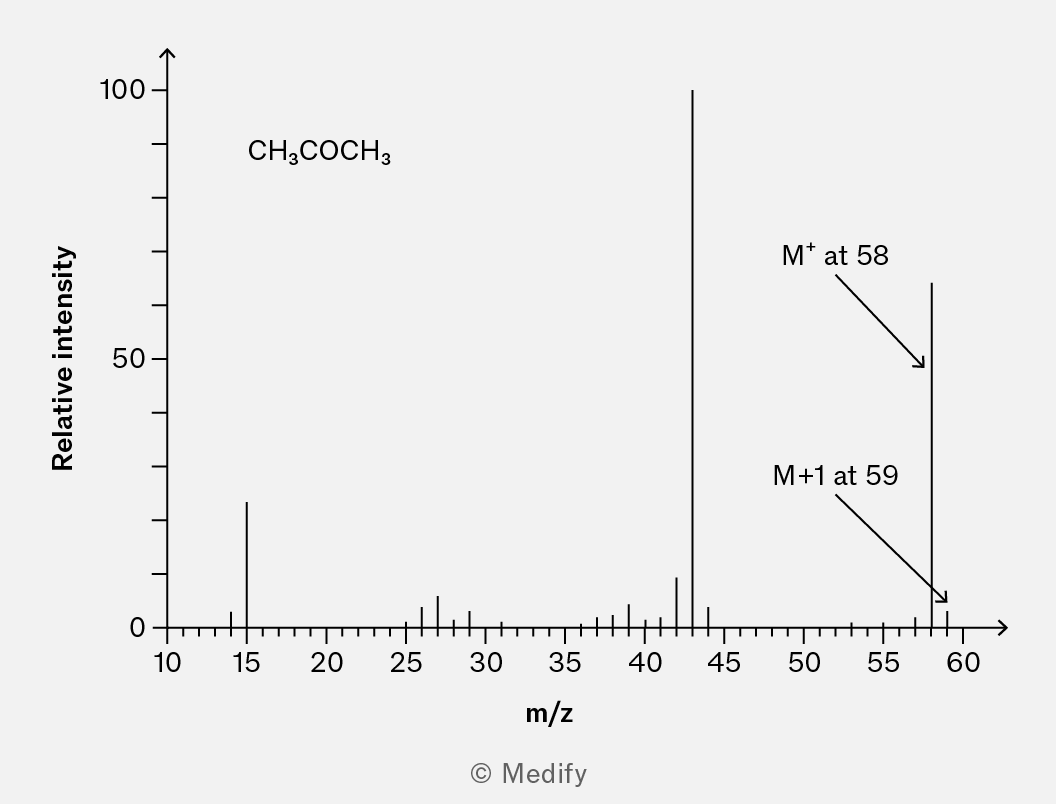
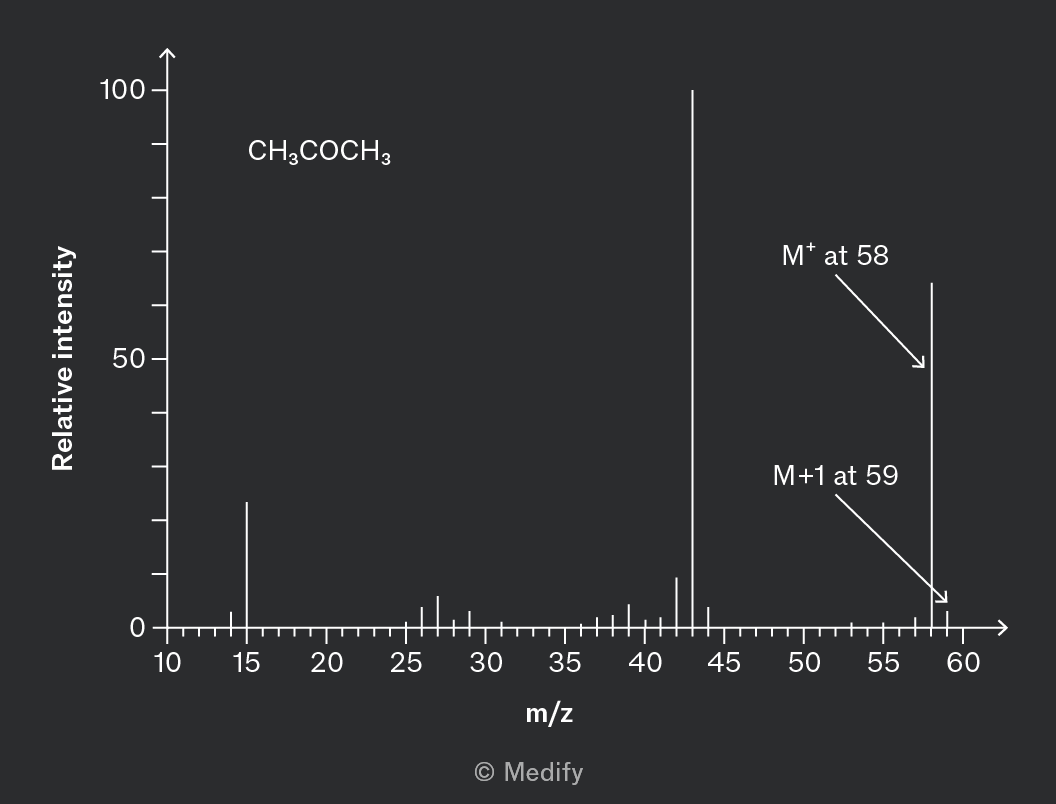
The of propanone, , is 58.
In the spectrum of propanone, the molecular ion peak, , is at 58 and a smaller M+1 peak at 59 shows the proportion of propanone featuring carbon-13.
Molecular ions formed during ionisation are positively charged radicals and are generally unstable.
They split to form a radical and a cation; this is called fragmentation.
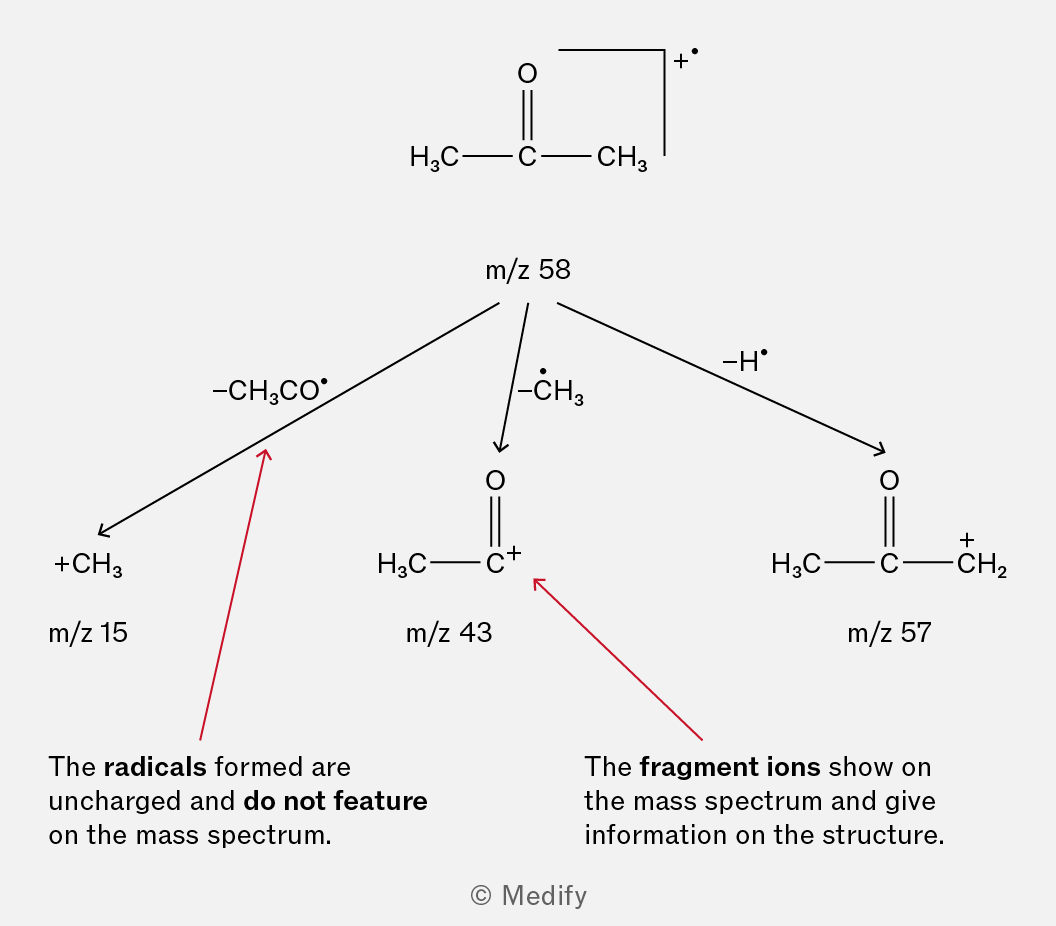
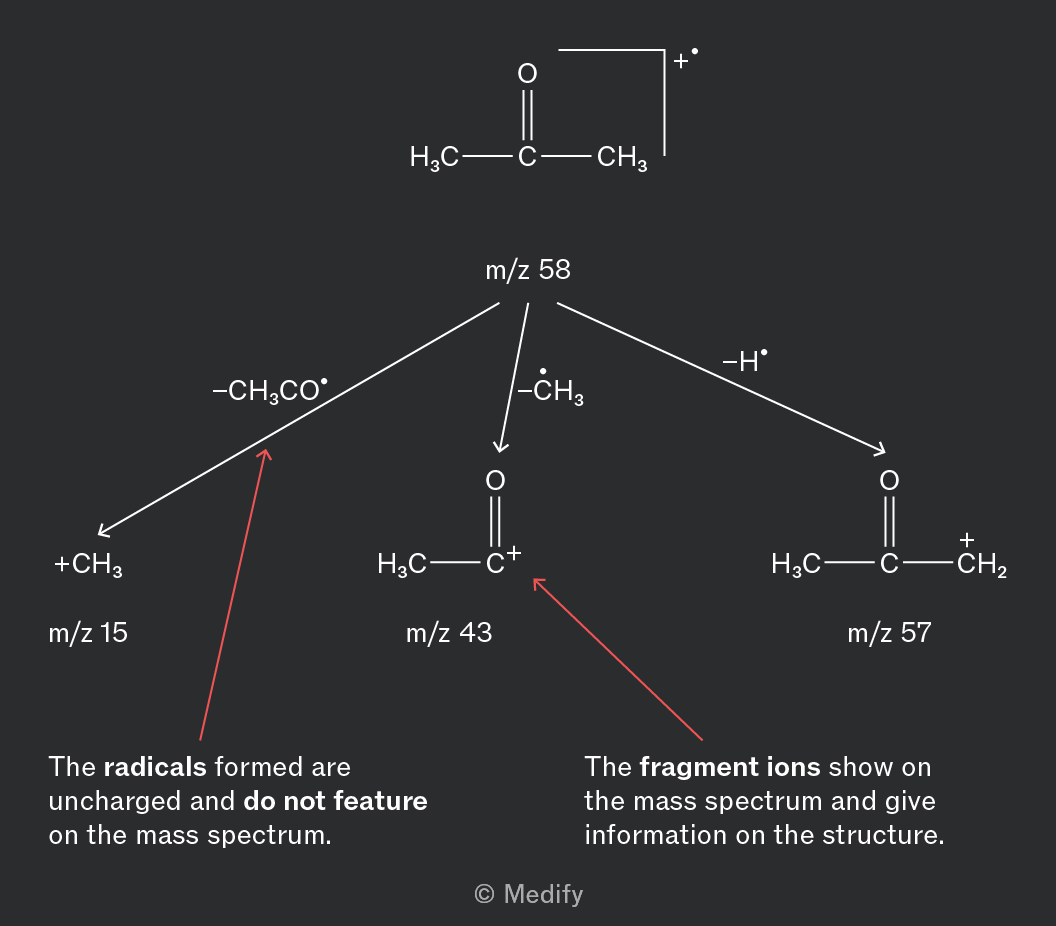
The cationic molecular fragment ions can be seen in the mass spectrum.
All fragment ions will have lower molar mass than the molecular ion, .
Some fragment ions may be formed more frequently.
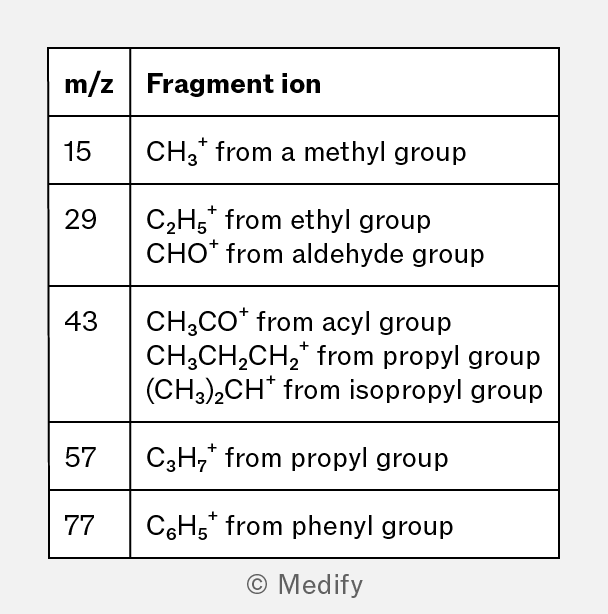
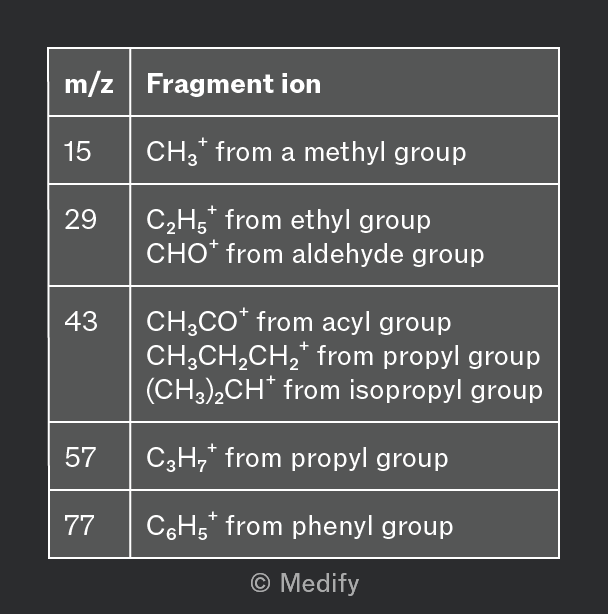
m/z 29 and m/z 43 are commonly used in exams due to the variety of fragments they can be associated with.
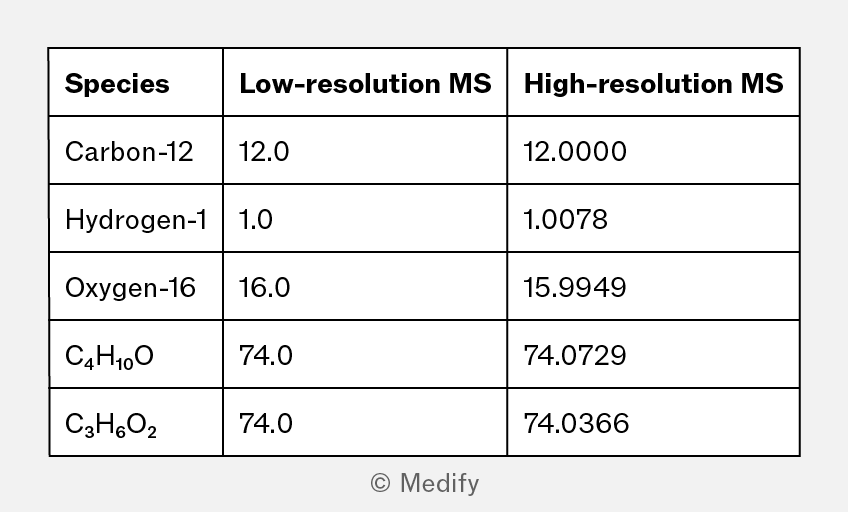
High-resolution mass spectrometers can resolve signals to 4 d.p.
When the mass to charge ratio (m/z) of a molecular ion is recorded to 4 d.p., it can be positively identified by comparison to a reference database to give a molecular formula.
The molecular ion peak, , represents the relative formula mass () of the whole molecule.
High-resolution mass spectrometry (HRMS) can measure this peak to a high degree of precision, such as four or more decimal places, providing an exact mass.
By comparing the exact recorded mass to the sum of the masses of the constituent atoms, chemists can calculate the possible combinations of atoms that could make up the molecule. This gives the molecular formula.
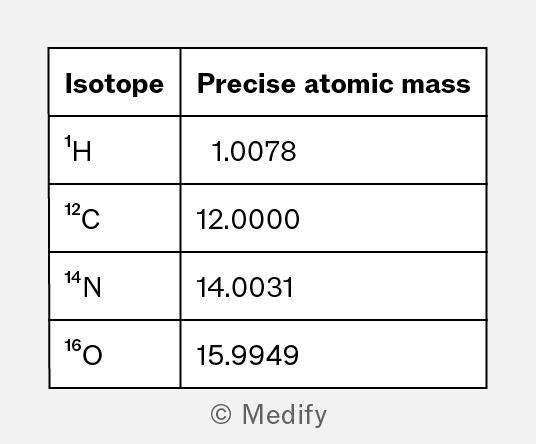
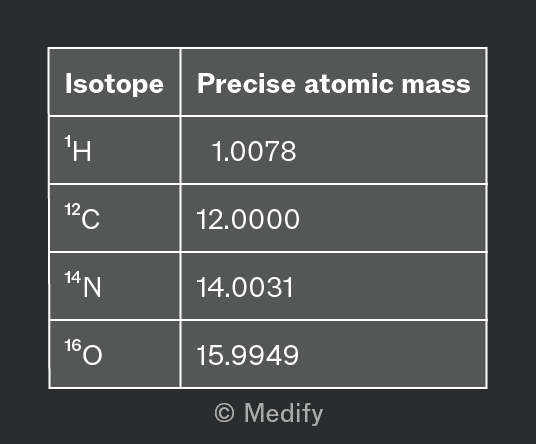
Propane () and ethanal () have the same relative formula mass to the nearest whole number, 44.
On a high-resolution mass spectrum the molecules are distinguishable by the peak; gives a molecular ion peak at m/z = 44.0624 while gives a molecular ion peak at m/z = 44.0261.
In low-resolution mass spectrometry, and would both show molecular ion peaks at 74.
The molecular formula cannot be deduced from the molecular ion peak.
In high-resolution mass spectroscopy, the combined relative isotopic masses, correct to 4 d.p., of each molecule are detected. These more precise values can differentiate between the molecular formulas.