Practical chemistry for exams›RP2 - Measurement of an enthalpy change

RP2 - Measurement of an enthalpy change

An overview of RP2 - Measurement of an enthalpy change
4 min

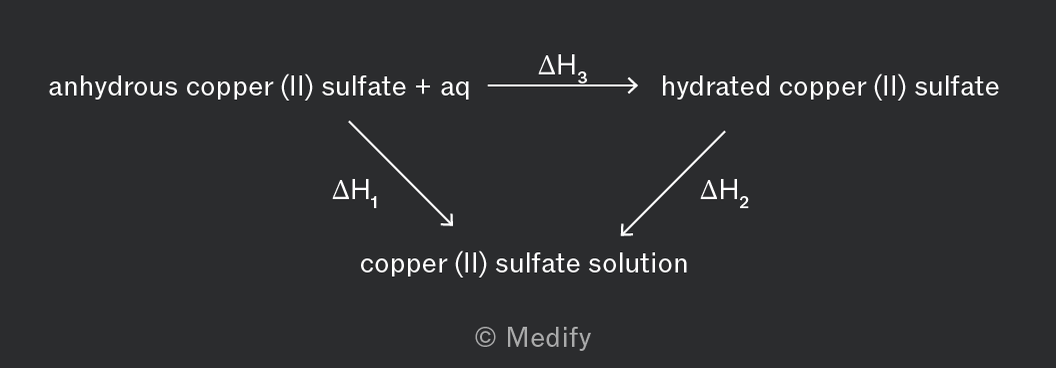
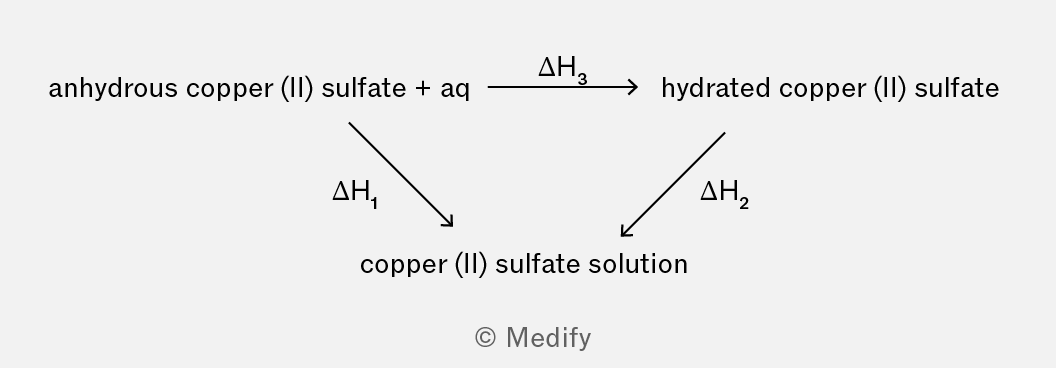
In Required Practical 2: Measurement of an enthalpy change for AQA, you will use an experiment to determine the enthalpy change for the hydration of anhydrous copper(II) sulfate* to hydrated copper(II) sulfate, which cannot be measured directly.

This is achieved using Hess’s law by calculating ​ (dissolution of anhydrous copper(II) sulfate) and ​(dissolution of hydrated copper(II) sulfate).
A diagram illustrating the hydration process of copper (II) sulfate. It shows the conversion of anhydrous copper (II) sulfate and water (aq) to hydrated copper (II) sulfate, with arrows indicating the enthalpy changes (ΔH1, ΔH2, ΔH3) involved in the reactions.
Add to favourites

In Required Practical 2: Measurement of an enthalpy change, as outlined by AQA, there are several important safety requirements to be aware of (beyond normal lab practice such as wearing goggles).

  • Avoid skin contact with both anhydrous and hydrated copper(II) sulfate, as they are classified as irritants. If contact occurs, rinse immediately with plenty of water.
  • Since a fairly large amount of copper(II) sulfate is used and it is classified as an environmental hazard, solutions should be collected, filtered, and allowed to evaporate so that copper(II) sulfate can be recycled.
Add to favourites

Experimental method for AQA required practical 2: Measurement of an enthalpy change

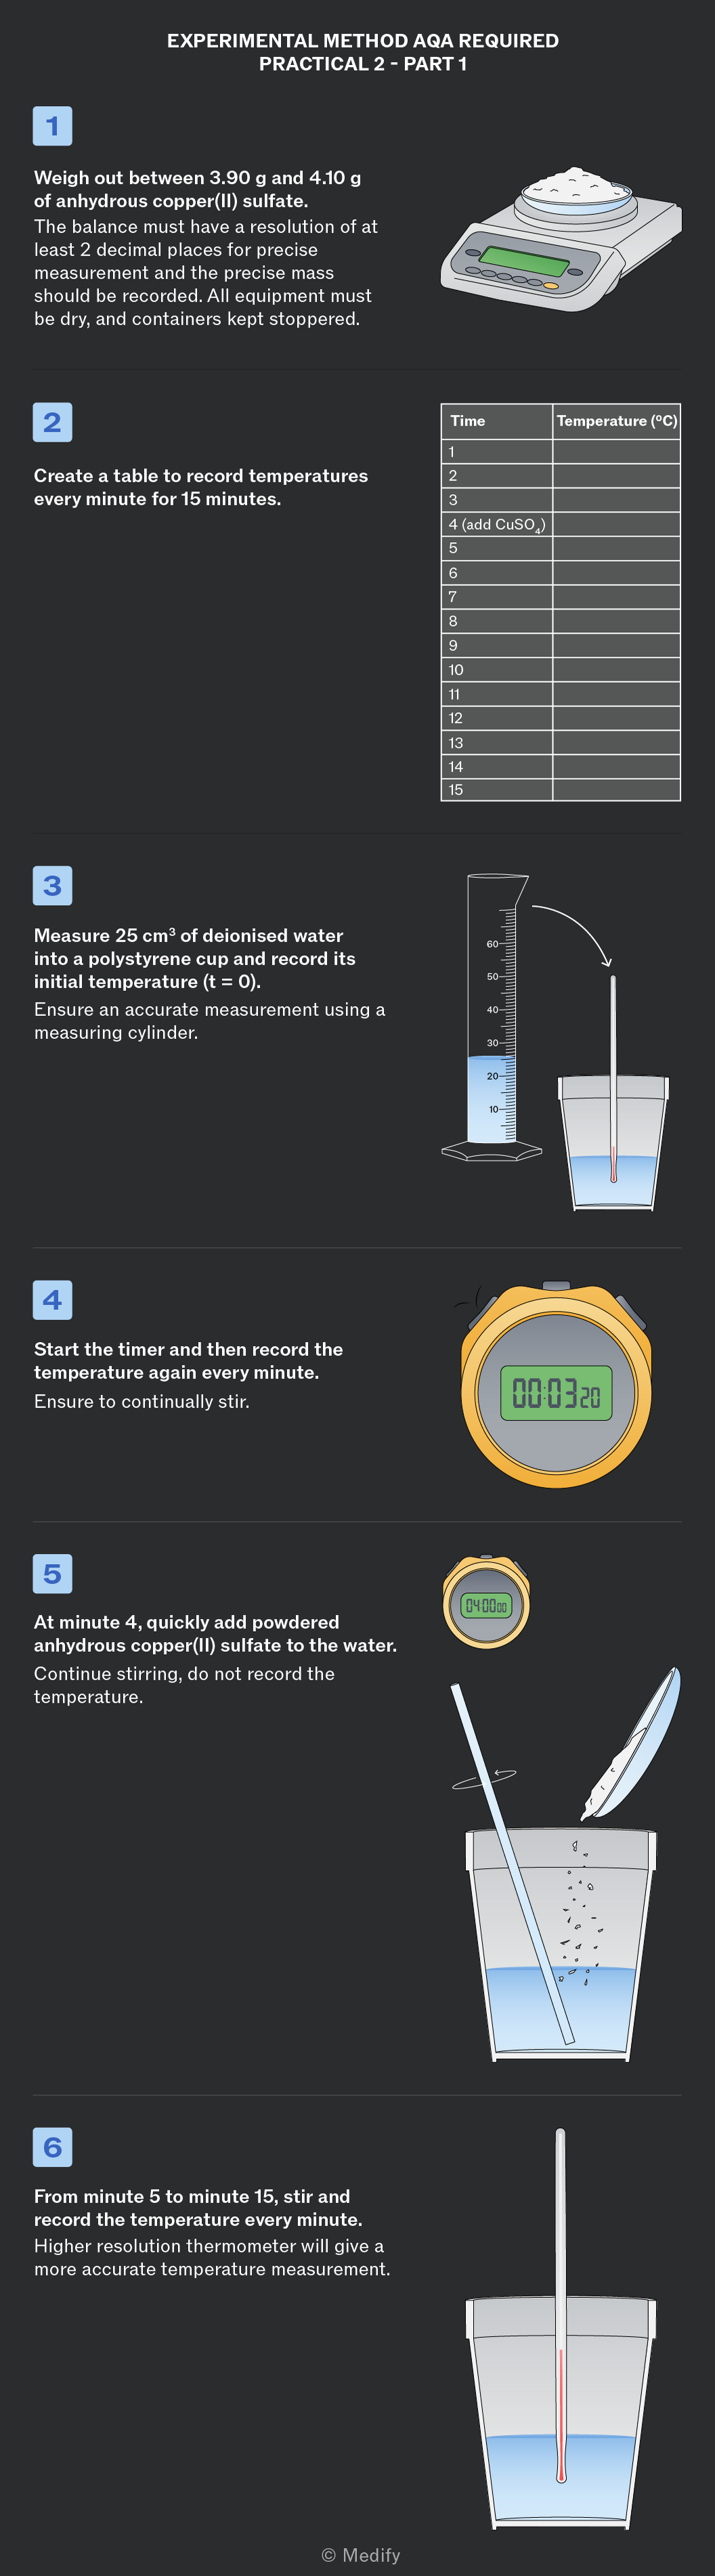
Part 1: Finding the enthalpy change for anhydrous copper (II) sulfate
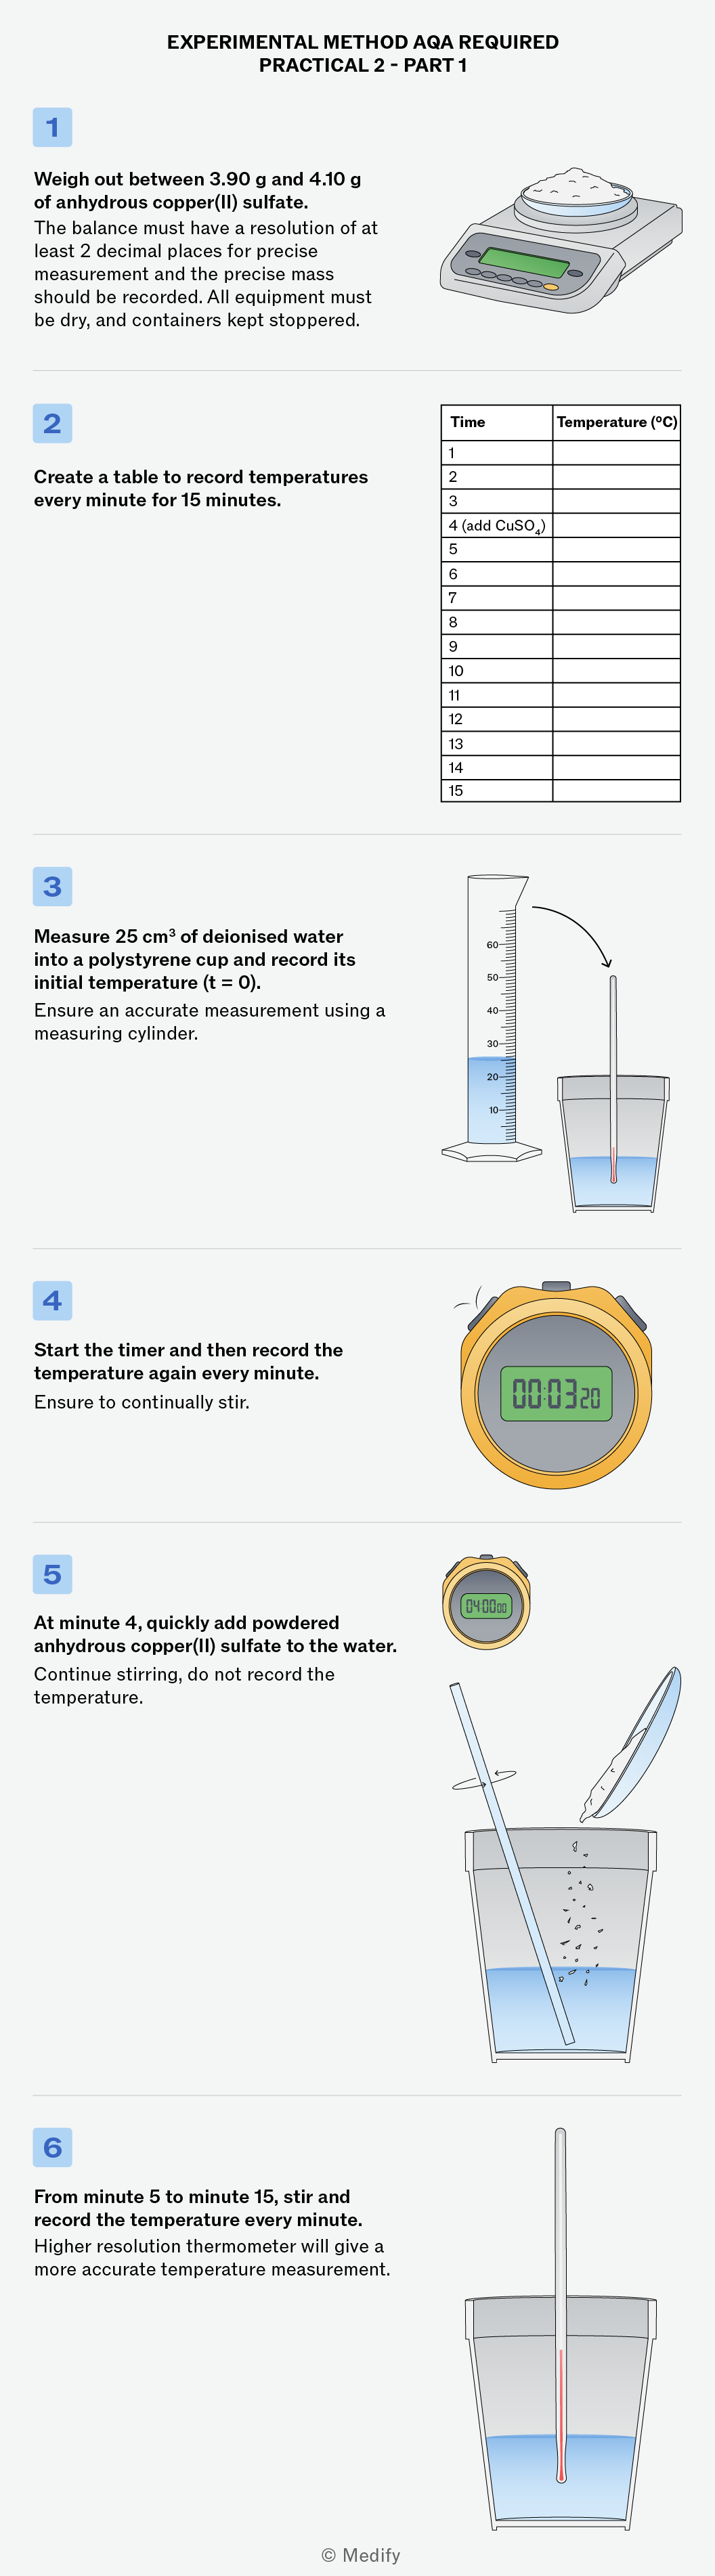
An instructional infographic detailing the method for collecting data to determine the enthalpy change (ΔH1) in a chemistry experiment. The steps include weighing anhydrous copper(II) sulfate, measuring deionised water, recording temperatures at specified intervals, and adding the copper sulfate to the water while stirring. A table for recording temperature data is also included.
Add to favourites

Experimental method for AQA required practical 2: Measurement of an enthalpy change

Part 2: Finding the enthalpy change for hydrated copper (II) sulfate
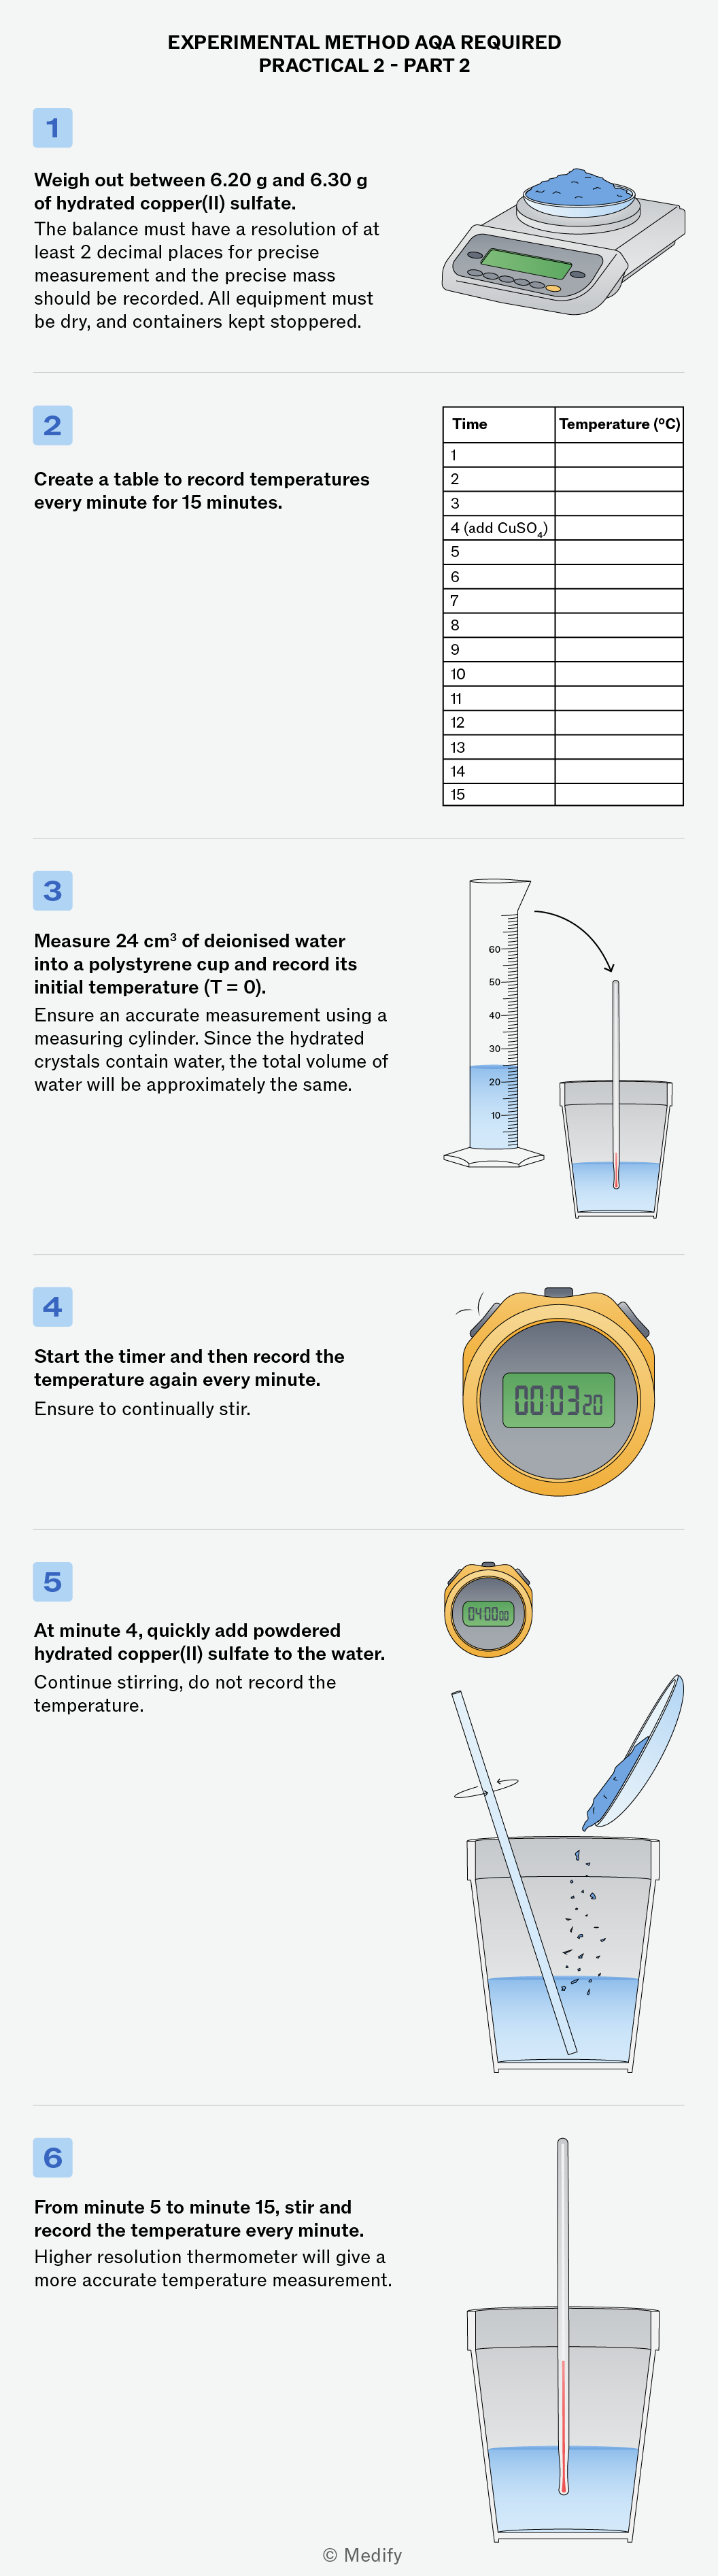
An instructional infographic detailing the experimental method for measuring temperature changes when adding hydrated copper(II) sulfate to deionized water. The steps include weighing the copper sulfate, creating a temperature recording table, measuring water, and recording temperature changes over time with illustrations of the equipment used.
Add to favourites

The precision of the balance used is critical for ensuring the accuracy of mass measurements and subsequent calculations.
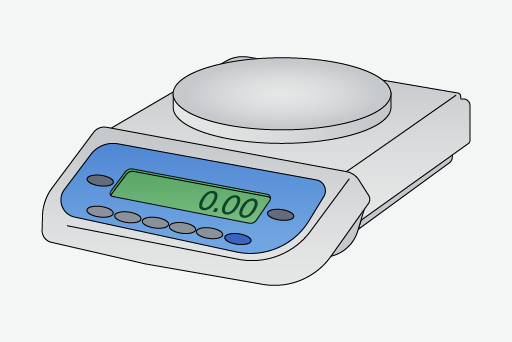
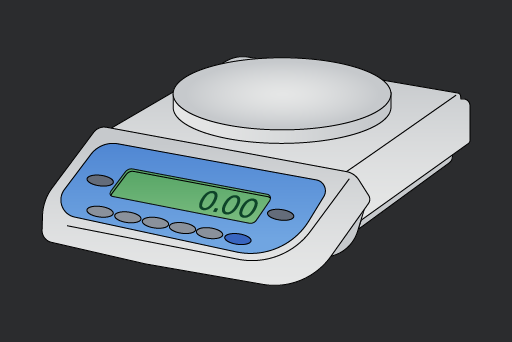
A digital laboratory scale with a circular weighing platform and a blue control panel displaying a reading of 0.00.
Do

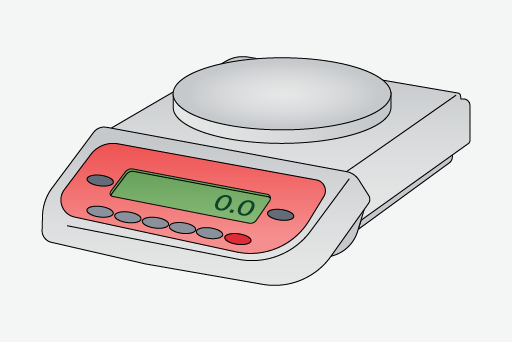
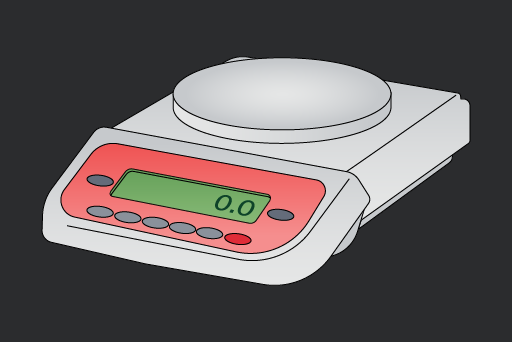
Measure solids and liquids precisely. Ensures accurate mole calculations and enthalpy values. A balance with a resolution of at least two decimal places should be used.

A digital weighing scale with a round platform and a red control panel displaying '0.0' on a green screen.
Don't

Use a balance with a resolution of 1 decimal place or lower.

Add to favourites

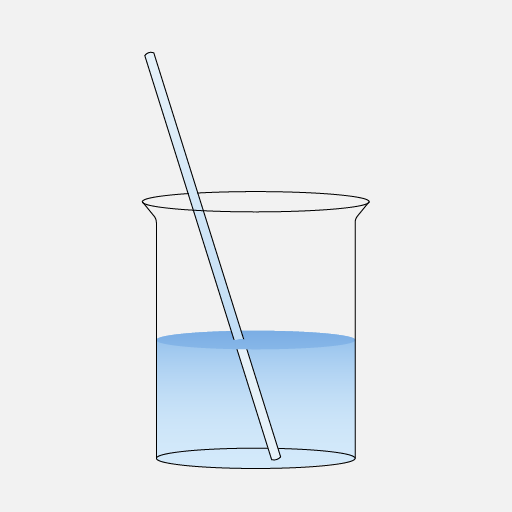
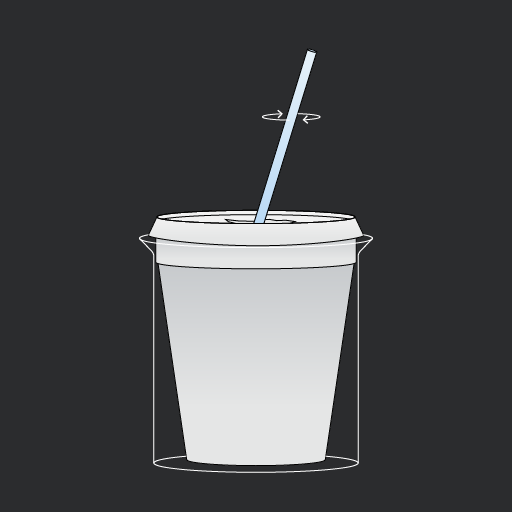
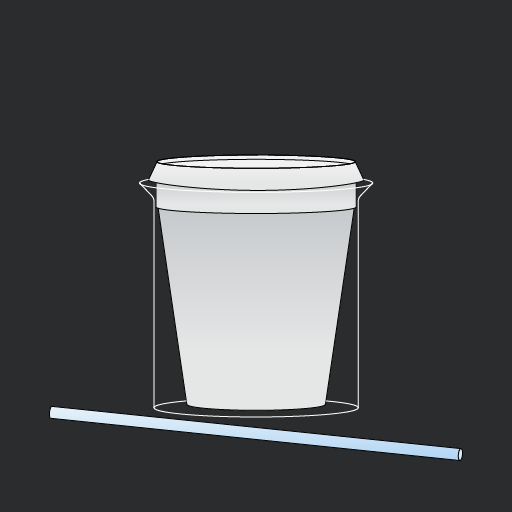
The use of a lid and polystyrene cup is critical for minimising heat loss to the surroundings and ensuring accurate temperature measurements.
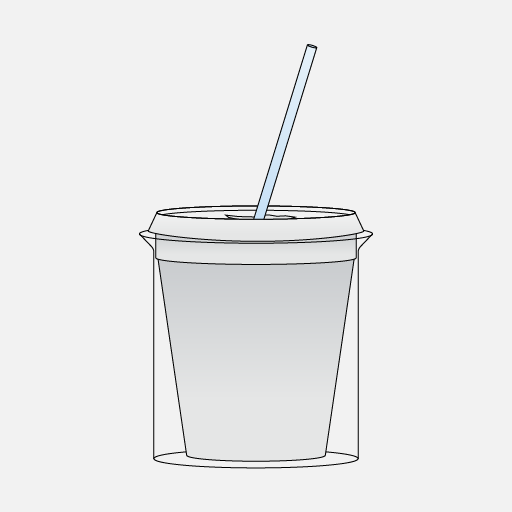

A simple illustration of a disposable cup with a straw, featuring a light blue straw protruding from the top.
Do

Use a lid and a polystyrene cup. Minimises heat loss to surroundings.

A clear beaker filled with blue liquid, with a stirring rod positioned inside.
Don't

Use a glass beaker and leave the calorimeter uncovered.
This will result in excessive heat loss to the surroundings and inaccurate temperature measurements.

Add to favourites

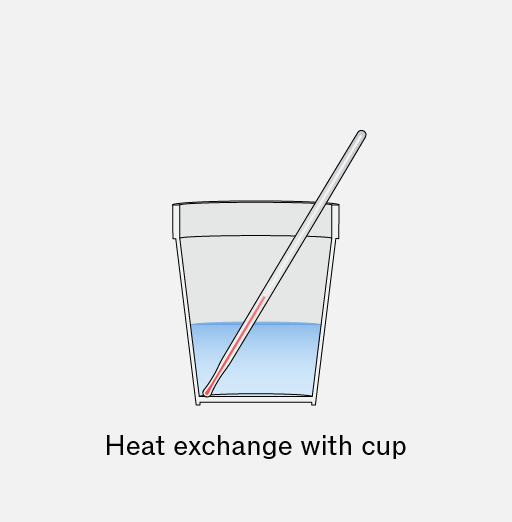
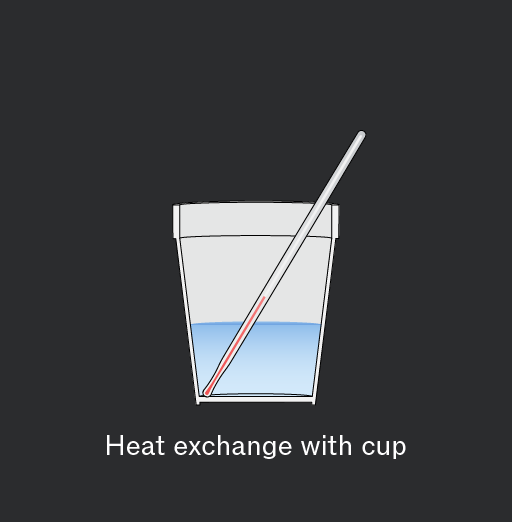
The position of the thermometer in the calorimeter is critical for ensuring accuracy of results.
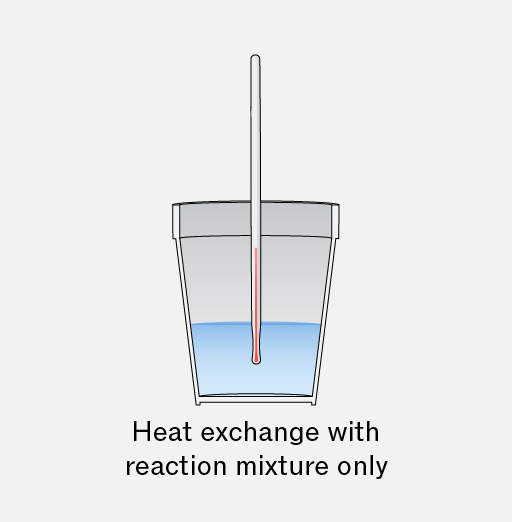
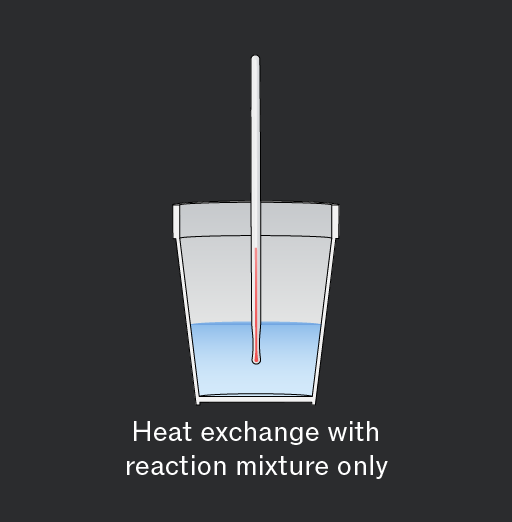
Illustration of a beaker containing a blue liquid with a thermometer inserted, indicating heat exchange with the reaction mixture only.
Do

Position your thermometer so the bulb is fully covered and away from the container walls.

Illustration of a cup with water and a thermometer, demonstrating heat exchange. The thermometer is partially submerged in the blue water, indicating a measurement of temperature.
Don't

Don’t allow the bulb of the thermometer to make contact with the bottom of the container. This will lead to heat transfer with the container by conduction, which will alter the reading and therefore reduce accuracy of your results.

Add to favourites

Stirring continuously is critical for ensuring even heat distribution and obtaining precise temperature readings.
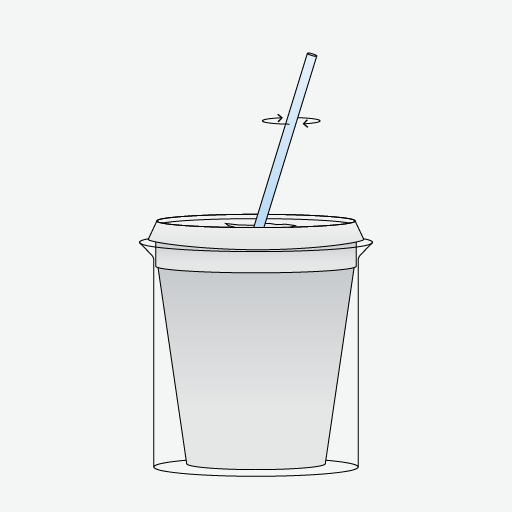
A simple illustration of a disposable cup with a straw inserted, showing a gradient fill from light to dark.
Do

Stir continuously.
Distributes heat evenly for consistent temperature readings.

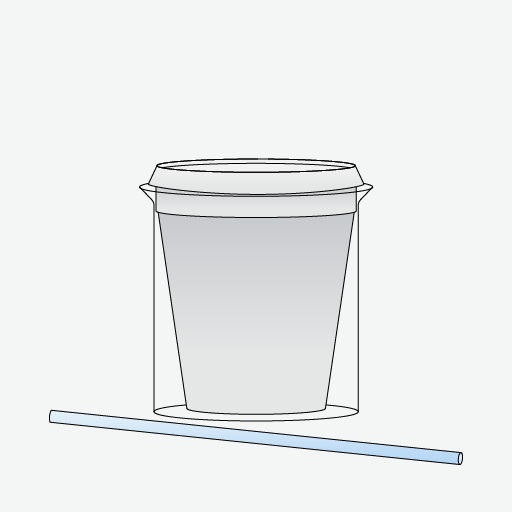
A simple illustration of a disposable cup with a lid, placed next to a light blue straw.
Don't

Stir inconsistently or stop stirring.
Leads to uneven temperature distribution and inaccurate temperature measurements.

Add to favourites

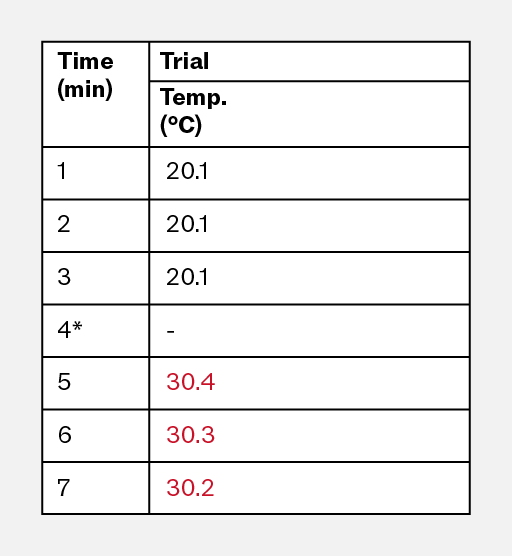
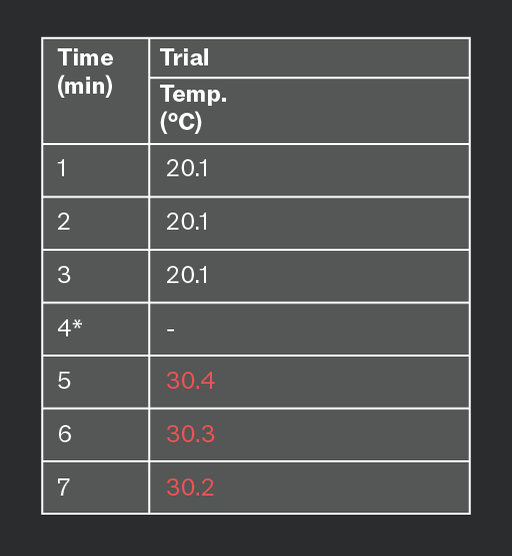
Repeating measurements is essential for improving the reliability of results, as it helps to reduce the impact of random errors and identify anomalies.
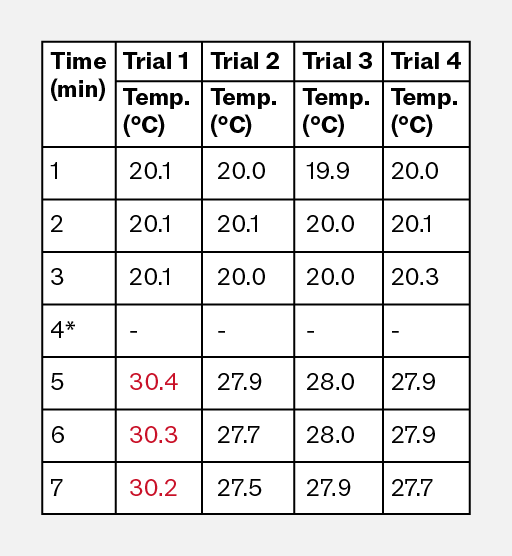
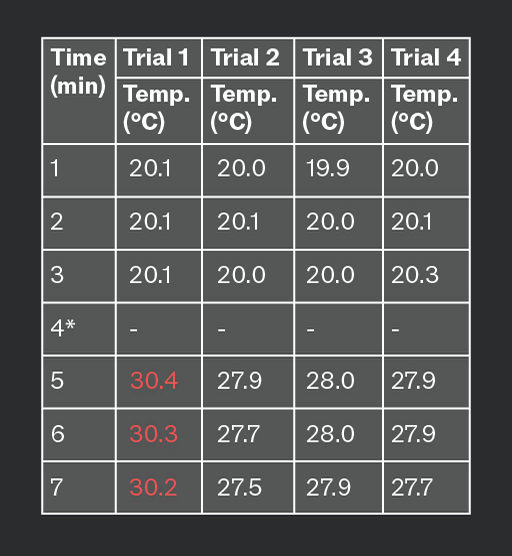
A table displaying temperature readings over time for four trials. The first three trials show consistent temperatures around 20°C for the first three minutes, with a gap in data for trial 4 at minute 4. From minute 5 to 7, temperatures in trials 1 to 4 vary, with trial 1 reaching a maximum of 30.4°C at minute 5.
Do

Repeat measurements and calculate the mean.
Improves reliability and reduces the impact of random errors and highlights values to exclude.

A table displaying temperature readings over time in a trial. The first three time points (1, 2, and 3 minutes) show a consistent temperature of 20.1°C. The fourth time point is marked with a dash, indicating no data. Subsequent readings at 5, 6, and 7 minutes show temperatures of 30.4°C, 30.3°C, and 30.2°C, respectively.
Don't

Rely on a single measurement. Increases the risk of anomalies affecting the accuracy of results. Results due to a systematic error will not be spotted.

Add to favourites

To calculate the heat energy, , for and use the formula , where:

  • : mass of water (in g, equivalent to its volume in
  • : specific heat capacity of water ()
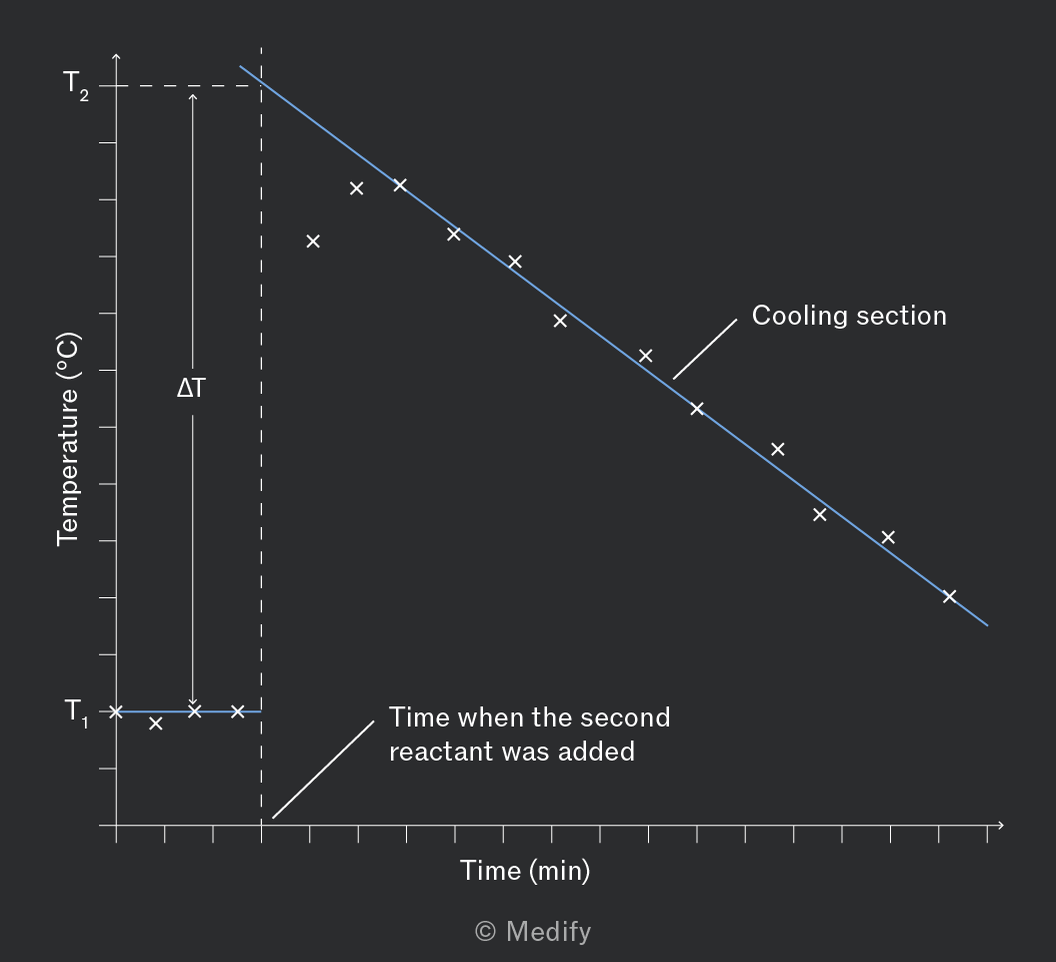
  • : temperature change – which is calculated by constructing a graph of temperature against time, see the example graph below.
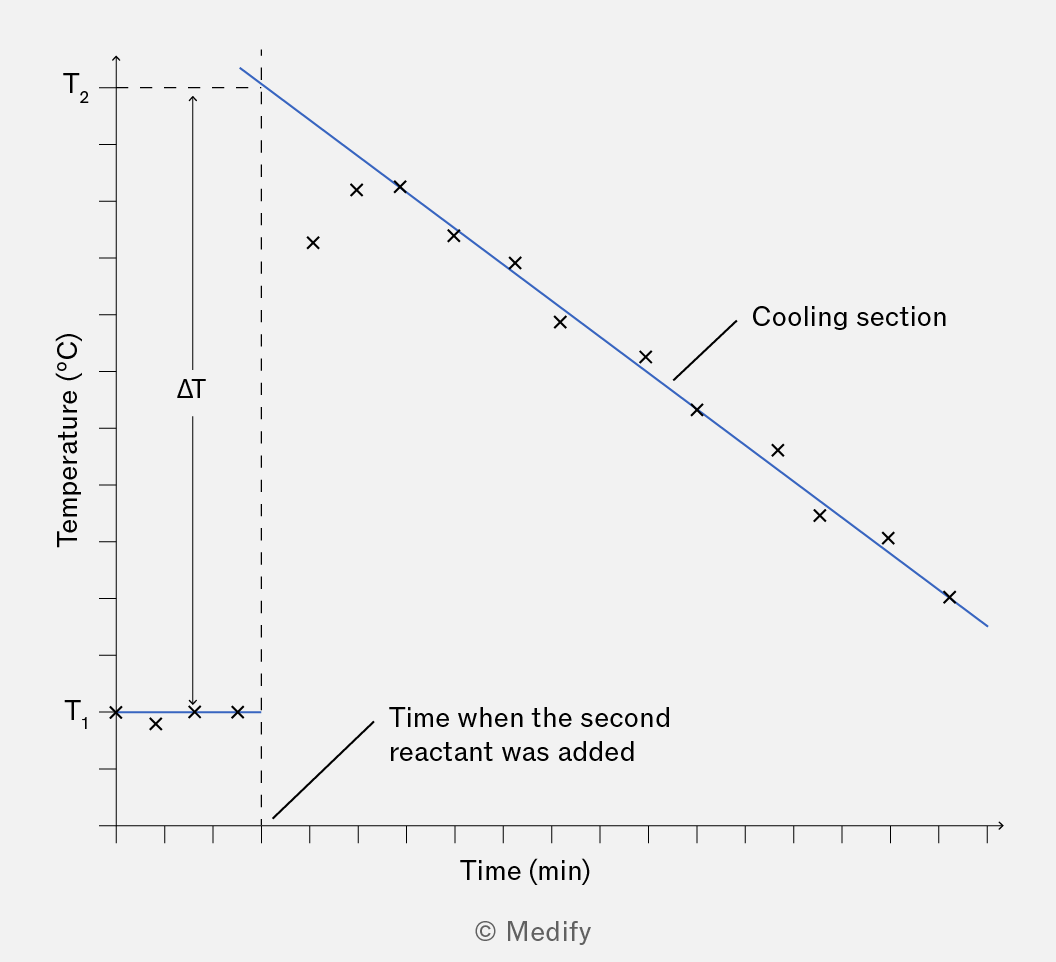
A graph showing temperature (°C) on the vertical axis and time (min) on the horizontal axis. The graph features a cooling section represented by a downward sloping line with data points marked as crosses. The temperature changes from T1 to T2, with a labeled difference ΔT. An annotation indicates the time when the second reactant was added.

Note how the gradient in the cooling section is extrapolated back to the point where the second reactant is added to give .

Add to favourites

To calculate the enthalpy change of and :

First, convert heat energy, , from Joules to kiloJoules by dividing by 1000.

The moles of anhydrous and hydrated copper sulfate used in experiment 1 and 2 should be calculated using:

The enthalpy change, ​ and , can then be calculated using:

A diagram illustrating the chemical reaction between anhydrous copper (II) sulfate and water to form hydrated copper (II) sulfate. The diagram includes enthalpy changes labeled as ΔH1, ΔH2, and ΔH3, with arrows indicating the direction of the reaction and the formation of a copper (II) sulfate solution.

Hess’s law can then be used to calculate ​:

Add to favourites