RP3 - Investigation of how the rate of reaction changes with temperature
On this page
In Required Practical 3: Investigation of how the rate of reaction changes with temperature, you will investigate how the rate of a reaction varies with temperature by measuring the time taken for a precipitate to form in the reaction between sodium thiosulfate and hydrochloric acid.
The reaction produces a sulfur precipitate that obscures a cross marked beneath the reaction vessel, allowing a simple visual determination of reaction completion.
In Required Practical 3: Investigation of how the rate of reaction changes with temperature, as outlined by AQA, there are several important safety requirements to be aware of (beyond normal lab practice such as wearing goggles).
- Sulfur dioxide production: * is an irritant and can trigger respiratory issues. Ensure good ventilation, and avoid prolonged exposure.
- Handling hydrochloric acid: Any spills should be rinsed immediately with water.
- Disposal: use a reaction stop bath containing sodium carbonate solution to neutralise excess acid and prevent the release of sulfur dioxide before disposal.
Experimental method for AQA Required practical 3: Investigation of how the rate of reaction changes with temperature
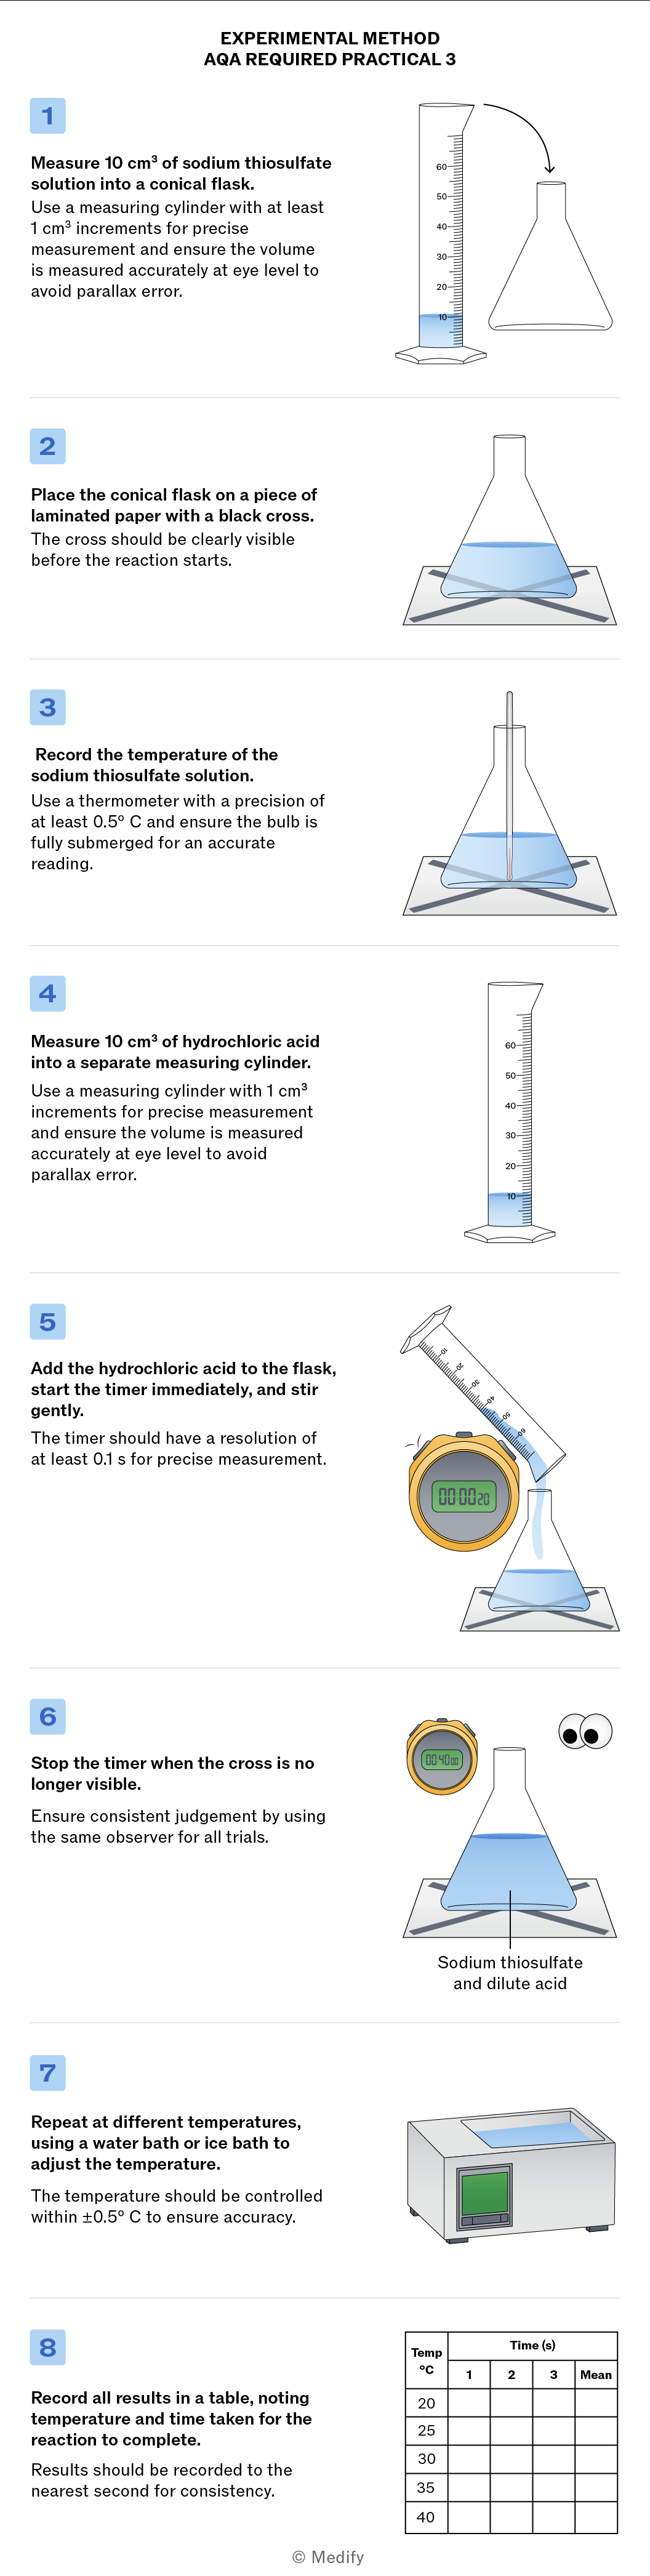
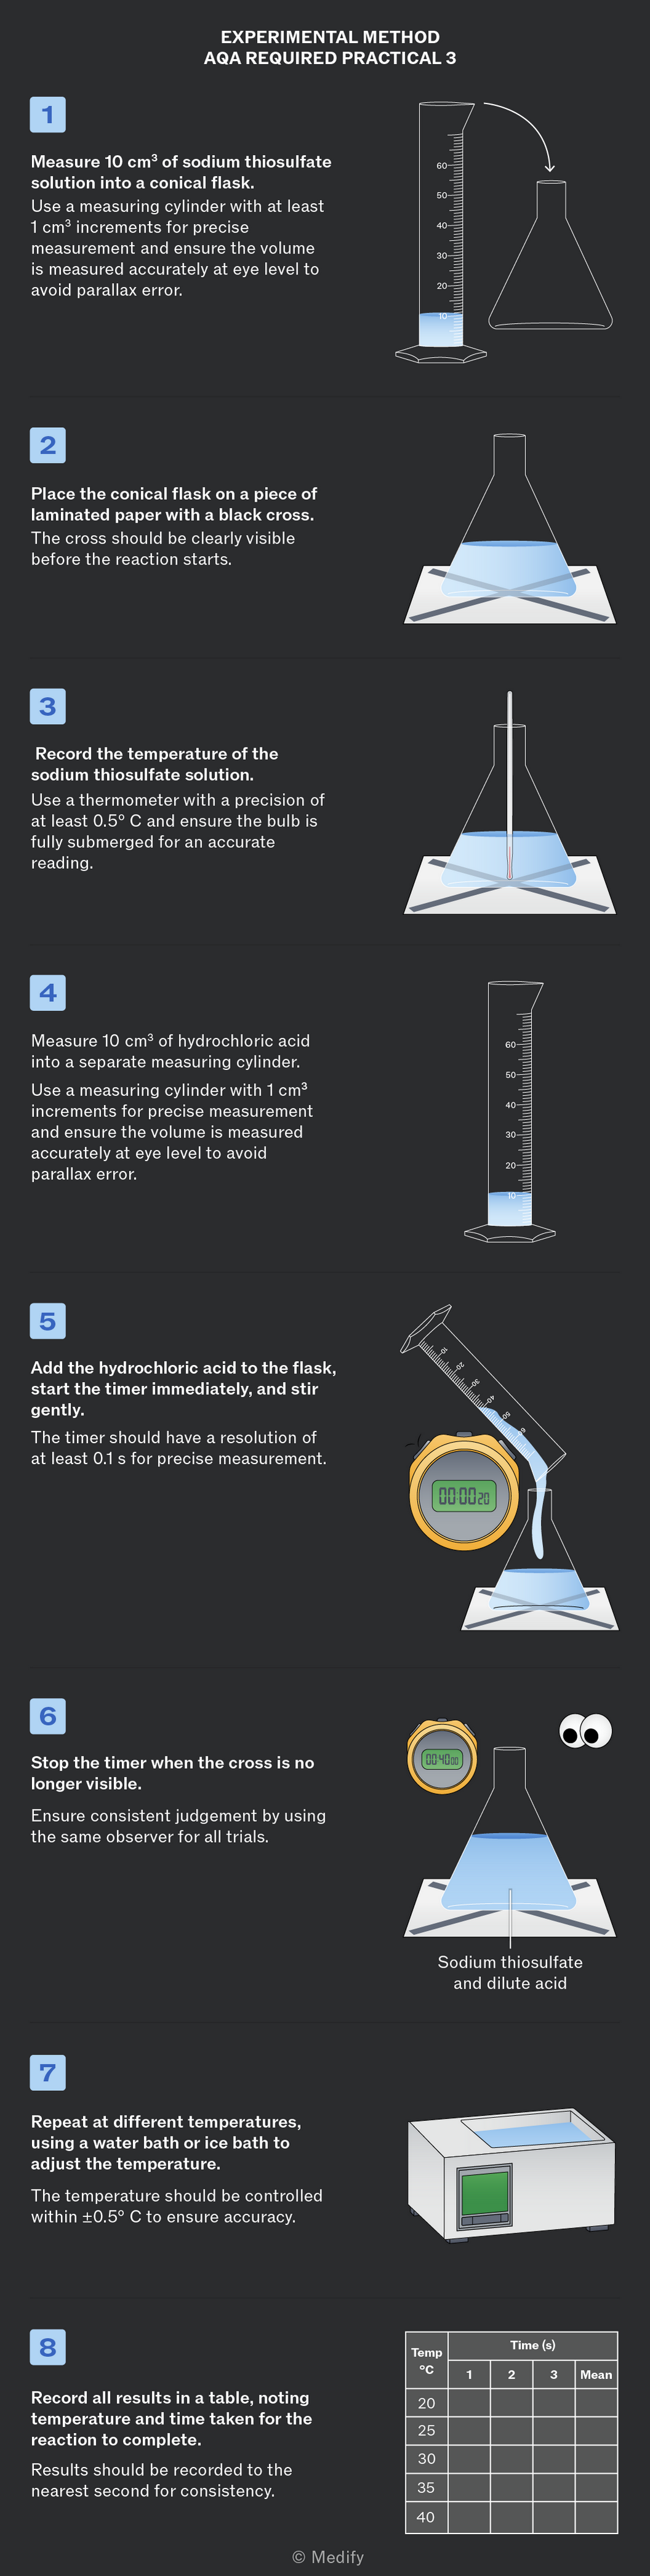
Misreading the volume of reactants used will impact your calculations.
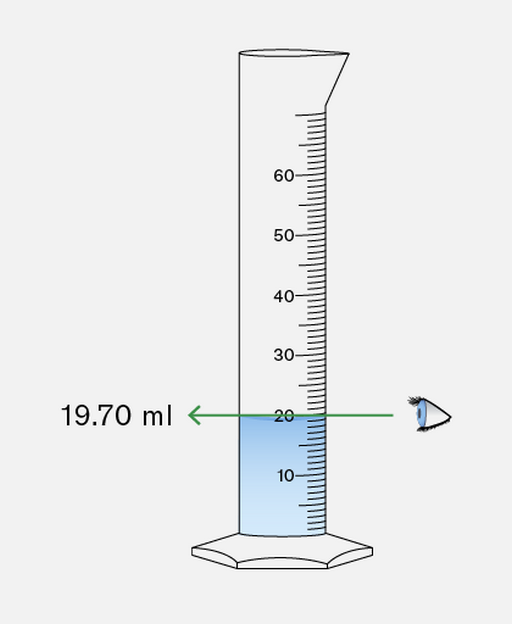
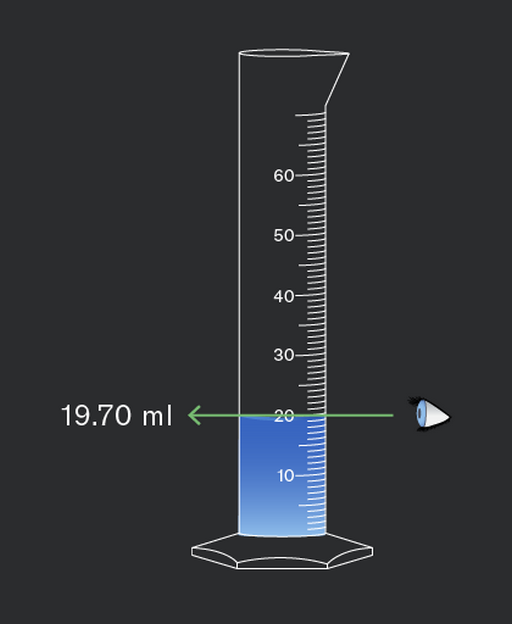
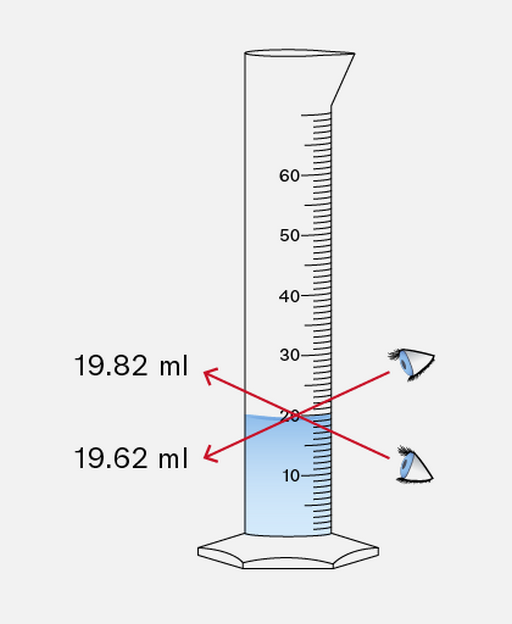
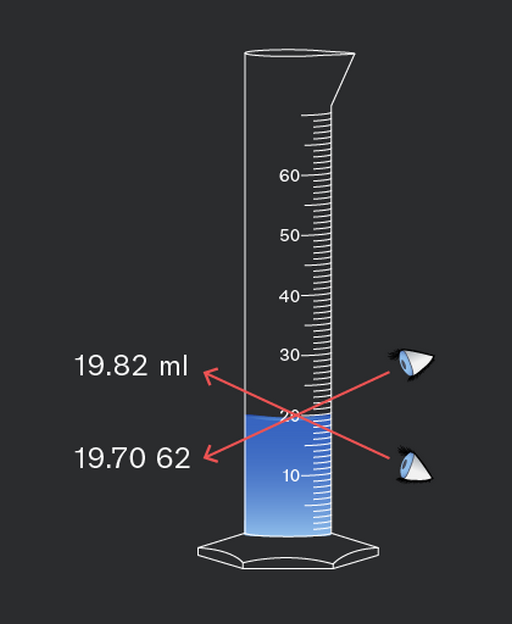
Your reaction endpoint depends on the cross’s consistent visibility.
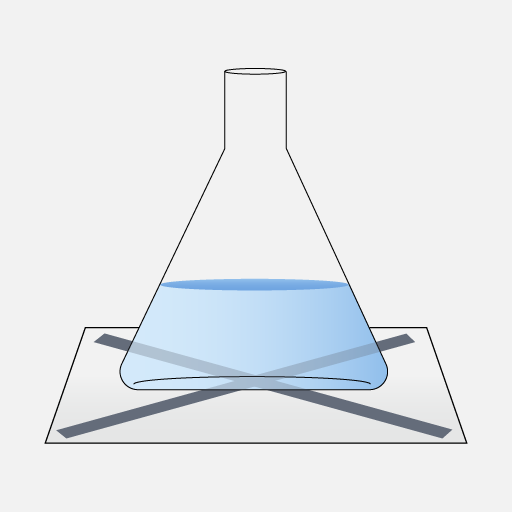

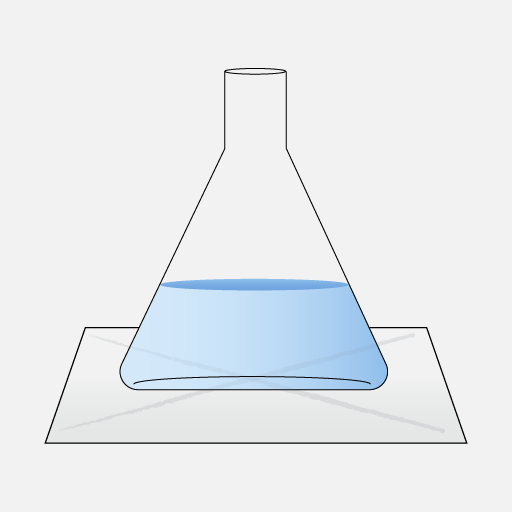

Repeating measurements is essential for improving the reliability of results, as it helps to reduce the impact of random errors and identify anomalies.
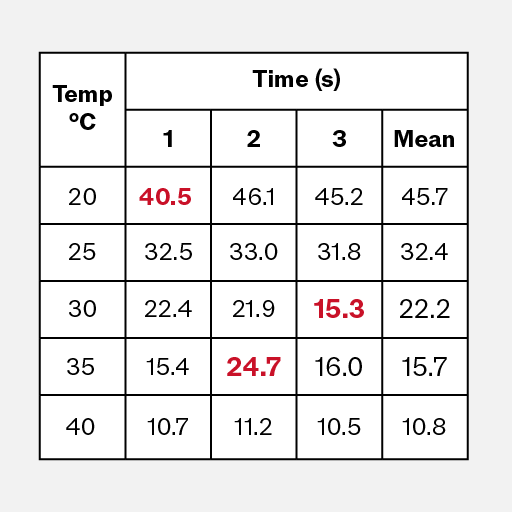
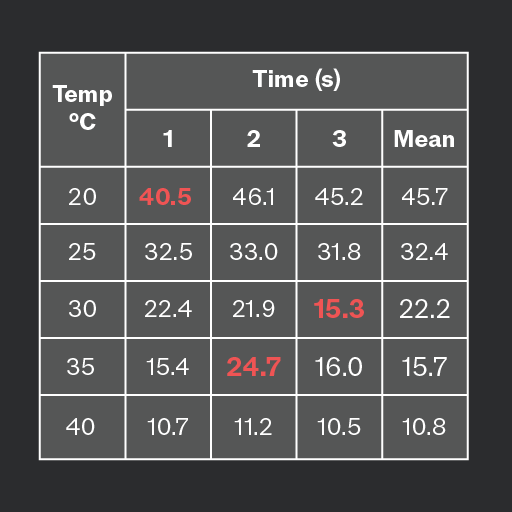
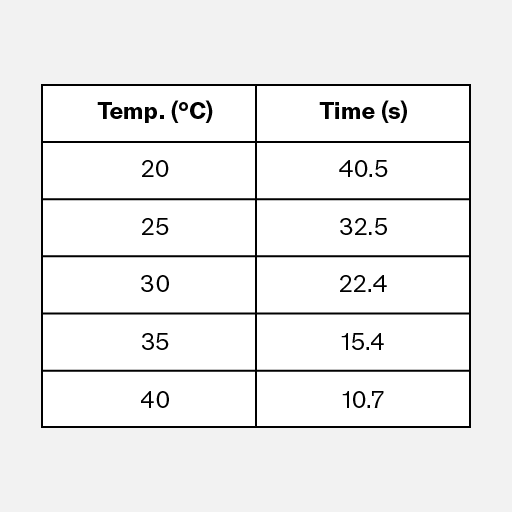
When analysing Required Practical 3: Investigation of how the rate of reaction changes with temperature, as outlined by AQA, calculate the mean time for the cross to disappear for each temperature used.
Exclude any anomalous results that are the result of systematic errors.
Then using the mean time calculated, rate of reaction at each temperature must be calculated.
The rate of reaction can be approximated using the formula:
This provides a relative measure of reaction speed. A shorter reaction time results in a higher rate. This inverse relationship allows for easy comparison between different temperatures without requiring direct concentration measurements.
Round the value of to 3 significant figures.
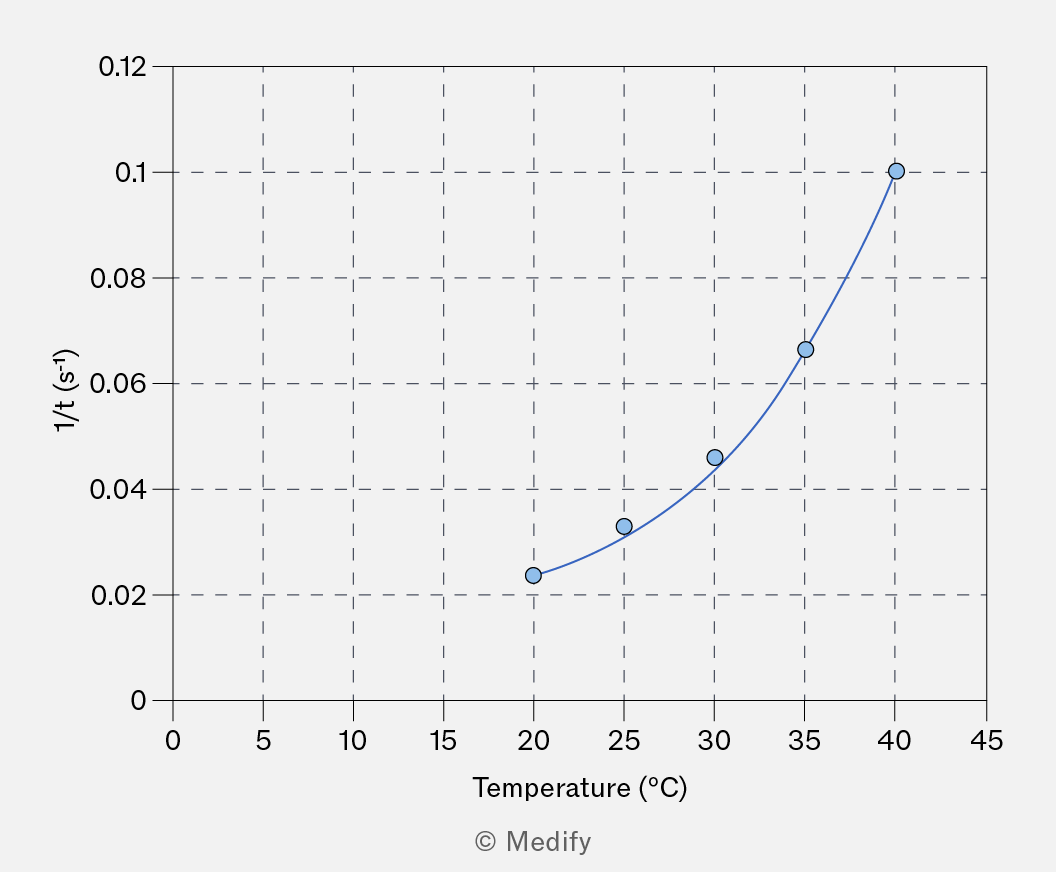
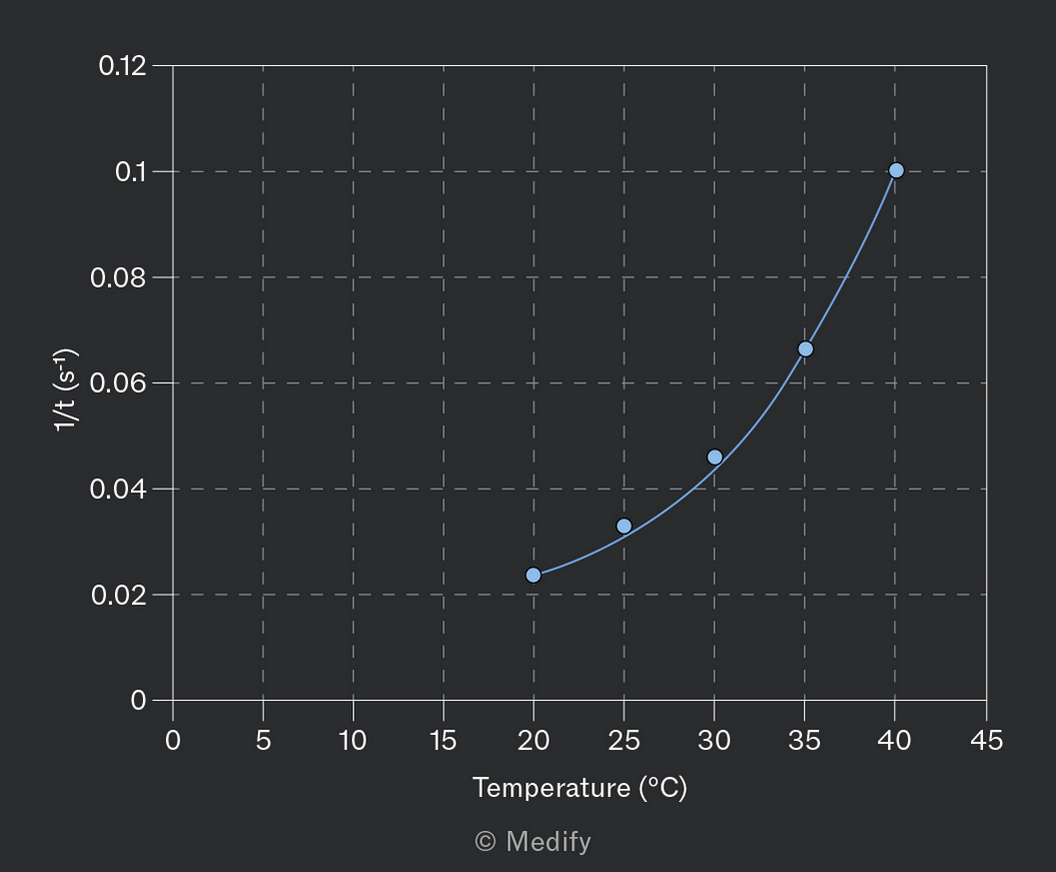
To analyse the relationship between time for reaction to complete and temperature use a scatter graph.
X-axis: Plot the temperature for each reaction mixture.
- Y-axis: Plot (time inverse in ) values for each temperature.
Ensure the graph is scaled appropriately to fit all the data points.