Practical chemistry for exams›RP9 - pH curves

RP9 - pH curves

An overview of RP9 - pH curves
4 min

In AQA Required Practical 9 – pH curves, the purpose is to investigate how pH changes during the gradual addition of a strong base (sodium hydroxide) to a weak acid (ethanoic acid), and to use this data to construct a pH curve.

The initial calibration of the pH meter improves the accuracy of pH measurements. This allows for the identification of the equivalence point and the pH behaviour of weak acid–strong base titrations.

Add to favourites

In Required Practical 9: pH curves, as outlined by AQA, there are several important safety requirements to be aware of (beyond normal lab practice, such as wearing goggles).

  • Ethanoic acid is an irritant – avoid skin contact and rinse spills immediately with water.
  • Sodium hydroxide is a mild irritant – wipe up spills promptly to prevent skin or eye exposure.
  • pH buffers (pH 4.00 and 9.00) are weak acid/alkali solutions – handle carefully to avoid skin irritation.
  • pH probe is fragile – avoid knocking the glass bulb against the beaker or with the stirrer to prevent breakage.
Add to favourites

Experimental method for AQA Required Practical 9 – pH curves

EXPERIMENTAL METHOD AQA REQUIRED PRACTICAL 9. 1. Rinse the pH probe with distilled water, then shake gently to remove excess droplets. Prevents contamination and ensures correct calibration. 2. Immerse the probe in standard buffer pH and record the reading. Repeat with buffer solutions at pH 4 and pH 10. Note the pH when colored solutions are used; the color of the solution may affect the reading. 3. Plot a calibration graph of recorded pH readings (x-axis with pH of buffer solution) vs. pH. 4. Rinse and fill a second burette with 0.100 mol dm-3 hydrochloric acid. 5. Transfer 200 cm3 of aluminum acid into a clean 250 cm3 beaker. Use the water to precision. 6. Rinse and fill the second burette with 0.100 mol dm-3 sodium hydroxide. 7. Clamp the pH probe into the acid so it is fully immersed. Ensure the stirrer is immersed in the acid for accurate pH measurement. 8. Add NaOH in 2.0 cm3 increments until the end point is reached, recording after each addition. 9. Add in 0.20 cm3 increments of NaOH between 18.0 cm3 and 24.0 cm3. 10. Continue to 2.0 cm3 increments of NaOH until 40.0 cm3 has been added. 11. Rinse the pH probe thoroughly with distilled water after completing the experiment.
Add to favourites

To prevent incorrect additions.
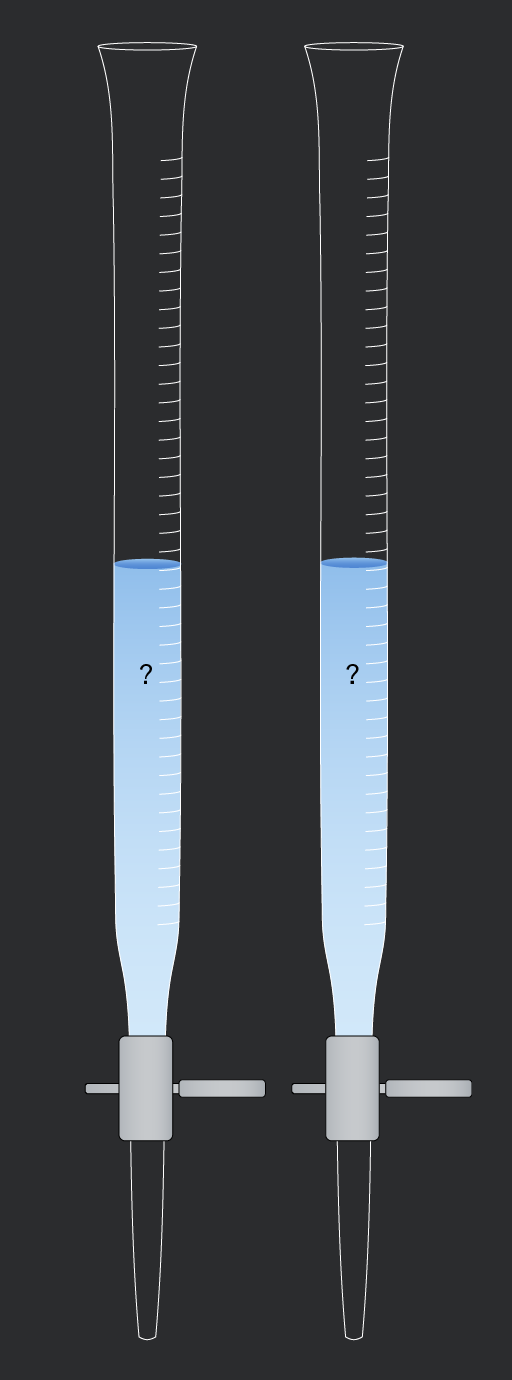
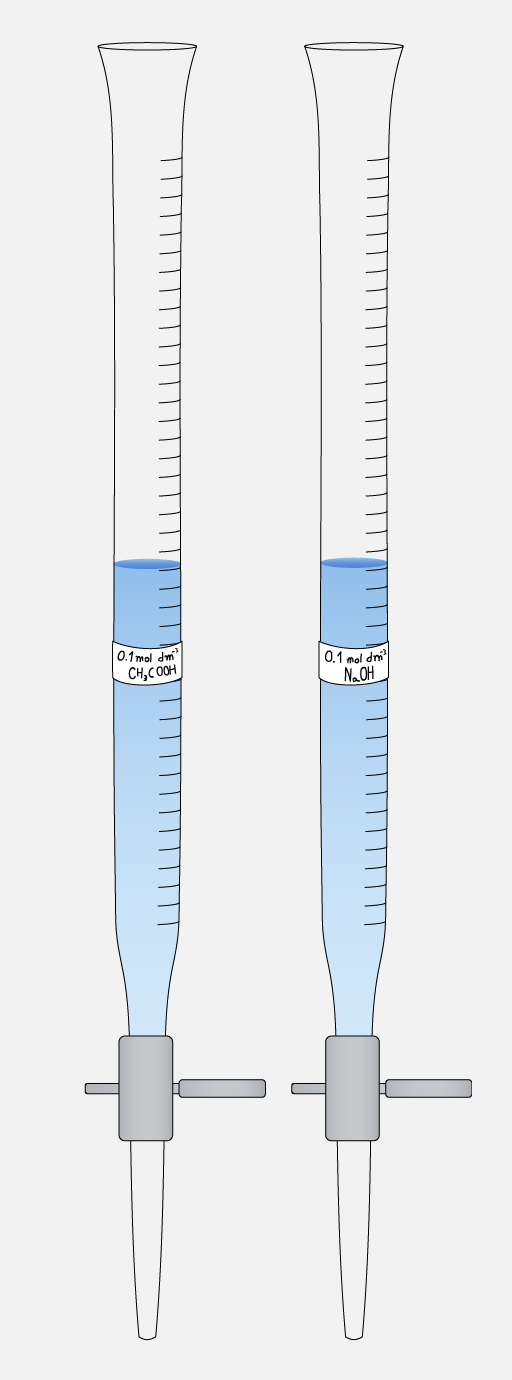
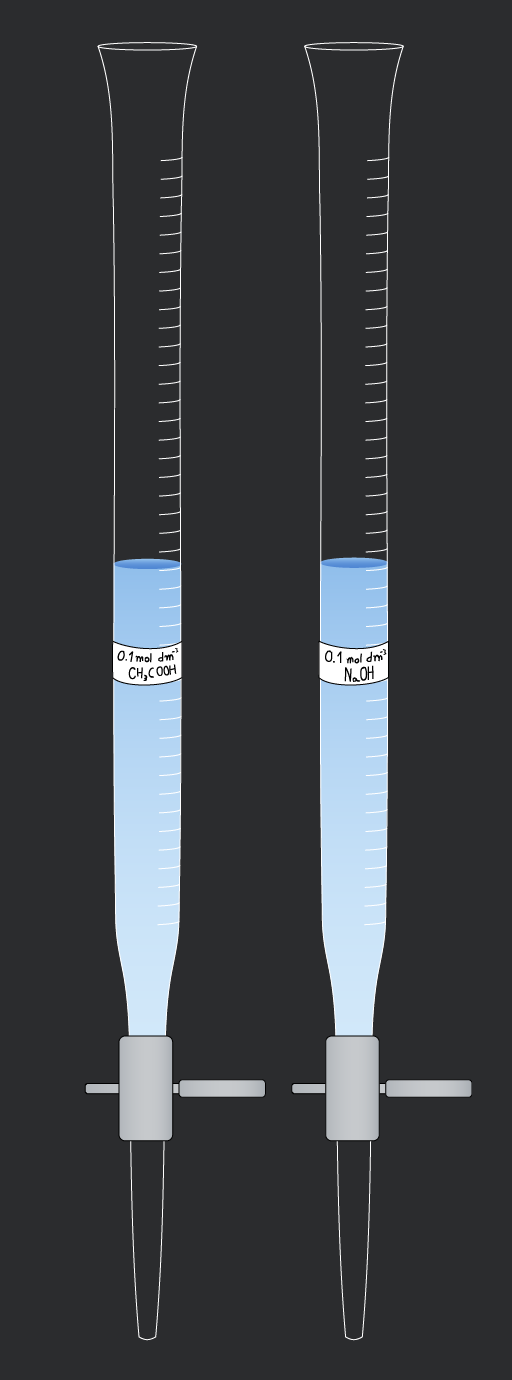
Two graduated cylinders containing blue liquids. The left cylinder is labeled '0.1 mol dm-3 CH3COOH' and the right cylinder is labeled '0.1 mol dm-3 NaOH'.
Do

Label any substance filled into clear glassware. This is especially important if similar looking materials are put into the same type of equipment.

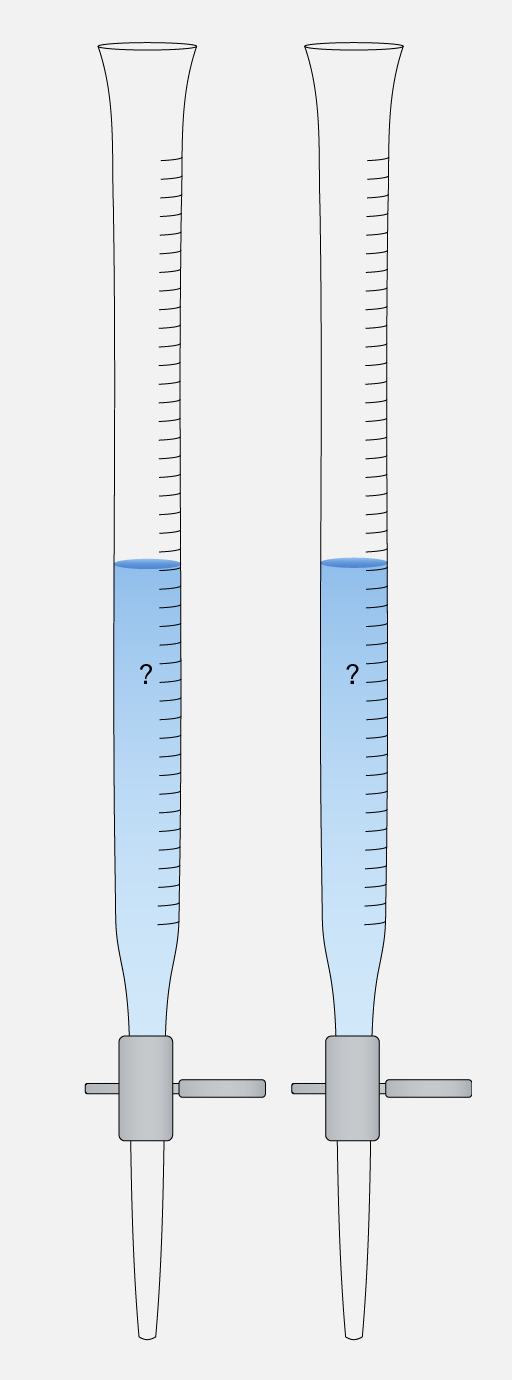
Two graduated cylinders with blue liquid at different levels, each marked with a question mark. The cylinders are connected to a valve system at the bottom.
Don't

Assume you will remember what is in glassware based on where you left it. Not only will incorrect chemicals impact your results, poor labelling can result in inappropriate handling of chemicals and potentially dangerous reactions.

Add to favourites

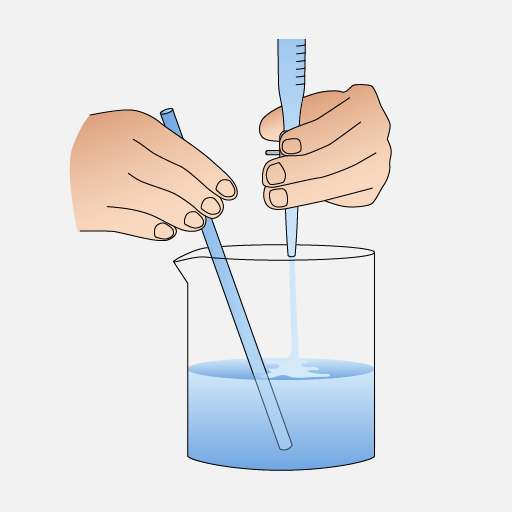
To record a clear titration curve with enough data around the equivalence point.
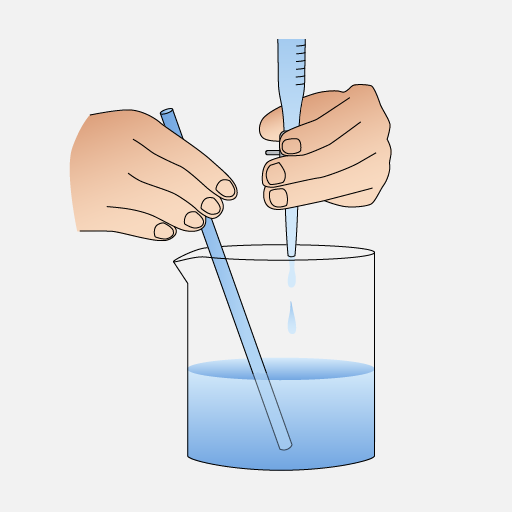
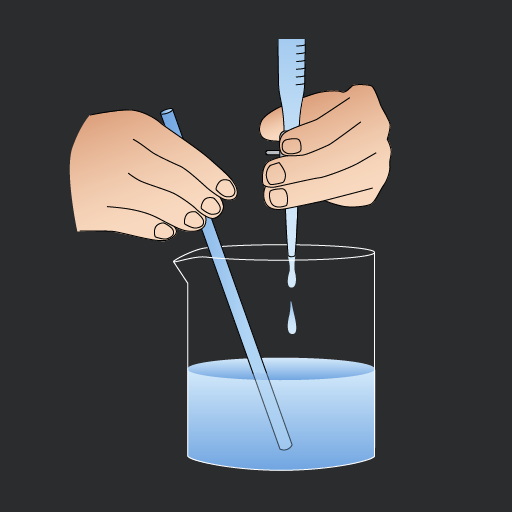
Two hands are holding a pipette and a stirring rod above a beaker filled with blue liquid. The pipette is dispensing a drop of liquid into the beaker.
Do

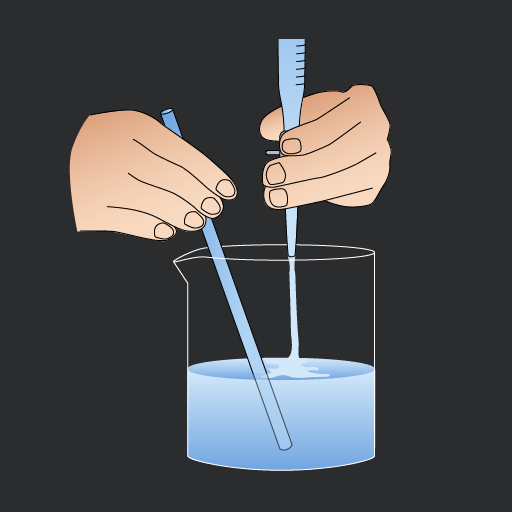
Use smaller increments () near the expected equivalence point.

Two hands are holding a blue straw and a pipette, while a beaker filled with blue liquid is placed on a surface.
Don't

Continue with large additions throughout the whole titration – you will miss the sharp pH change.

Add to favourites

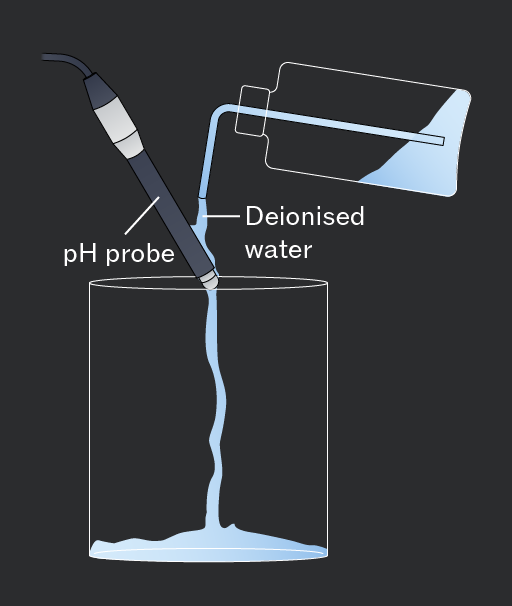
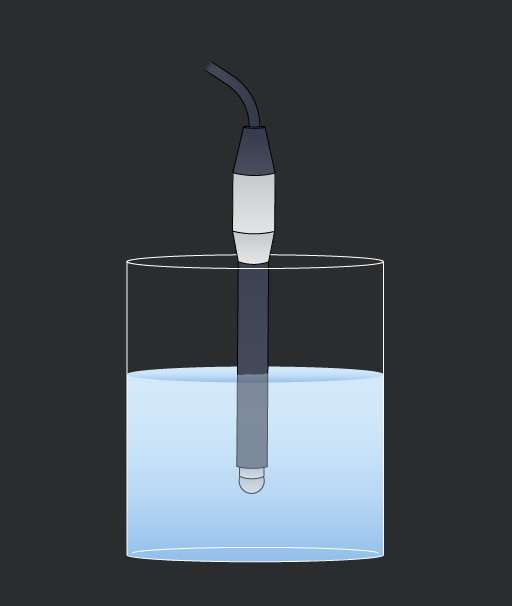
Prevent contamination on the pH probe that would affect your calibration and titration data.
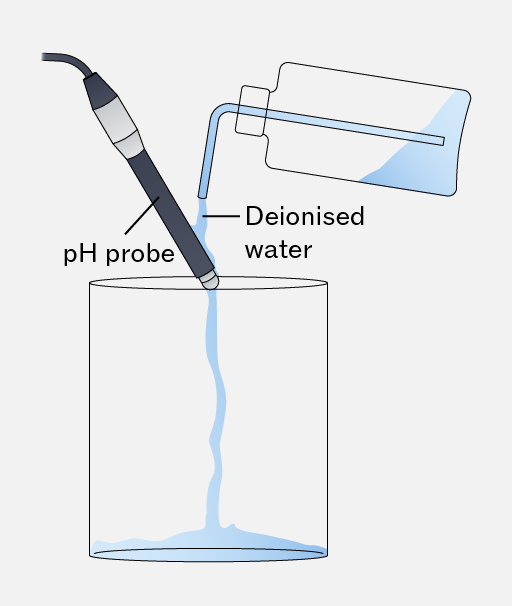
A pH probe is shown inserted into a container filled with deionised water. A bottle is pouring deionised water into the container.
Do

Rinse the pH probe with deionised water between every solution.

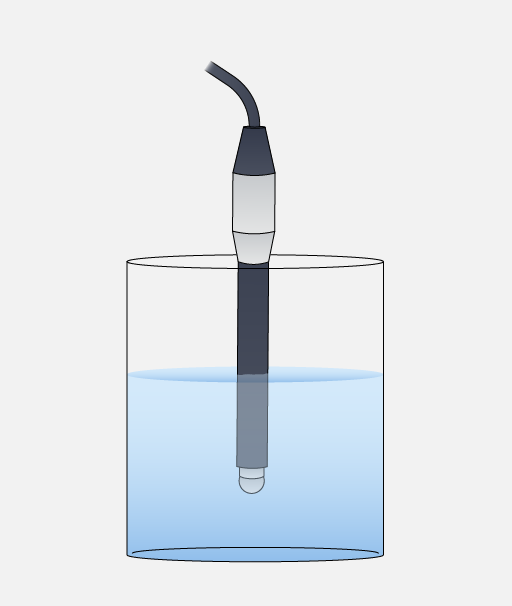
A glass container filled with blue water, with a probe submerged in it. The probe has a black and white design and a cable extending from the top.
Don't

Insert the probe into a new solution without rinsing – it can change the composition of the solution being measured and affect the accuracy results.

Add to favourites

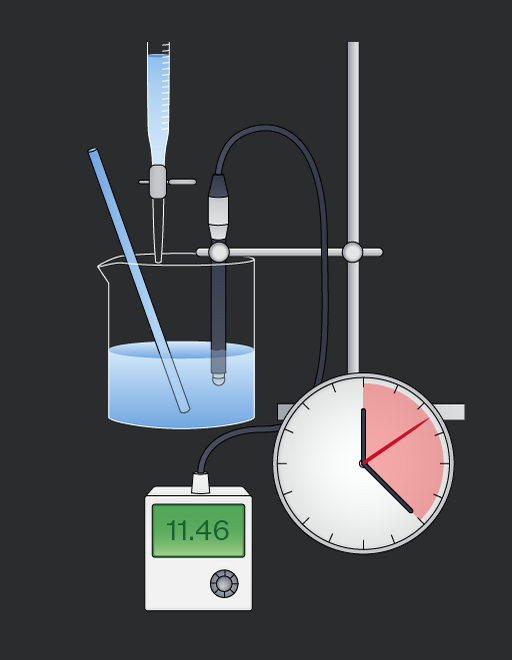
To ensure accurate pH readings from the pH meter.
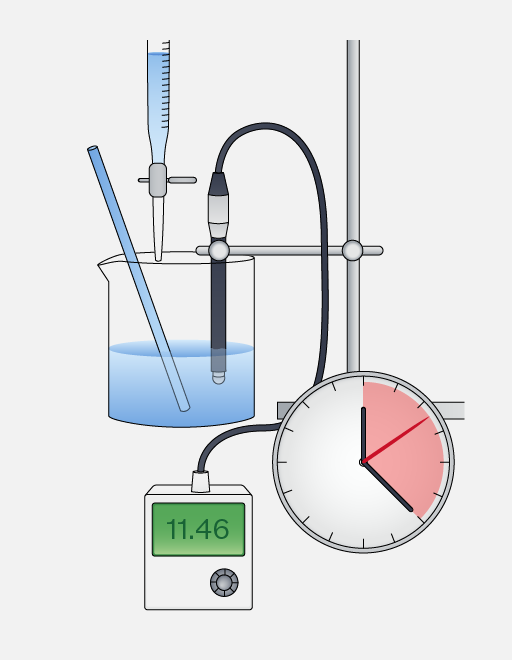
A laboratory setup featuring a beaker with blue liquid, a pipette, a probe, a digital display showing '11.46', and a circular clock with a red section.
Do

Stir the mixture and wait for the pH reading to stabilise before recording it.

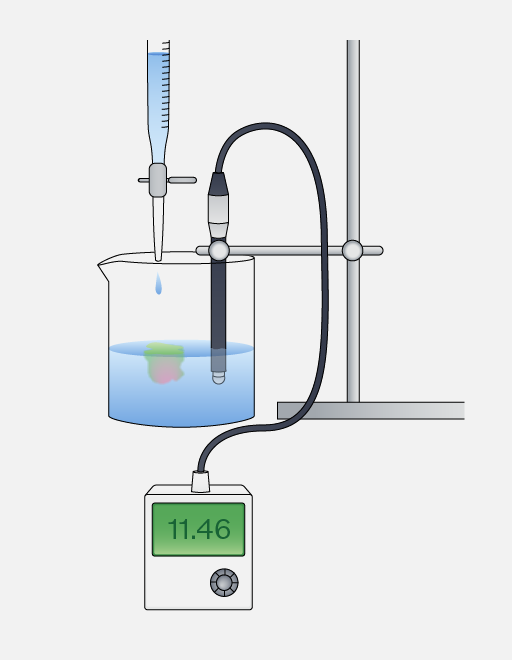
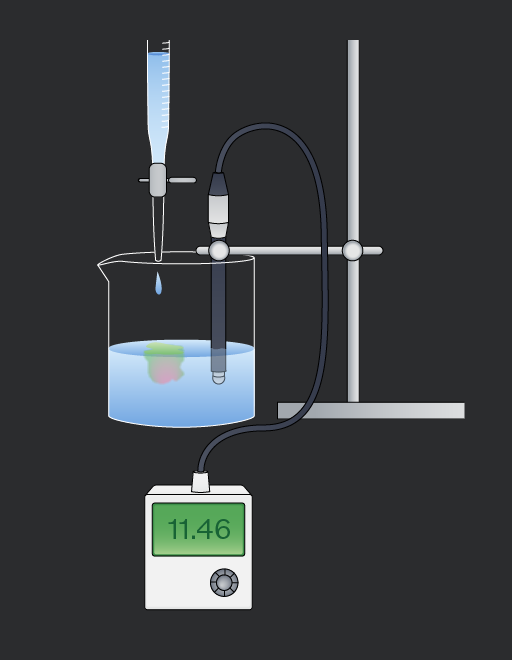
A laboratory setup featuring a beaker filled with blue water, a drop of liquid falling from a pipette into the beaker, and a probe submerged in the water. A digital meter displays the value 11.46.
Don't

Rush taking measurements – before the reactants are fully mixed there can be local regions of variable pH. Unstable values can lead to an inaccurate pH curve.

Add to favourites

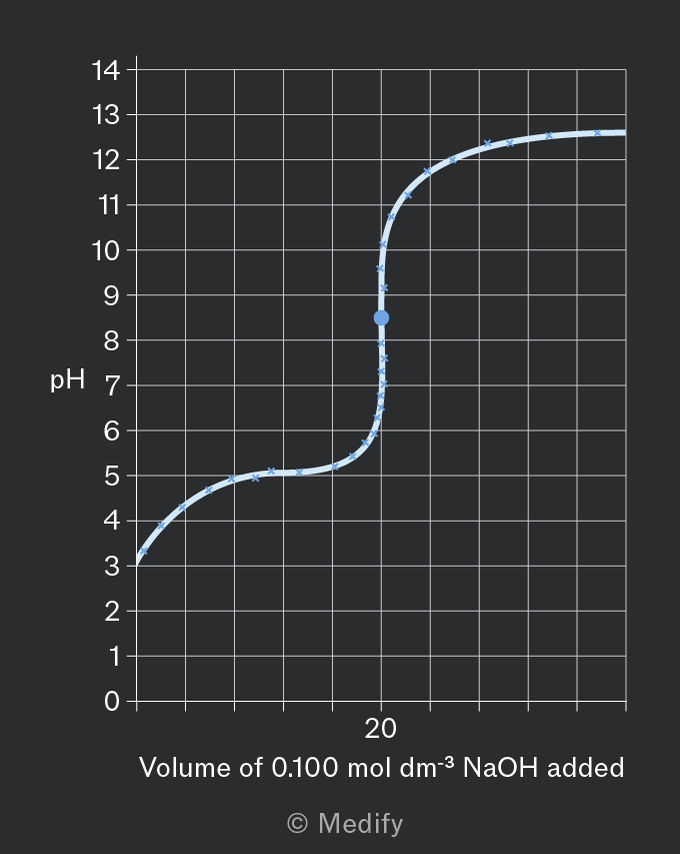
To produce a pH curve from the results collected in AQA Required Practical 9: pH curves.

  1. Adjust the pH readings obtained using the calibration graph. Ensure all pH values are corrected based on the calibration curve.
  2. Plot a graph of the corrected pH values (Y-axis) against the volume of sodium hydroxide added (X-axis).
  3. Join the points with a smooth pencil line, tracking the moving average.
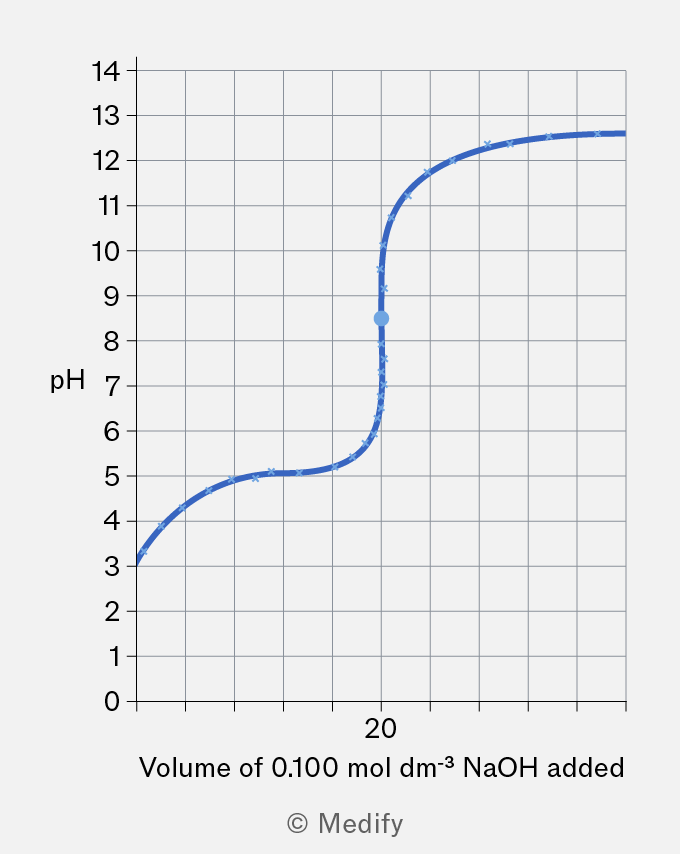
A graph showing pH on the vertical axis ranging from 0 to 14 and the volume of 0.100 mol dm-3 NaOH added on the horizontal axis, ranging up to 20. The graph depicts a curve that rises sharply around pH 8 and levels off towards pH 12.

The equivalence point occurs during the vertical line of this pH curve, this is vertical line represents the end point of the titration.

Add to favourites