Practical chemistry for exams›RP7 - Measuring rates of reaction

RP7 - Measuring rates of reaction

An overview of RP7 - Measuring rates of reaction
4 min

In AQA Required Practical 7: Measuring rates of reaction, the purpose is to explore how changing the concentration of a reactant affects the rate of a chemical reaction, using both initial and continuous rate methods.

In RP7a, an initial rate method, hydrogen peroxide oxidises iodide ions in acidic solution. The time for blue-black colour formation is used to calculate the initial rate.

In RP7b a continuous monitoring method, magnesium reacts with hydrochloric acid to produce hydrogen gas. The gas volume is measured over time to determine the rate.

Add to favourites

In Required Practical 7: Measuring rates of reaction, as outlined by AQA, there are several important safety requirements to be aware of (beyond normal lab practice such as wearing goggles).

  • Hydrogen peroxide is an irritant and strong oxidiser – avoid contact with skin and eyes, clean spills immediately, and wear gloves.
  • Hydrogen gas is highly flammable – keep away from flames and heat sources, and ensure good ventilation in the lab.
  • Ensure gas syringes and bungs are secure to prevent accidental release of hydrogen.
  • Ensure free movement in the gas syringe plunger to prevent pressure build-up.
  • Glassware under pressure (e.g. with gas syringes) may crack or pop – handle with care and do not lean over during collection.
Add to favourites

Experimental method for AQA Required Practical 7a: Measuring rates of reaction with initial rate method


EXPERIMENTAL METHOD AQA REQUIRED PRACTICAL 7A. 1. Rinse a 50 cm³ burette with potassium iodide solution and then fill with the same solution. Rinsing prevents dilution or contamination of the solution with water. Ensure no air bubbles are present. 2. Transfer 10.0 cm³ of hydrogen peroxide into a clean, dry 250 cm³ beaker from a shared burette. Use the bottom of the meniscus at eye level. Note: a dry beaker as concentration of the liquid solution is important in calculations. Add the following to a clean, dry 250 cm³ beaker: • 25 cm³ sulfuric acid • 20 cm³ distilled water • 1 cm³ starch solution (using a plastic dropping pipette) • 5.0 cm³ potassium iodide solution from the burette. Use measuring cylinders close to the desired volumes to minimise percentage uncertainty. 4. Add 6.0 cm³ sodium thiosulfate solution to the beaker from a shared burette. Make sure to add this last to delay the visible reaction, ensuring you control when the reaction starts. Stir the mixture in the 250 cm³ beaker to ensure uniform mixing before starting the timed reaction. 5. Pour the hydrogen peroxide into the 250 cm³ beaker and immediately start the timer. Start timing at the exact moment of addition for consistency. 6. Stir continuously and stop the timer when the blue-black colour appears. Use white paper underneath to spot colour change clearly. 7. Record results: Experiment 1 2 3 Sulfuric acid 25 25 25 Starch 20 20 20 Potassium iodide 0.5 0.5 0.5 Sodium thiosulfate 5 5 5 Time (s) 20 20 20. 8. Rinse and dry the beaker thoroughly before repeating with other concentrations of potassium iodide. The concentration of potassium iodide is controlled through the ratio of potassium iodide to distilled water.
Add to favourites

Experimental method for AQA Required Practical 7b: Measuring rates of reaction with the continuous monitoring method
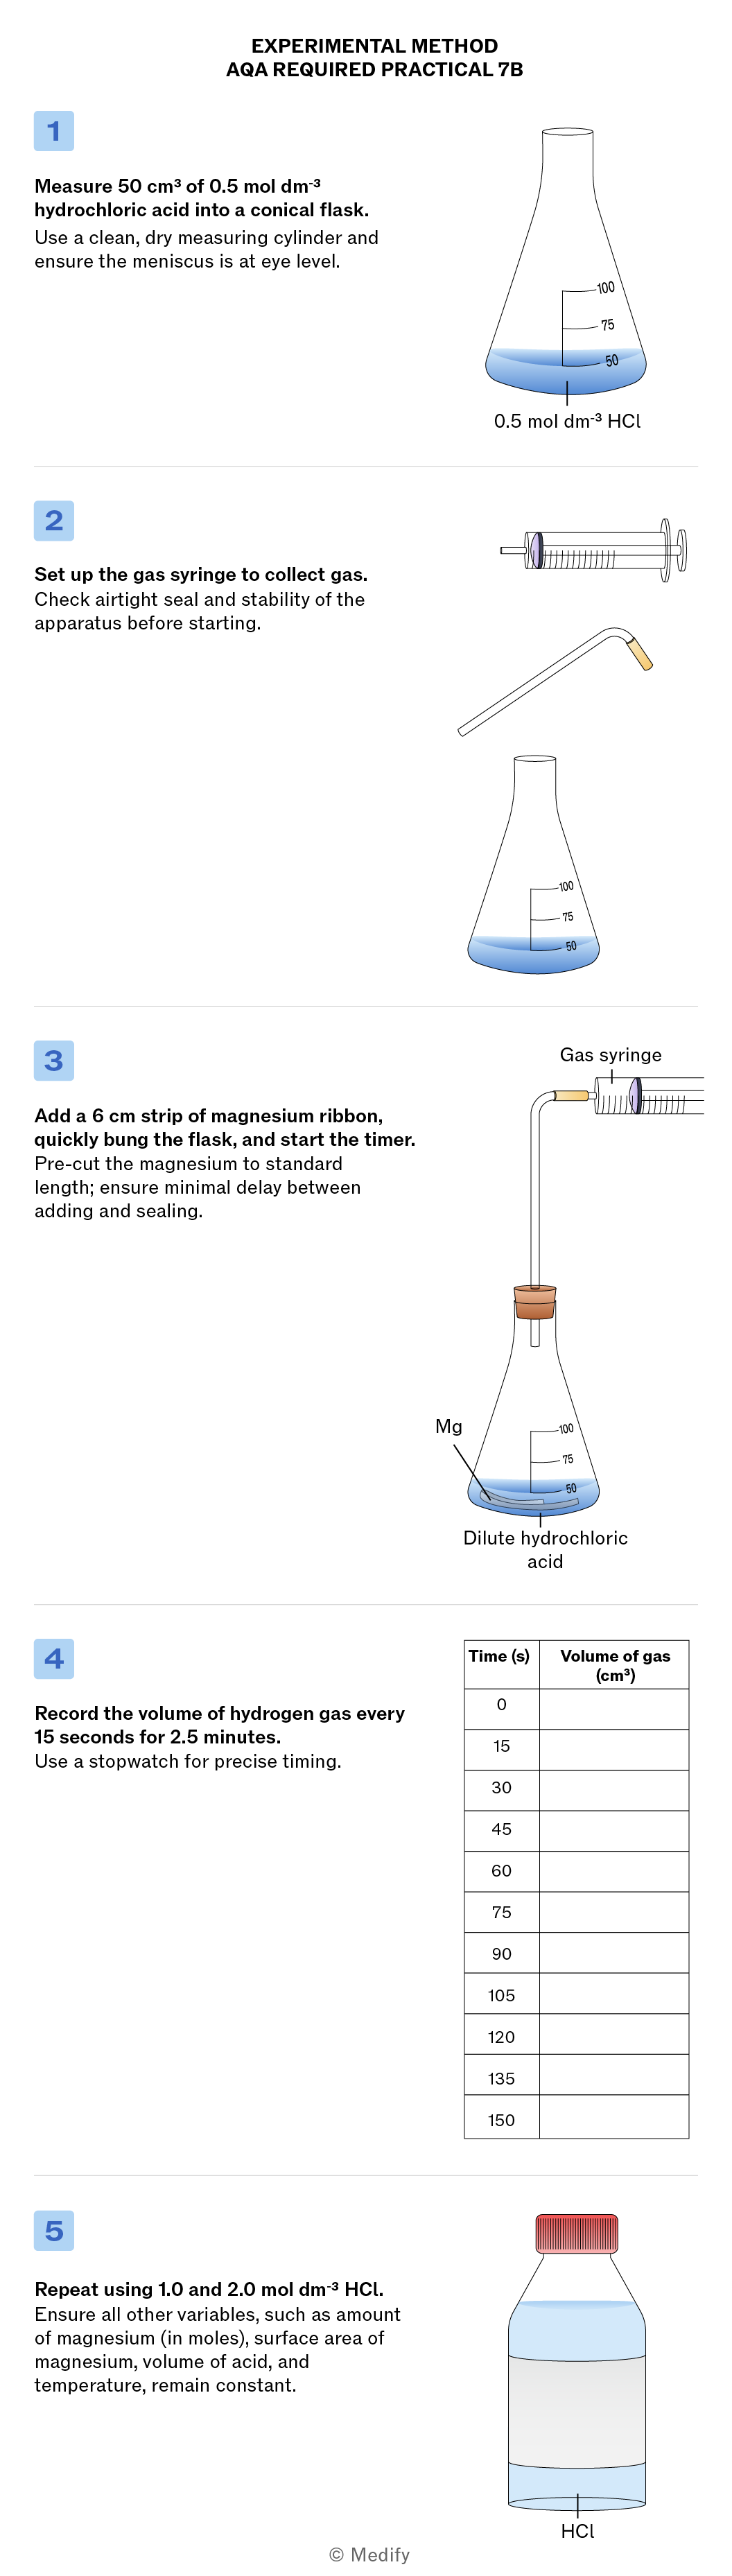
EXPERIMENTAL METHOD AQA REQUIRED PRACTICAL 7B. 1. Measure 50 cm³ of 0.5 mol dm⁻³ hydrochloric acid into a conical flask. Use a clean, dry measuring cylinder and ensure the meniscus is at eye level. 0.5 mol dm⁻³ HCl. 2. Set up the gas syringe to collect gas. Check airtight seal and stability of the apparatus before starting. 3. Add a 6 cm strip of magnesium ribbon, quickly bung the flask, and start the timer. Pre-cut the magnesium to standard length; ensure minimal delay between adding and sealing. Gas syringe. Mg. Dilute hydrochloric acid. 4. Record the volume of hydrogen gas every 15 seconds for 2.5 minutes. Use a stopwatch for precise timing. Time (s) Volume of gas (cm³) 0, 15, 30, 45, 60, 75, 90, 105, 120, 135, 150. 5. Repeat using 1.0 and 2.0 mol dm⁻³ HCl. Ensure all other variables, such as amount of magnesium (in moles), surface area of magnesium, volume of acid, and temperature, remain constant. HCl © Medify.
Add to favourites

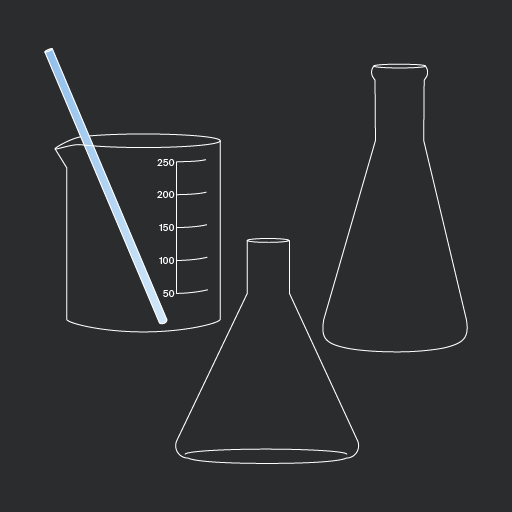
Clean, dry glassware should always be used in any experiment where concentration is important.
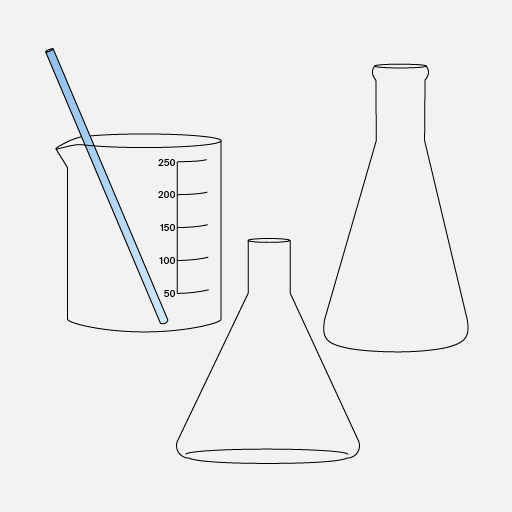
An illustration showing a graduated beaker with a blue stirring rod, a round-bottom flask, and a conical flask.
Do

Ensure glassware is clean and dry before use to prevent dilution or unwanted reactions.

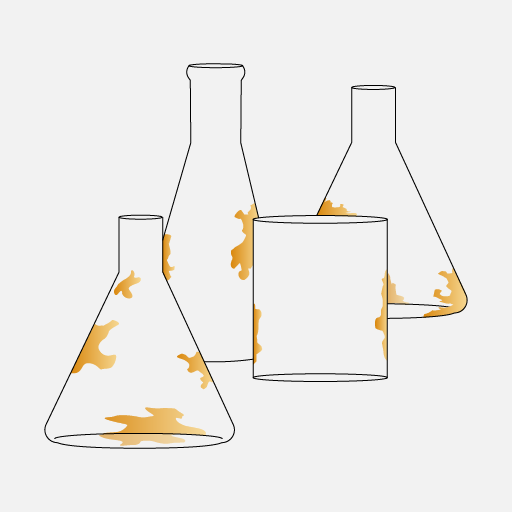
Four laboratory glassware pieces, including two conical flasks, one round-bottom flask, and one beaker, all featuring orange stains.
Don't

Use wet or contaminated glassware – this can affect concentrations and skew results. Rinsing with distilled water directly prior to use is not appropriate here.

Add to favourites

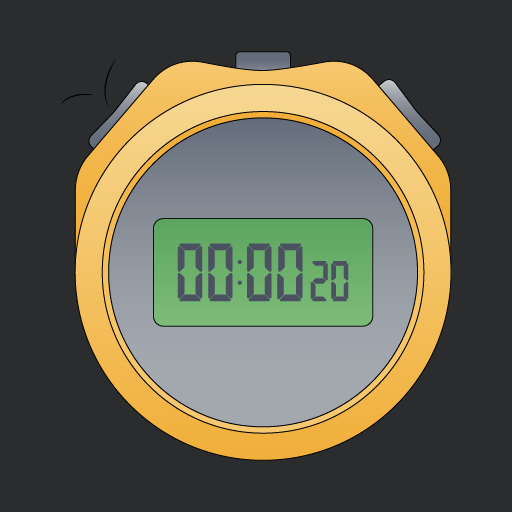
Accurately measuring time is essential in rate investigations.
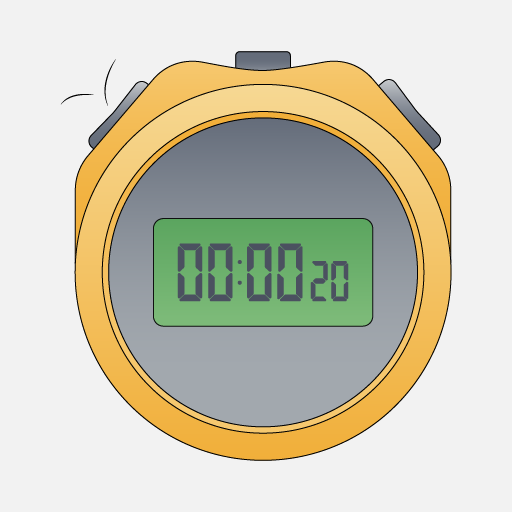
A round yellow stopwatch displaying the time 00:00:20 on a green digital screen.
Do

Start timing immediately after mixing reagents to ensure an accurate measurement of the reaction rate.

A round yellow stopwatch displaying the word 'ERROR' in large green letters on its screen.
Don't

Stop the timer to take measurements. The reaction hasn’t stopped, so neither should the timer.

Add to favourites

The results from the initial rates (practical 7a) experiment should be analysed as follows:

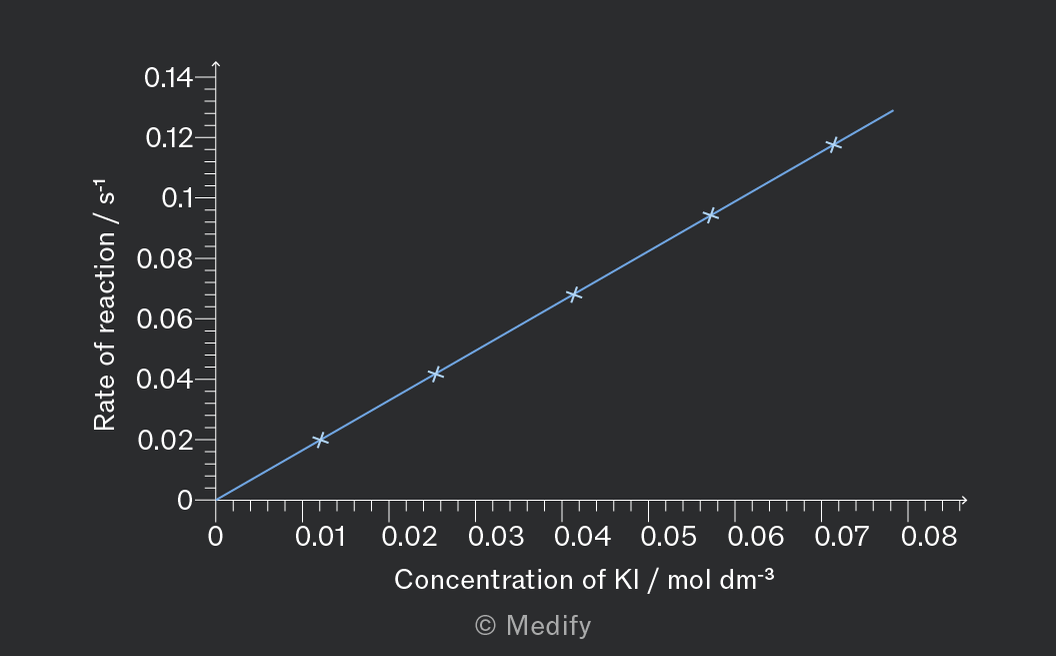
  • Plot a graph of (the initial rate) on the Y-axis against initial reactant concentration on the X-axis. For the iodine clock reaction, is proportional to .
  • If the graph is a straight line through the origin (see below), the rate is directly proportional to .
  • This suggests the reaction is first order with respect to iodide ions.
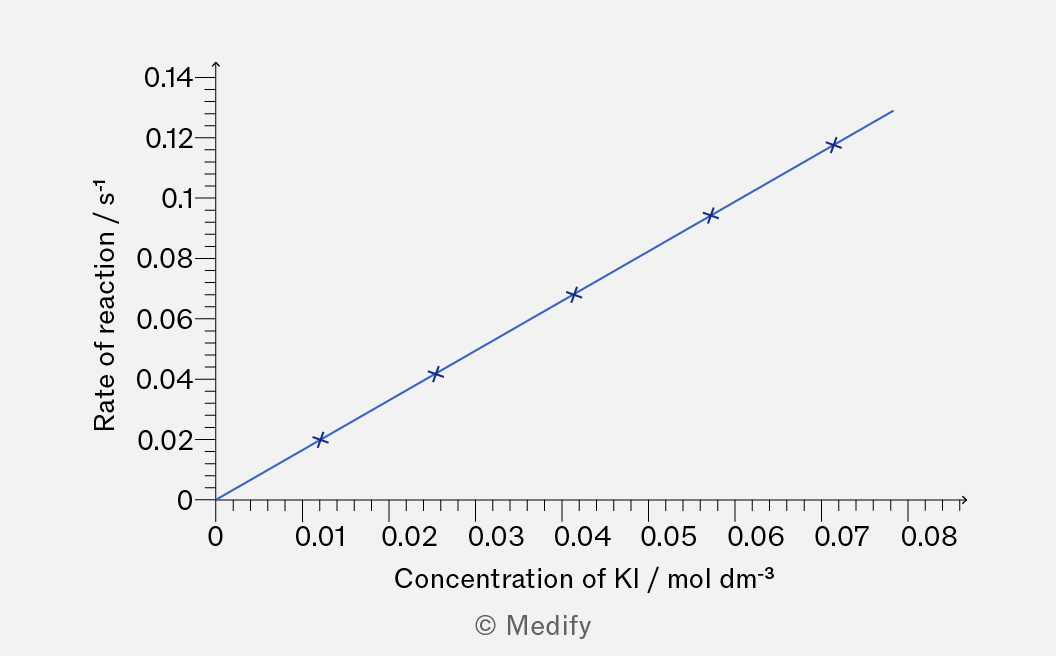
A graph showing the relationship between the concentration of KI in mol dm-3 on the x-axis and the rate of reaction in s-1 on the y-axis. The graph features a blue line with data points indicating a positive correlation, with values ranging from 0 to 0.08 for concentration and 0 to 0.14 for rate of reaction. © Medify
Add to favourites

The results from the continuous monitoring (practical 7b) experiment should be analysed as follows:

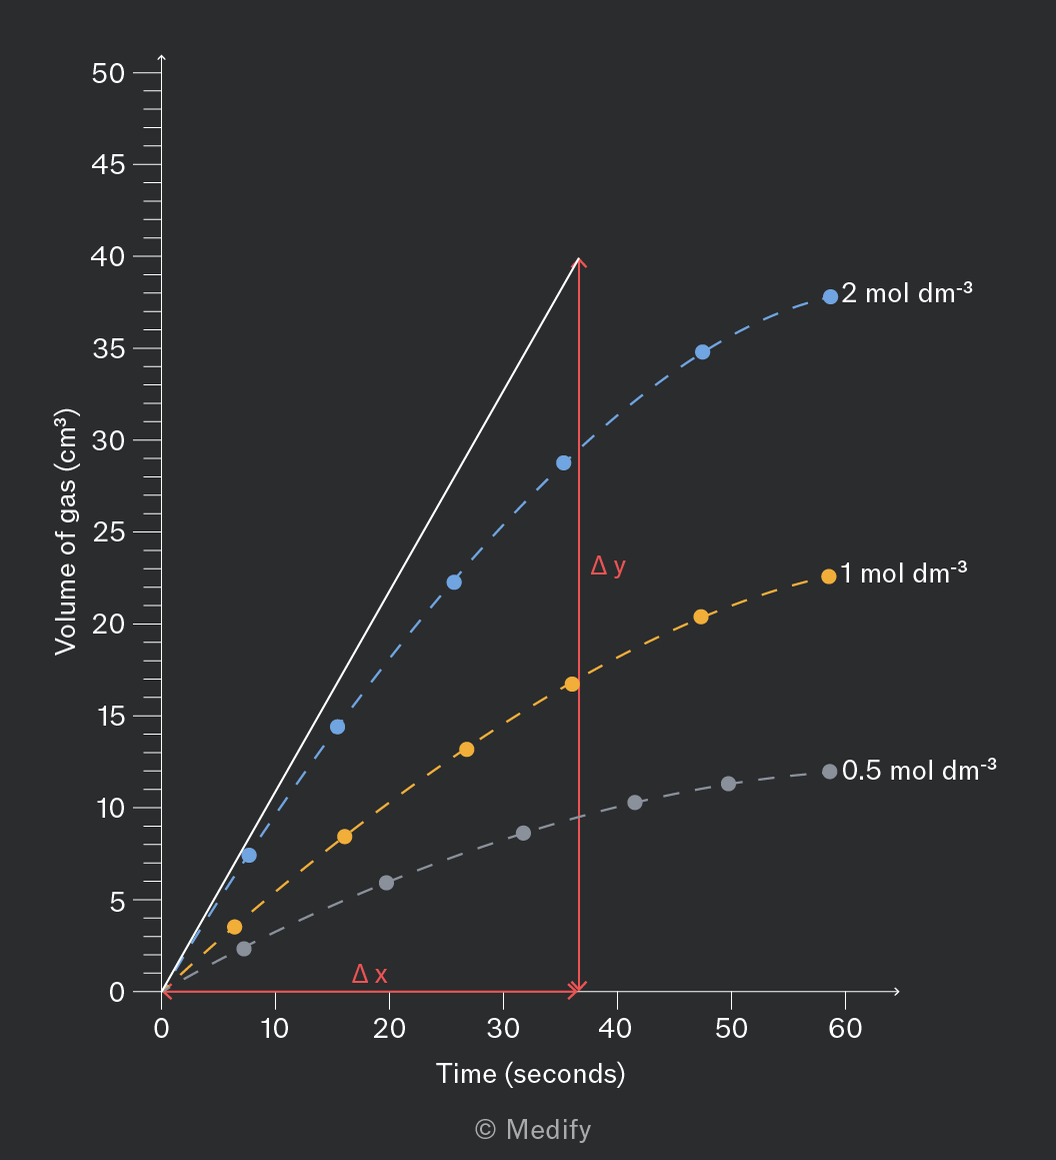
  • Plot a graph of volume of produced ³ on the Y-axis against time (s) on the X-axis, for each acid concentration.
  • Draw a smooth line of best fit for each dataset.
  • At , draw a tangent to each curve and calculate its gradient to determine the initial rate of reaction
  • Compare the gradients for the concentrations to show how rate depends on acid concentration.
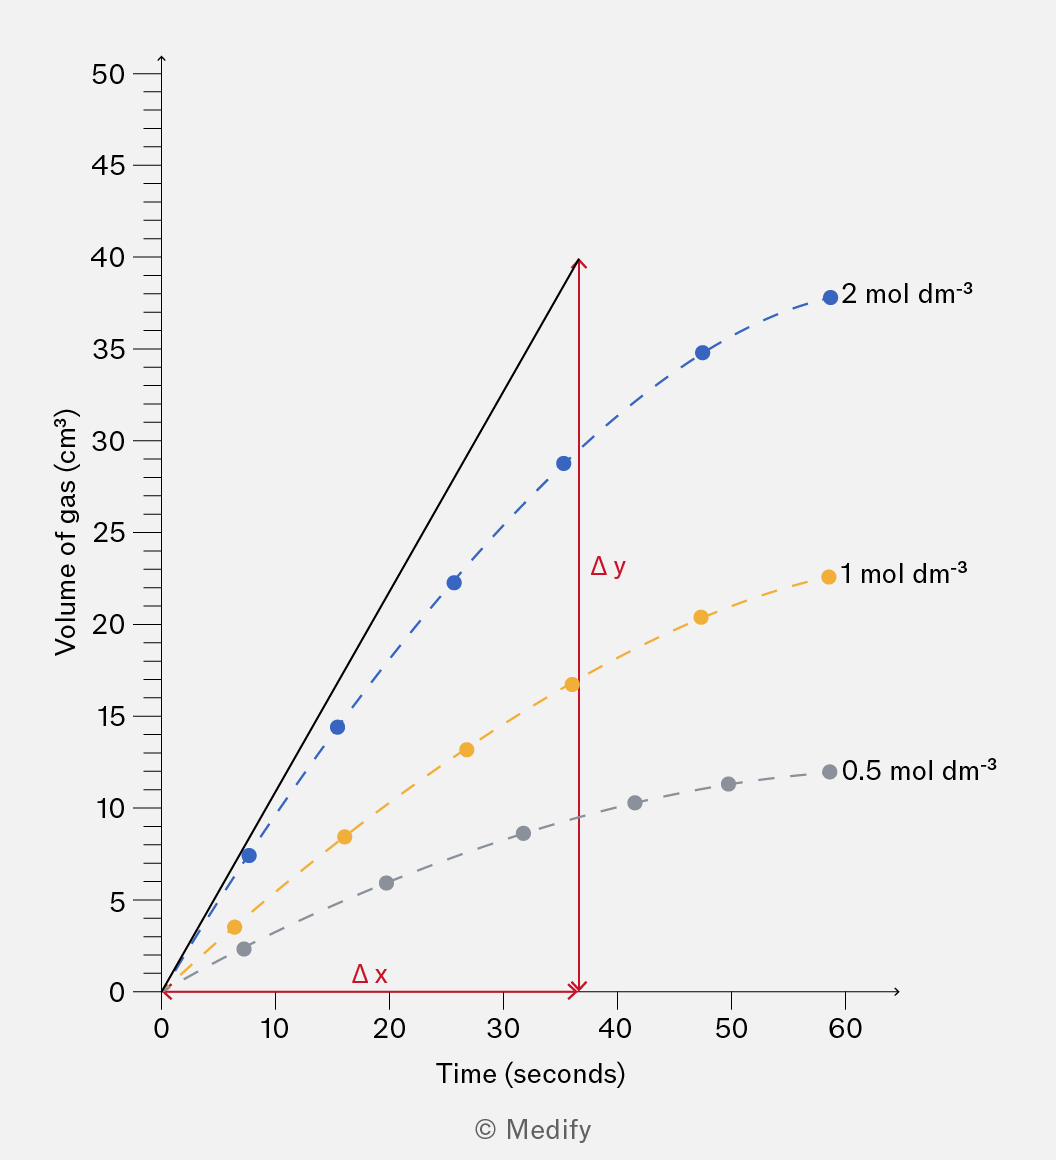
A graph showing the Volume of gas (cm³) on the y-axis and Time (seconds) on the x-axis. The graph includes three dashed lines representing different concentrations: 2 mol dm⁻³ (blue), 1 mol dm⁻³ (orange), and 0.5 mol dm⁻³ (gray). There are points plotted on each line, and two red arrows labeled Δx and Δy indicating changes in time and volume, respectively.
Add to favourites