Module 1: Practical chemistry for exams›PAG 9.1 - Rate of decomposition of hydrogen peroxide

PAG 9.1 - Rate of decomposition of hydrogen peroxide

An overview of PAG 9.1 - Rate of decomposition of hydrogen peroxide
2 min

In OCR Chemistry Required Practical 9 (PAG 9.1 ), the rate of a reaction is measured using the continuous monitoring method.

This experiment measures the rate of decomposition of hydrogen peroxide with a catalyst. The reaction is monitored by measuring the volume of oxygen gas collected.

Add to favourites

In OCR PAG 9.1: Rate of decomposition of hydrogen peroxide, normal lab practice such as wearing goggles is adequate when carrying out the practical steps.

Add to favourites

Experimental method for OCR Chemistry Required Practical 9 (PAG 9.1)
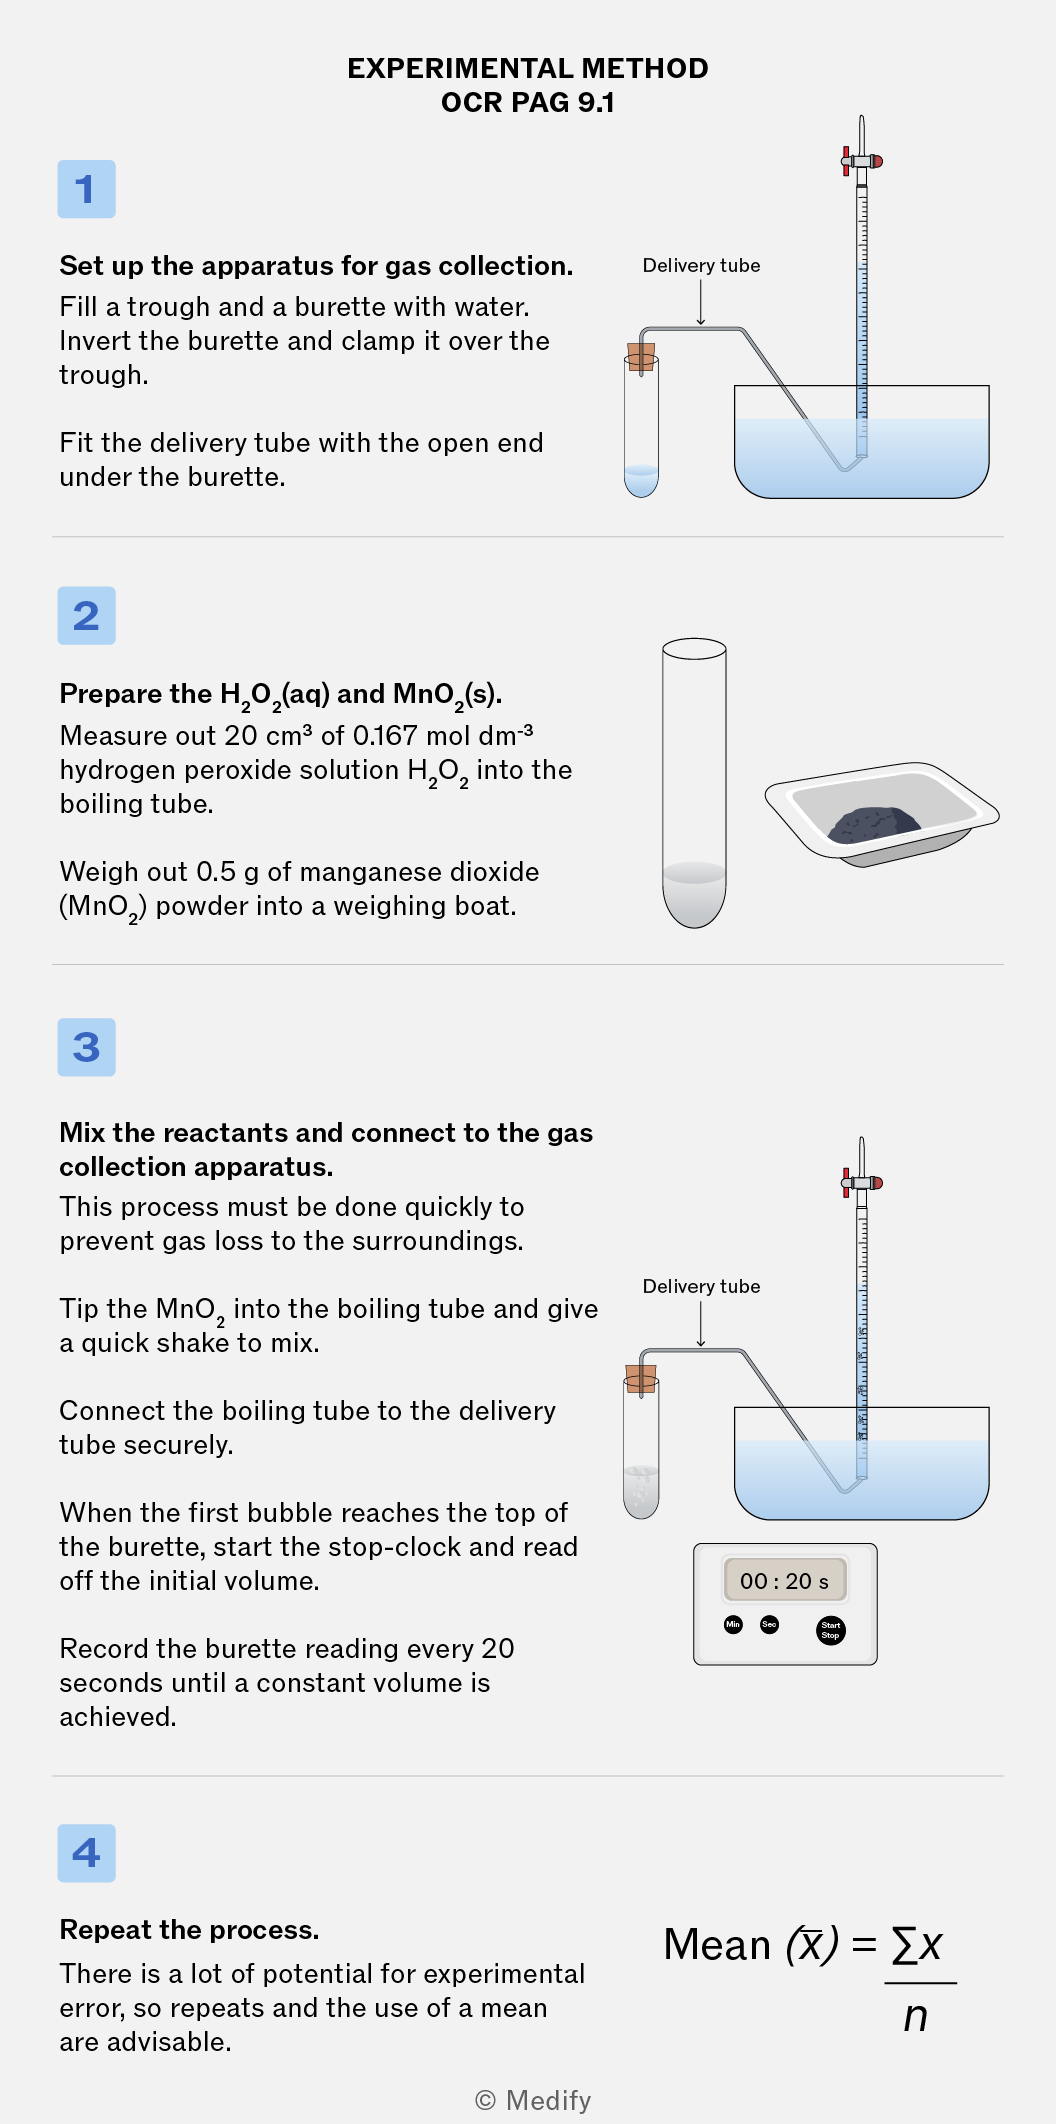
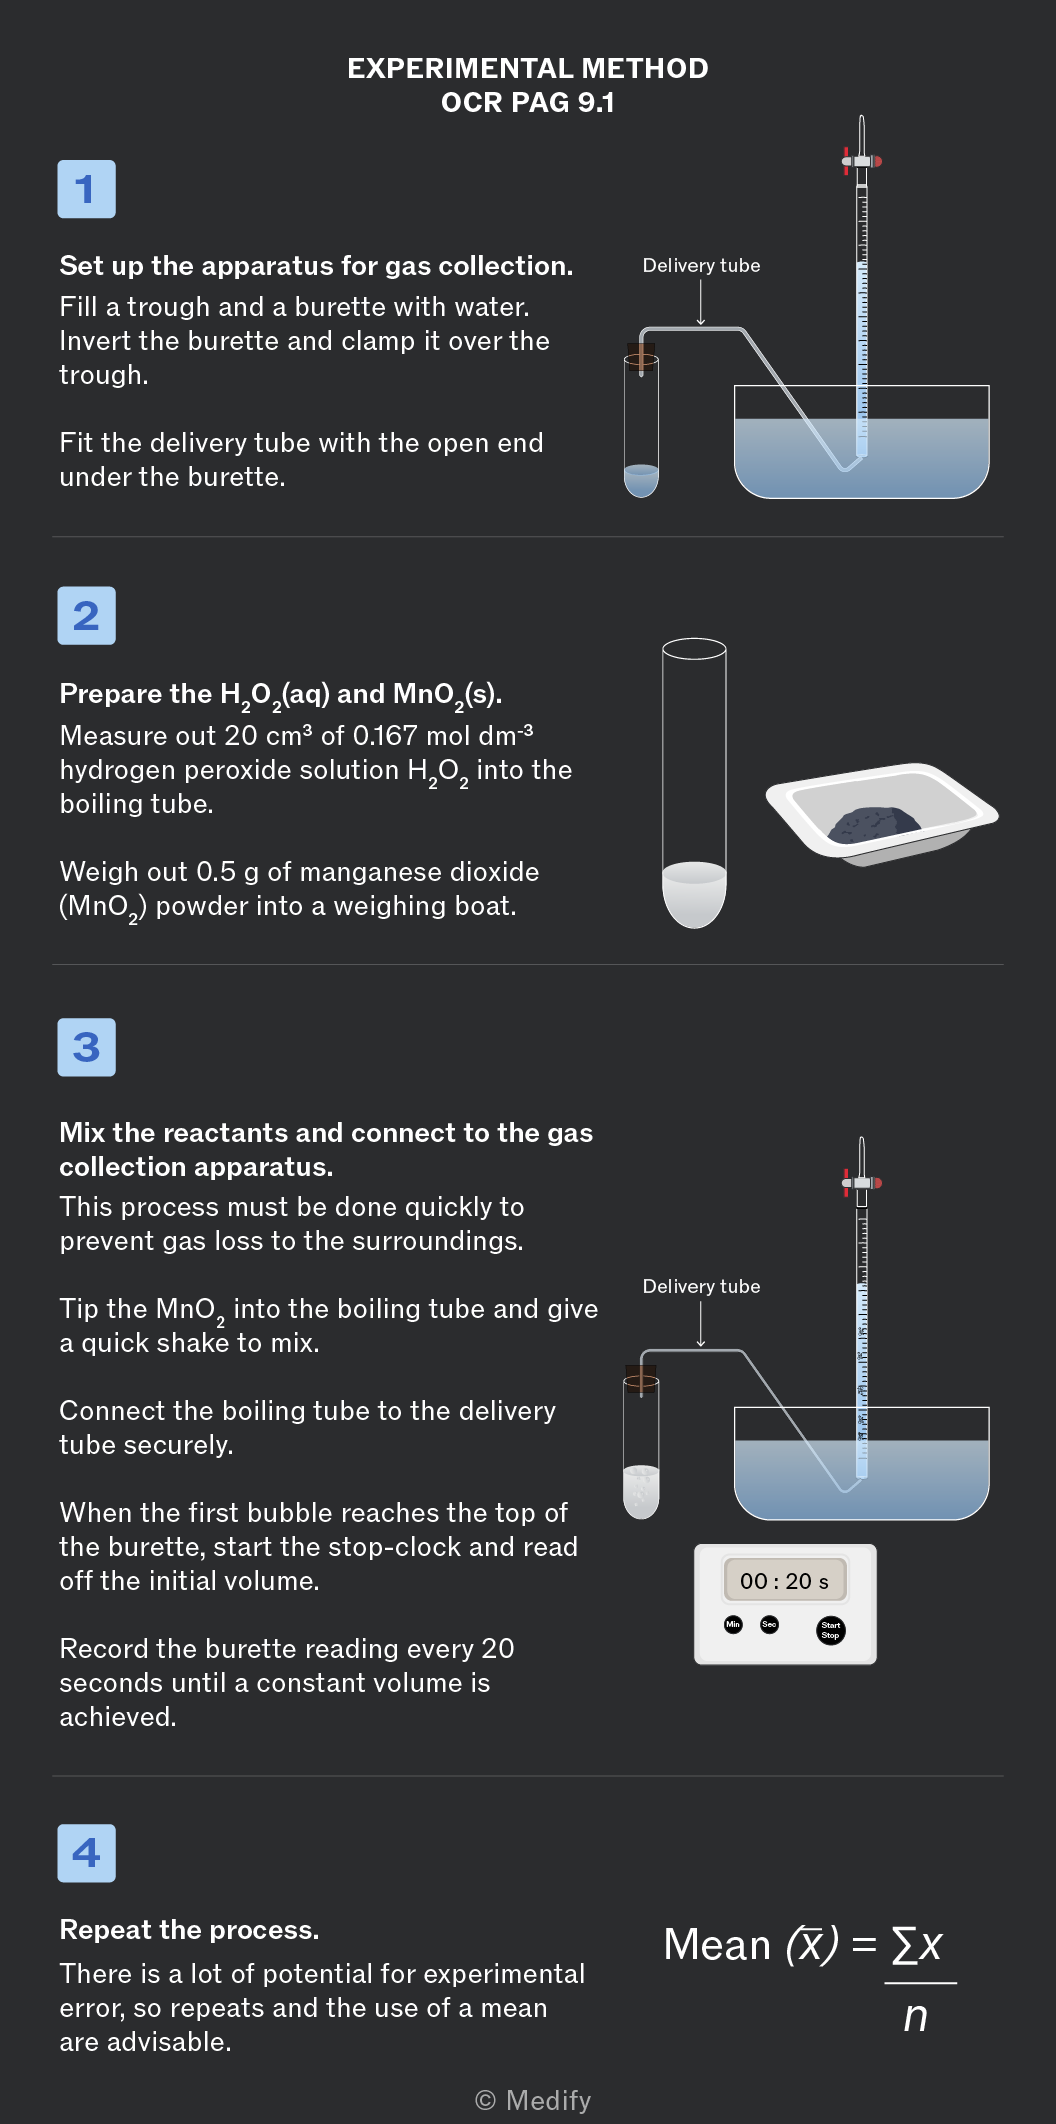
EXPERIMENTAL METHOD OCR PAG 9.1. 1. Set up the apparatus for gas collection. Fill a trough and a burette with water. Invert the burette and clamp it over the trough. Fit the delivery tube with the open end under the burette. 2. Prepare the H2O2(aq) and MnO2(s). Measure out 20 cm³ of 0.167 mol dm⁻³ hydrogen peroxide solution H2O2 into the boiling tube. Weigh out 0.5 g of manganese dioxide (MnO2) powder into a weighing boat. 3. Mix the reactants and connect to the gas collection apparatus. This process must be done quickly to prevent gas loss to the surroundings. Tip the MnO2 into the boiling tube and give a quick shake to mix. Connect the boiling tube to the delivery tube securely. When the first bubble reaches the top of the burette, start the stop-clock and read off the initial volume. Record the burette reading every 20 seconds until a constant volume is achieved. 4. Repeat the process. There is a lot of potential for experimental error, so repeats and the use of a mean are advisable. Mean (x̄) = Σx/n © Medify
Add to favourites

Clean, dry glassware should always be used in any experiment where concentration is important.
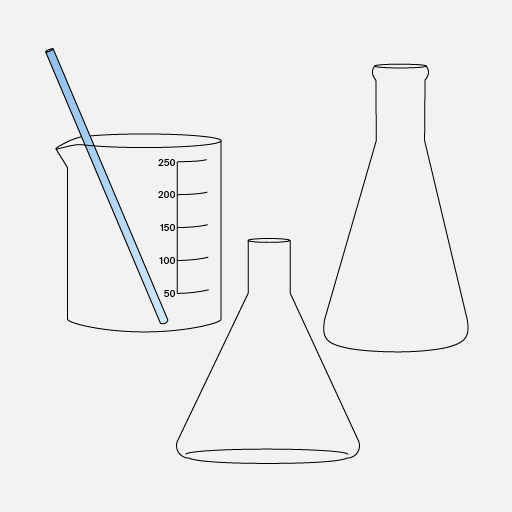
An illustration showing a graduated beaker with a blue stirring rod, a round-bottom flask, and a conical flask.
Do

Ensure glassware is clean and dry before use to prevent dilution or unwanted reactions.

Four laboratory glassware pieces, including two conical flasks, one round-bottom flask, and one beaker, all featuring orange stains.
Don't

Use wet or contaminated glassware – this can affect concentrations and skew results. Rinsing with distilled water directly prior to use is not appropriate here.

Add to favourites

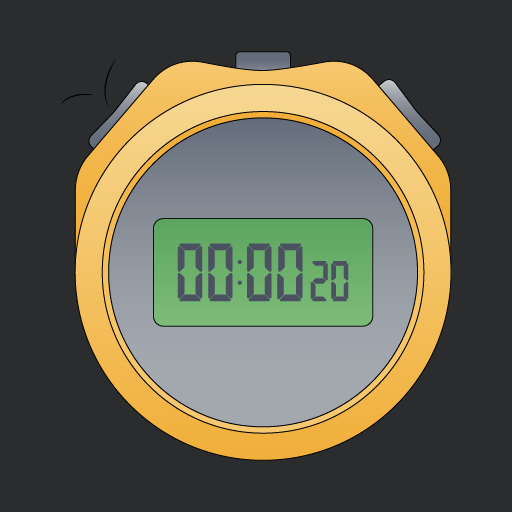
Accurately measuring time is essential in rate investigations.
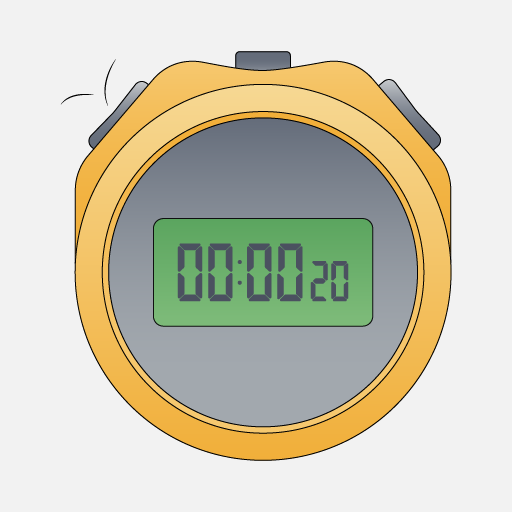
A round yellow stopwatch displaying the time 00:00:20 on a green digital screen.
Do

Start timing immediately after mixing reagents to ensure an accurate measurement of the reaction rate.

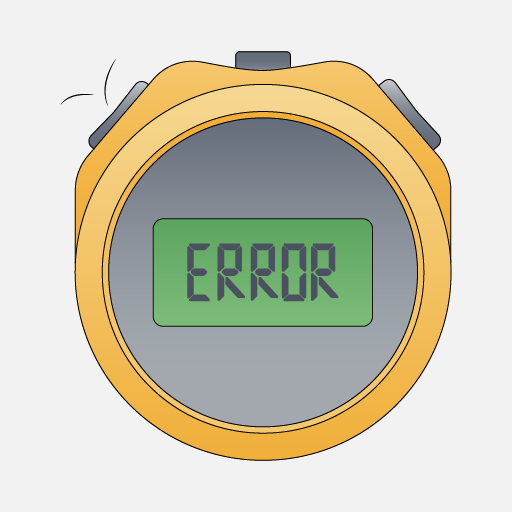
A round yellow stopwatch displaying the word 'ERROR' in large green letters on its screen.
Don't

Stop the timer to take measurements. The reaction hasn’t stopped, so neither should the timer.

Add to favourites

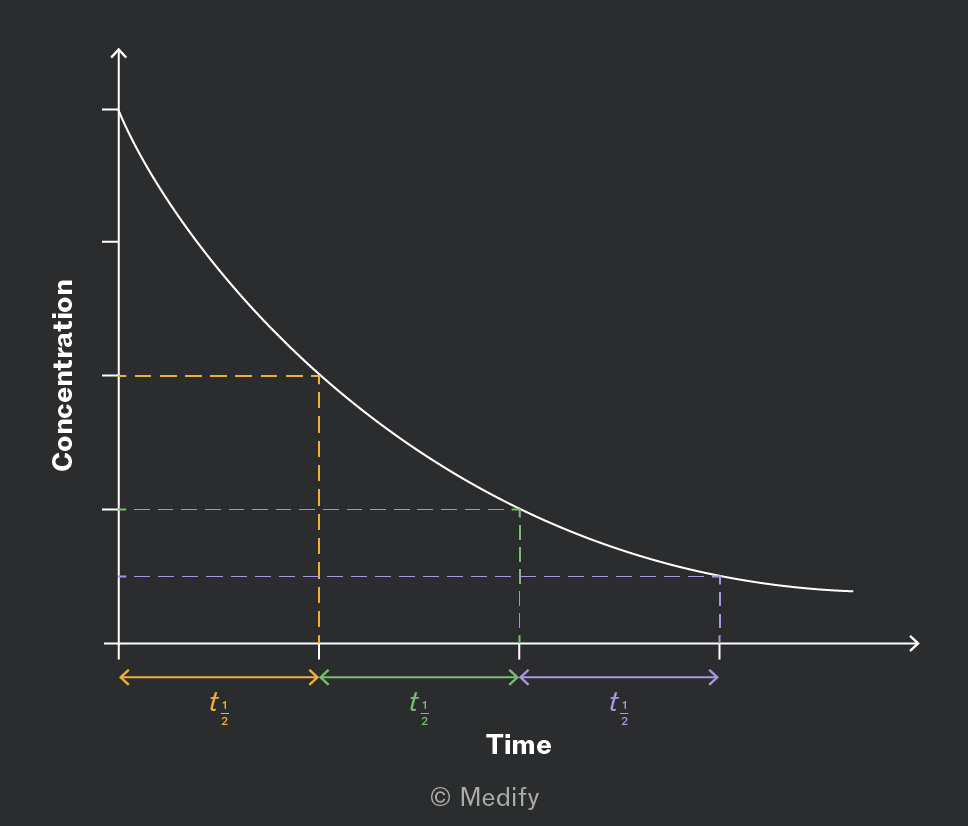
Use to convert the volume data into the concentration of remaining.

Then plot against time.

Determine successive half-livesfrom the graph and use their behaviour to infer reaction order.
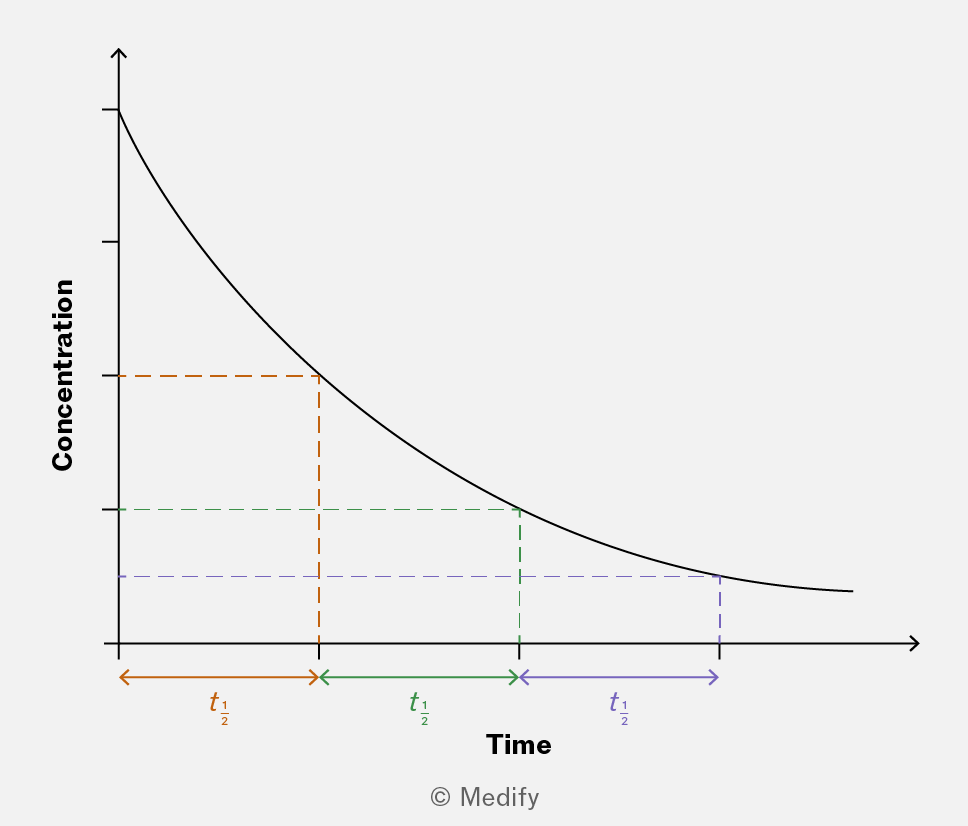
The image is a graph with a downward sloping curve representing concentration over time. The x-axis is labeled 'Time' and the y-axis is labeled 'Concentration.' The curve shows a decreasing concentration as time progresses. Three sets of dashed lines illustrate the half-life intervals, labeled as t1/2 in orange, green, and purple, respectively. Each set consists of a horizontal dashed line from the curve to the y-axis and a vertical dashed line from the curve to the x-axis. The horizontal dashed lines indicate equal intervals of concentration decrease, demonstrating the concept of half-life.
Add to favourites