Module 1: Practical chemistry for exams›PAG 11.2 - pH – titration curves

PAG 11.2 - pH – titration curves

An overview of PAG 11.2 - pH – titration curves
3 min

In OCR Chemistry Required Practical 11 (PAG 11.2), an acid–base titration is carried out using burettes and pipettes. A pH meter and probe are used to take pH readings after each addition of solution. Different combinations of strong and weak acids and alkalis are titrated.

After the titrations are complete, a graph is produced known as a pH curve, using a software program such as Excel.

Add to favourites

In OCR PAG 11.2: pH – titration curves, there are several important safety requirements to be aware of (beyond normal lab practice such as wearing goggles).

  • Ammonia vapour is an irritant if inhaled – ensure the room is well ventilated.
Add to favourites

Experimental method for OCR Chemistry Required Practical 11 (PAG 11.2) part 1 – strong acid and strong base titration
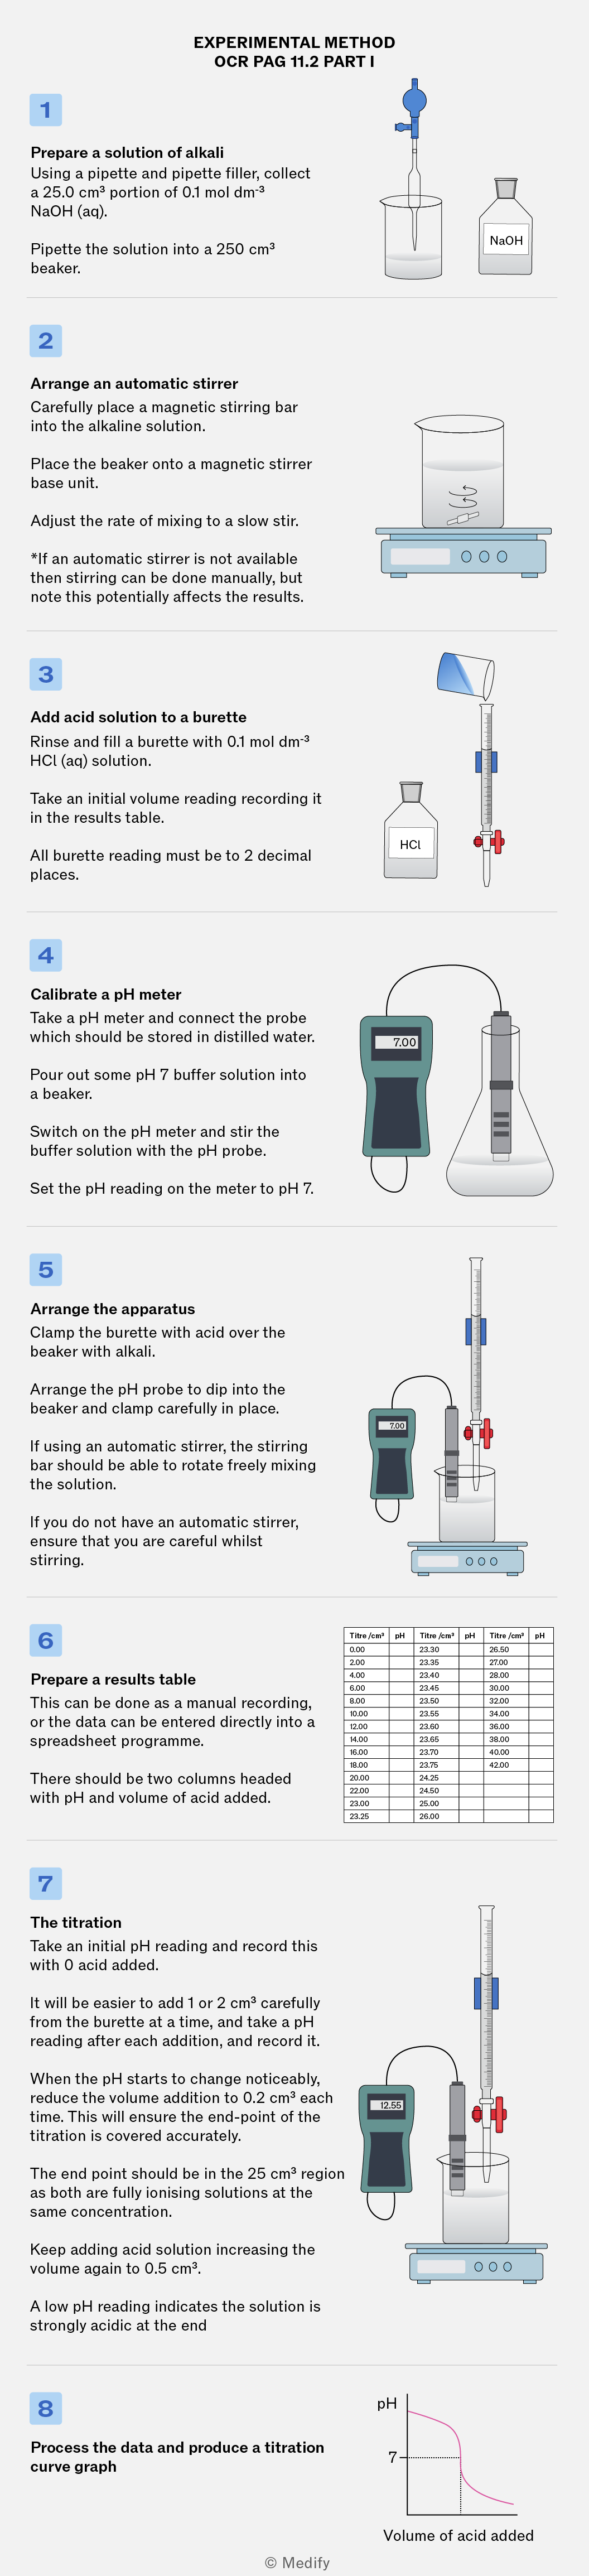
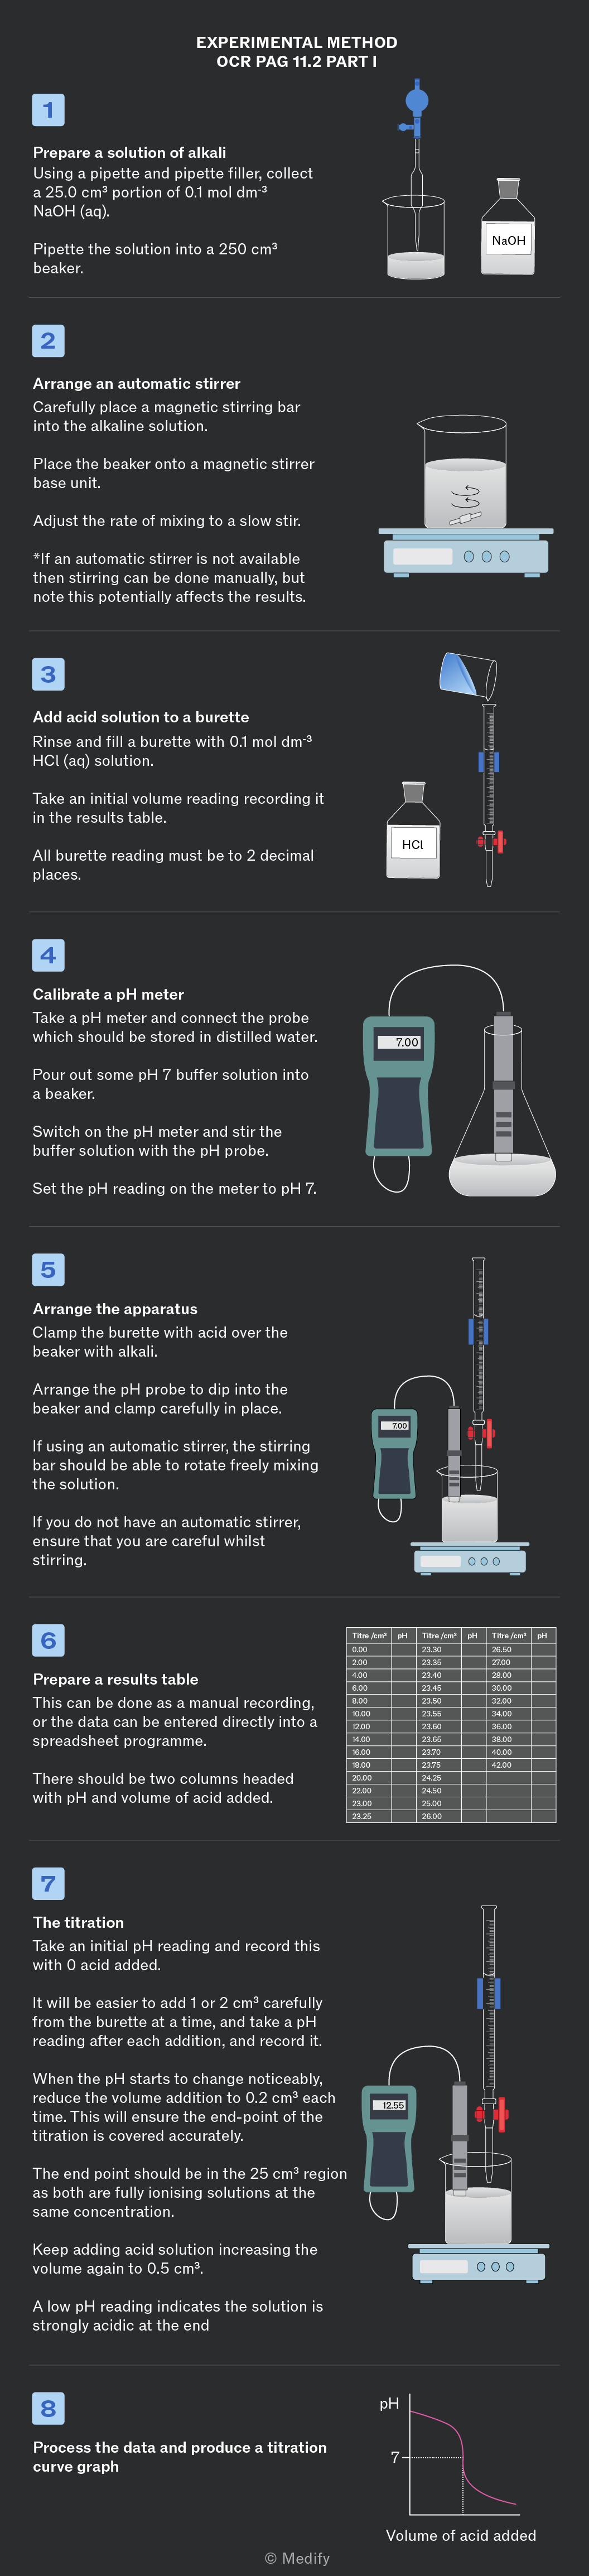
The image is a step-by-step guide labeled 'EXPERIMENTAL METHOD OCR PAG 11.2 PART I' for conducting a titration experiment. It contains eight steps: 1) Prepare a solution of alkali: A pipette and filler collect 25.0 cm³ of 0.1 mol dm⁻³ NaOH(aq) into a 250 cm³ beaker. 2) Arrange an automatic stirrer: Place a magnetic stirring bar in the beaker and adjust the mixing rate to slow. 3) Add acid solution to a burette: Rinse and fill with 0.1 mol dm⁻³ HCl(aq), record initial volume. 4) Calibrate a pH meter: Use a pH 7 buffer solution, set meter to pH 7. 5) Arrange the apparatus: Clamp the burette above the beaker and position the pH probe. 6) Prepare a results table: Two columns for pH and volume of acid added; sample data shown. 7) The titration: Add acid in small increments, noting the pH changes. 8) Process the data: Produce a titration curve graph showing pH against volume of acid added, with a curve indicating a pH drop. Diagrams accompany each step, illustrating the described actions.
Add to favourites

Experimental method for OCR Chemistry Required Practical 11 (PAG 11.2) part 2 – weak acid and strong base titration

This is exactly the same experiment and procedure but substitutes 0.1 mol dm-3 solution of ethanoic acid instead of the hydrochloric acid.

Other titration curves can be produced including strong acid + weak base, and weak acid + weak base.

Add to favourites

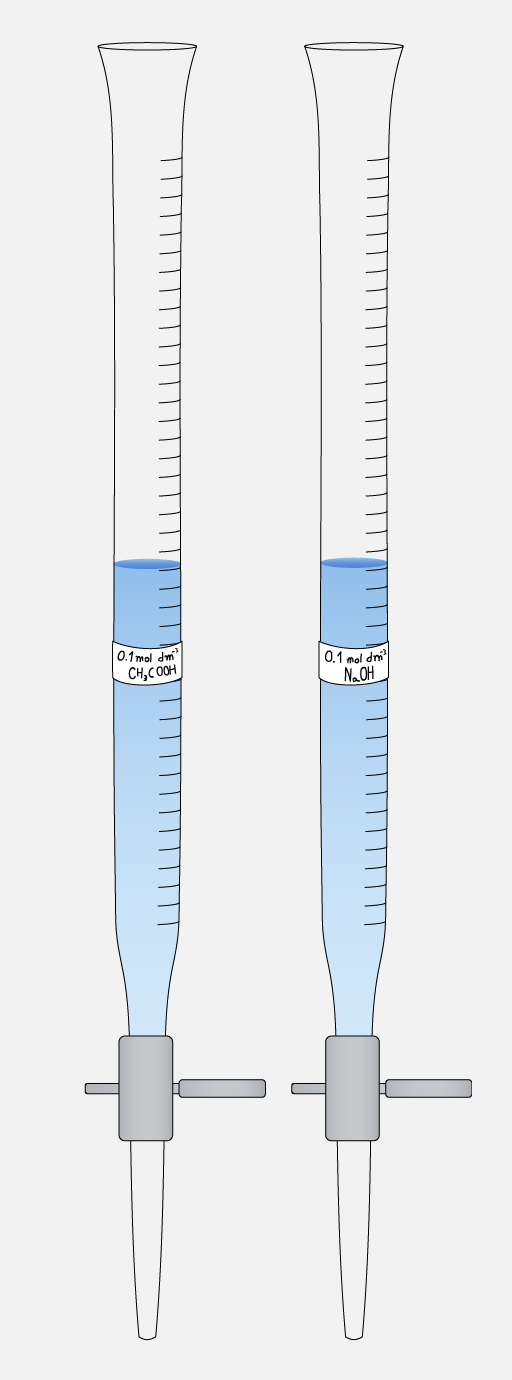
To prevent incorrect additions.

Two graduated cylinders containing blue liquids. The left cylinder is labeled '0.1 mol dm-3 CH3COOH' and the right cylinder is labeled '0.1 mol dm-3 NaOH'.
Do

Label any substance filled into clear glassware. This is especially important if similar looking materials are put into the same type of equipment.

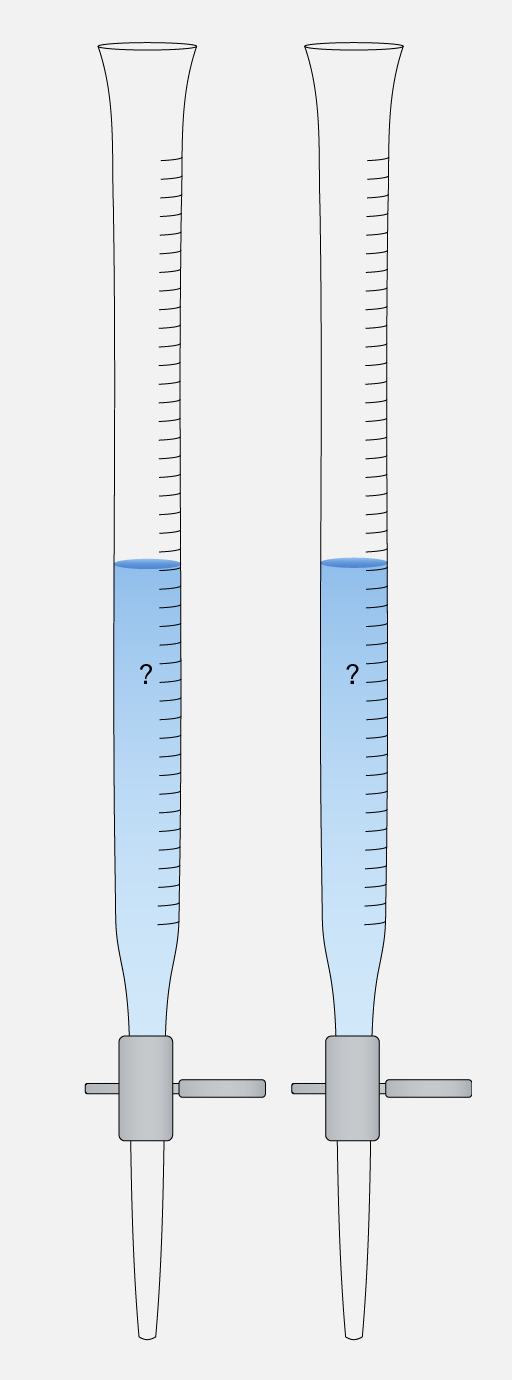
Two graduated cylinders with blue liquid at different levels, each marked with a question mark. The cylinders are connected to a valve system at the bottom.
Don't

Assume you will remember what is in glassware based on where you left it. Not only will incorrect chemicals impact your results, poor labelling can result in inappropriate handling of chemicals and potentially dangerous reactions.

Add to favourites

To record a clear titration curve with enough data around the equivalence point.
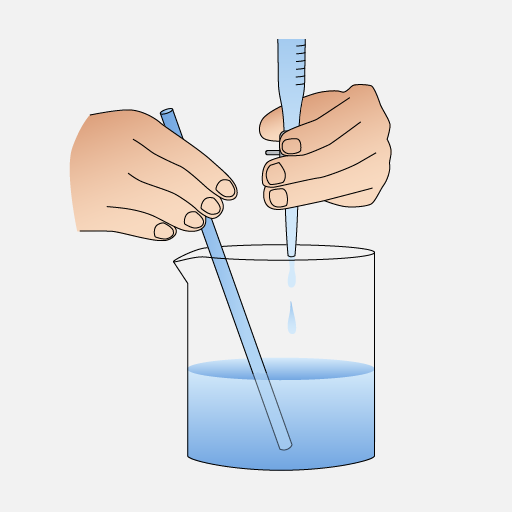
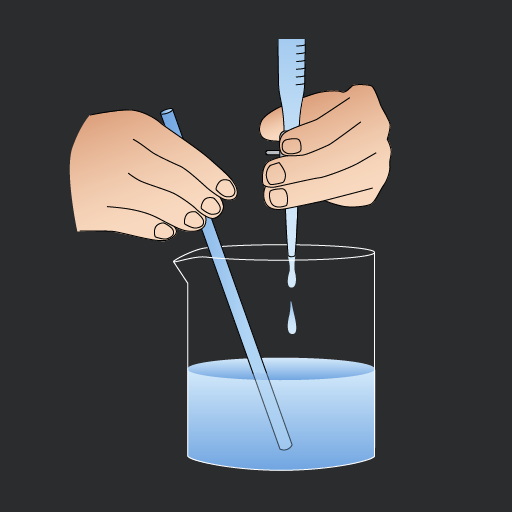
Two hands are holding a pipette and a stirring rod above a beaker filled with blue liquid. The pipette is dispensing a drop of liquid into the beaker.
Do

Use smaller increments () near the expected equivalence point.

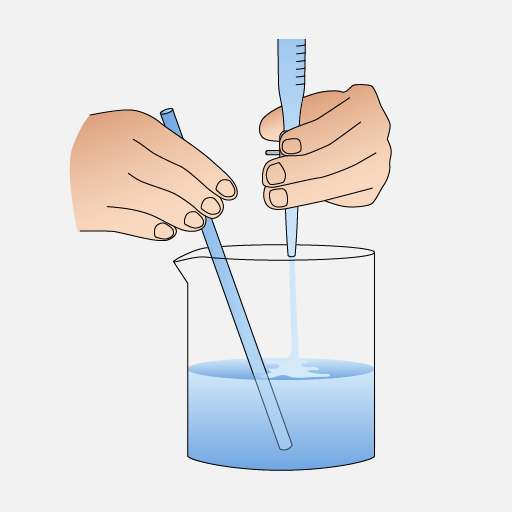
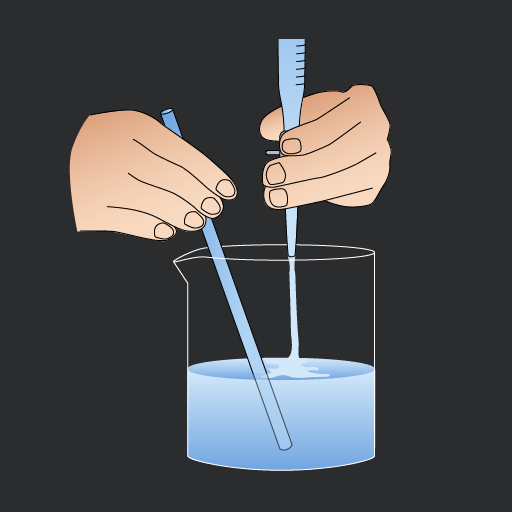
Two hands are holding a blue straw and a pipette, while a beaker filled with blue liquid is placed on a surface.
Don't

Continue with large additions throughout the whole titration – you will miss the sharp pH change.

Add to favourites

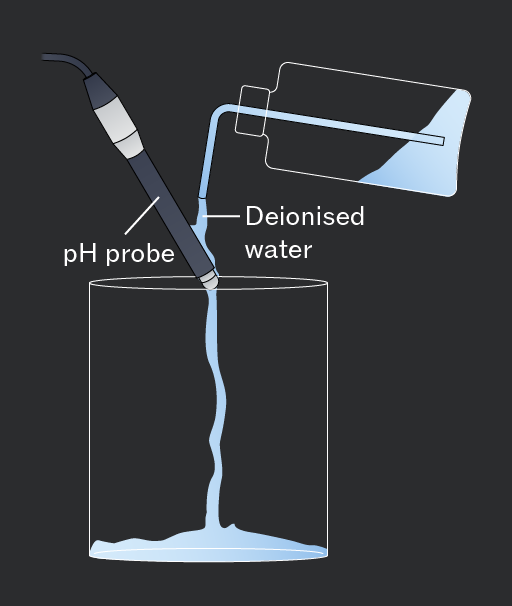
Prevent contamination on the pH probe that would affect your calibration and titration data.
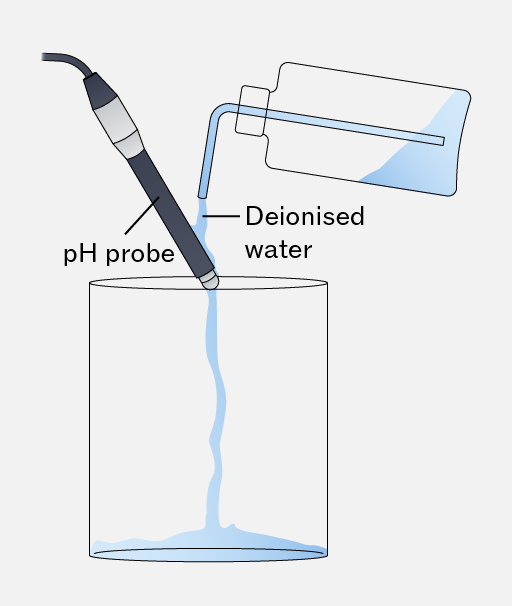
A pH probe is shown inserted into a container filled with deionised water. A bottle is pouring deionised water into the container.
Do

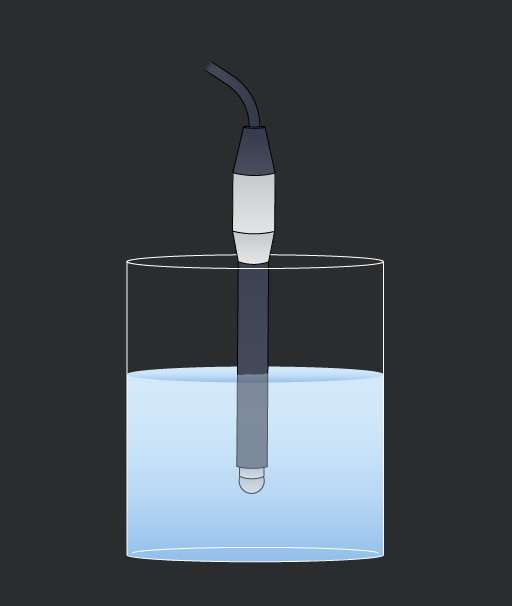
Rinse the pH probe with deionised water between every solution.

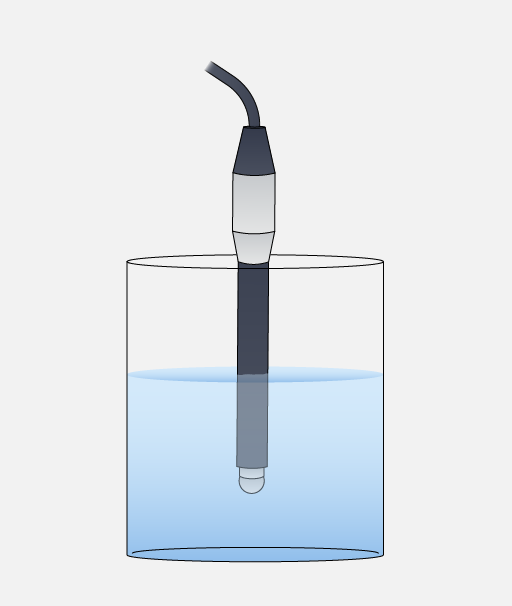
A glass container filled with blue water, with a probe submerged in it. The probe has a black and white design and a cable extending from the top.
Don't

Insert the probe into a new solution without rinsing – it can change the composition of the solution being measured and affect the accuracy results.

Add to favourites

To ensure accurate pH readings from the pH meter.
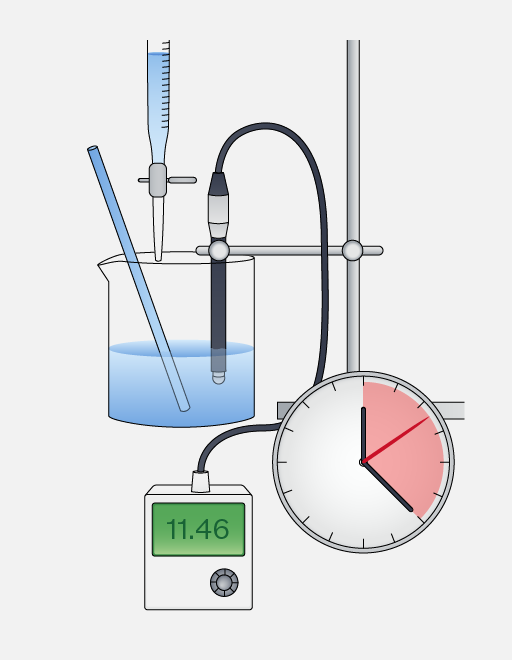
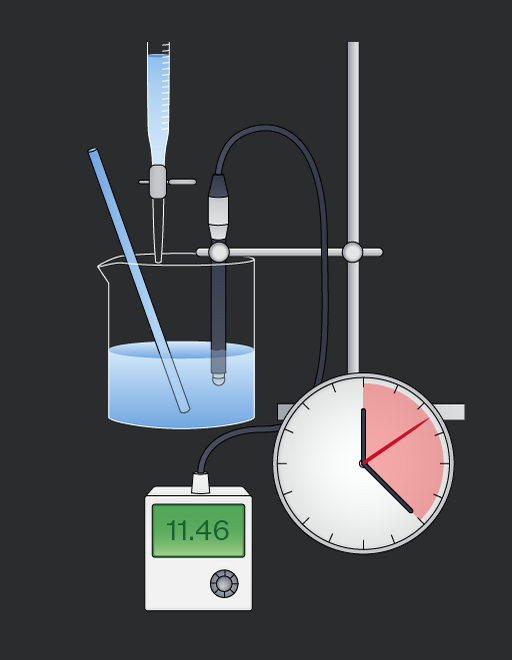
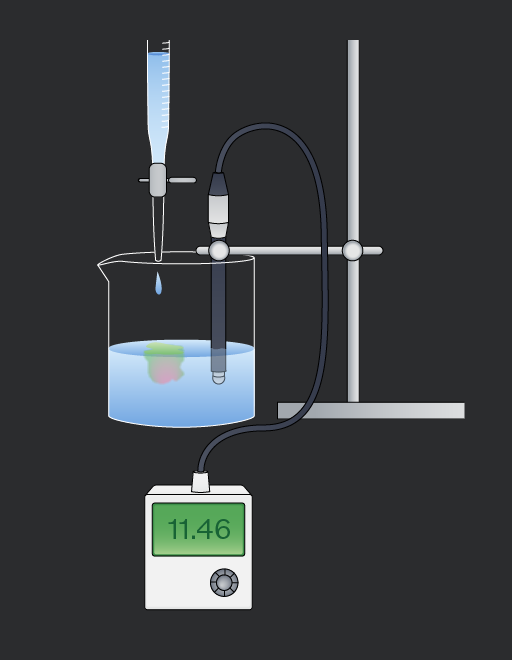
A laboratory setup featuring a beaker with blue liquid, a pipette, a probe, a digital display showing '11.46', and a circular clock with a red section.
Do

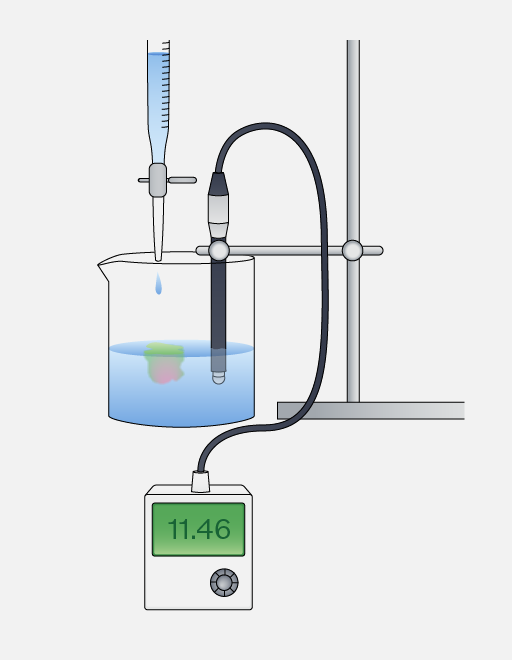
Stir the mixture and wait for the pH reading to stabilise before recording it.

A laboratory setup featuring a beaker filled with blue water, a drop of liquid falling from a pipette into the beaker, and a probe submerged in the water. A digital meter displays the value 11.46.
Don't

Rush taking measurements – before the reactants are fully mixed there can be local regions of variable pH. Unstable values can lead to an inaccurate pH curve.

Add to favourites

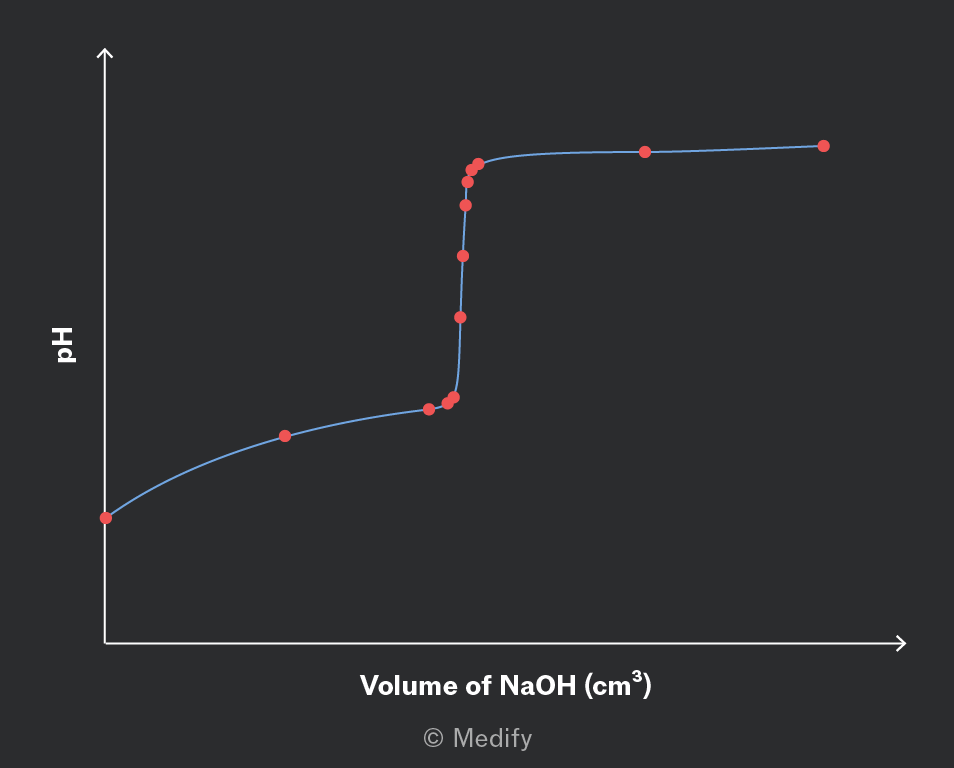
Plot pH against volume of titrant added and identify the equivalence point from the centre of the steep pH change.

More closely spaced readings around equivalence allow this region to be located more accurately.
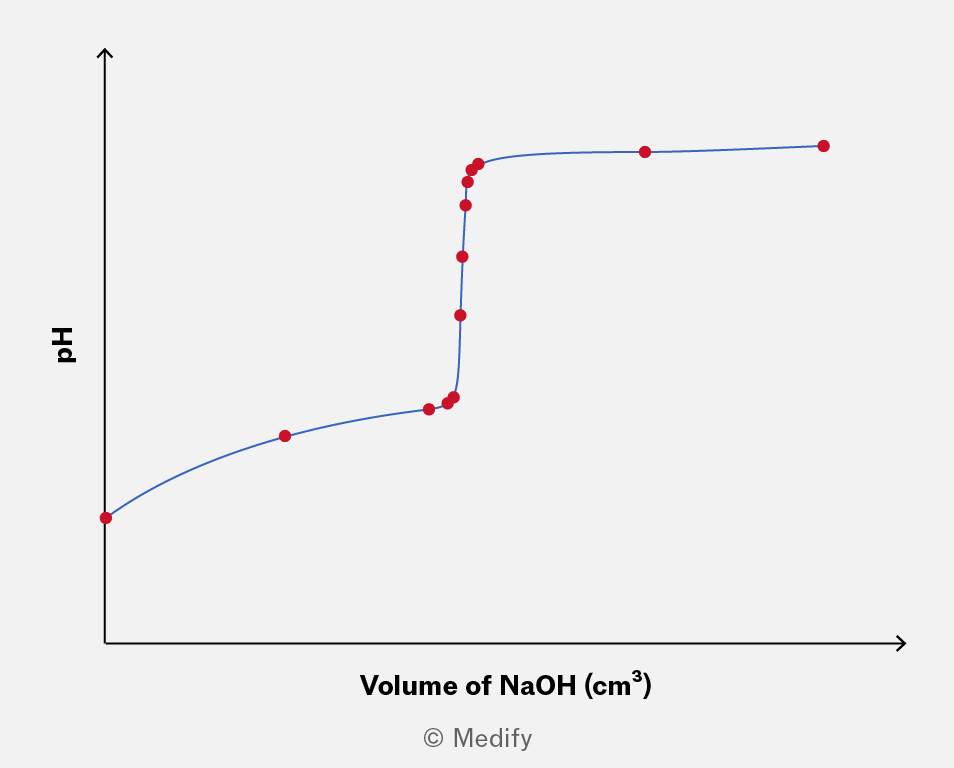
A titration curve graph with the y-axis labeled 'pH' and the x-axis labeled 'Volume of NaOH (cm³)'. The graph shows a curve starting at a lower pH, gradually increasing with a steep rise in the middle, and then leveling off at a higher pH. There are red circular markers plotted along the curve, indicating data points. The markers are distributed along the curve, with more concentration in the steep middle section. The graph is labeled with '© Medify' at the bottom.

Compare the pH range of different indicators with the steep section of the curve to determine which indicators would give a suitable end-point.

Add to favourites