
PAG 11.3 - pH – acids and buffers
On this page
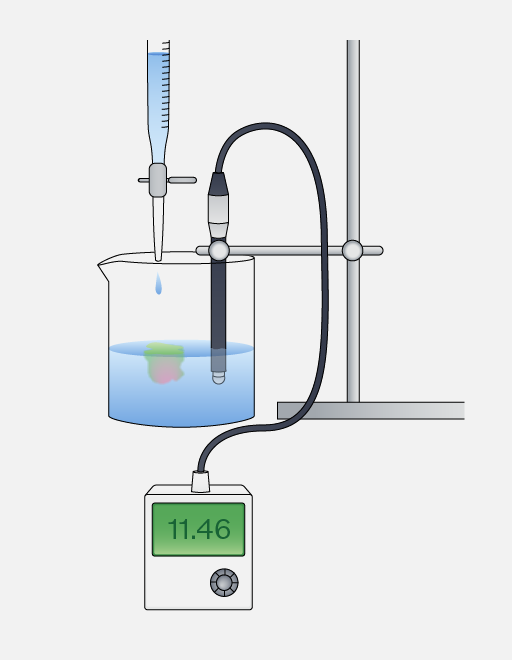
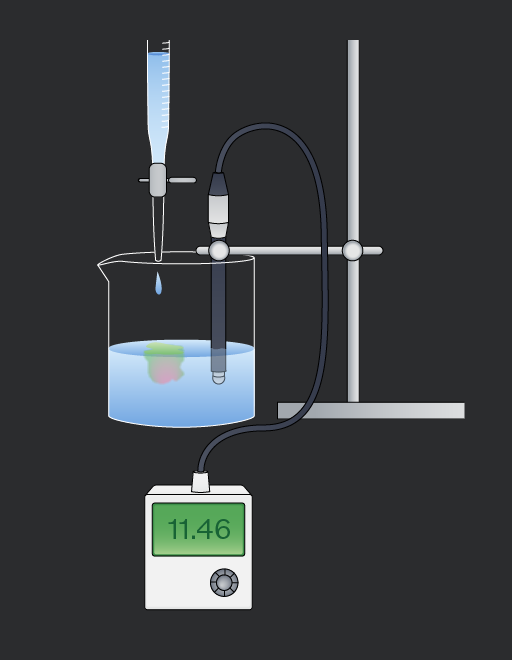
In OCR Chemistry Required Practical 11 (PAG 11.3), hydrochloric acid solutions with a range of concentrations are prepared by dilution and pH values are determined. Then a range of buffer solutions are prepared and their pH values are measured.
For both types of solutions, pH changes on addition of sodium hydroxide solution are measured.
In OCR PAG 11.3: pH – acids and buffers, there are several important safety requirements to be aware of (beyond normal lab practice such as wearing goggles).
- Dispose of chemicals as directed by your teacher.
Experimental method for OCR Chemistry Required Practical 11 (PAG 11.3) part 1 – preparing solutions of by serial dilution.
![Experimental method diagram titled 'OCR PAG 11.3 Part 1' with six numbered steps. Step 1: Prepare a results table with columns labeled '[HCl (aq)] mol dm⁻³', 'pH value', and 'pH value after NaOH added'. Concentrations listed are 0.1, 0.01, 0.001, and 0.0001 mol dm⁻³. Step 2: Calibrate the pH meter and probe using a pH 7 buffer solution and rinse the probe with distilled water. Step 3: Measure the pH of 0.1 mol dm⁻³ HCl by placing 10 cm³ of the solution in a boiling tube and recording the pH value, shown as 0.98. Step 4: Prepare other concentrations of HCl by diluting 10 cm³ of 0.1 mol dm⁻³ HCl with 90 cm³ of distilled water to create 0.01 mol dm⁻³ HCl, continuing for 0.001 and 0.0001 mol dm⁻³ dilutions. Step 5: Measure the pH of other dilutions using the pH meter and probe. Step 6: Add NaOH (aq) by mixing 40 cm³ of 0.0001 mol dm⁻³ HCl with 1 cm³ of 0.4 mol dm⁻³ NaOH, recording the pH value as 11.24.](https://d3nzlfkeryzt6j.cloudfront.net/1nazgwp2qo92p1bcxvj5472gd0vg)
![Experimental method diagram titled 'OCR PAG 11.3 Part 1' with six numbered steps. Step 1: Prepare a results table with columns labeled '[HCl (aq)] mol dm⁻³', 'pH value', and 'pH value after NaOH added'. Concentrations listed are 0.1, 0.01, 0.001, and 0.0001 mol dm⁻³. Step 2: Calibrate the pH meter and probe using a pH 7 buffer solution and rinse the probe with distilled water. Step 3: Measure the pH of 0.1 mol dm⁻³ HCl by placing 10 cm³ of the solution in a boiling tube and recording the pH value, shown as 0.98. Step 4: Prepare other concentrations of HCl by diluting 10 cm³ of 0.1 mol dm⁻³ HCl with 90 cm³ of distilled water to create 0.01 mol dm⁻³ HCl, continuing for 0.001 and 0.0001 mol dm⁻³ dilutions. Step 5: Measure the pH of other dilutions using the pH meter and probe. Step 6: Add NaOH (aq) by mixing 40 cm³ of 0.0001 mol dm⁻³ HCl with 1 cm³ of 0.4 mol dm⁻³ NaOH, recording the pH value as 11.24.](https://d3nzlfkeryzt6j.cloudfront.net/vteq9n0djlxhhbdo7p3i6loxt0mn)
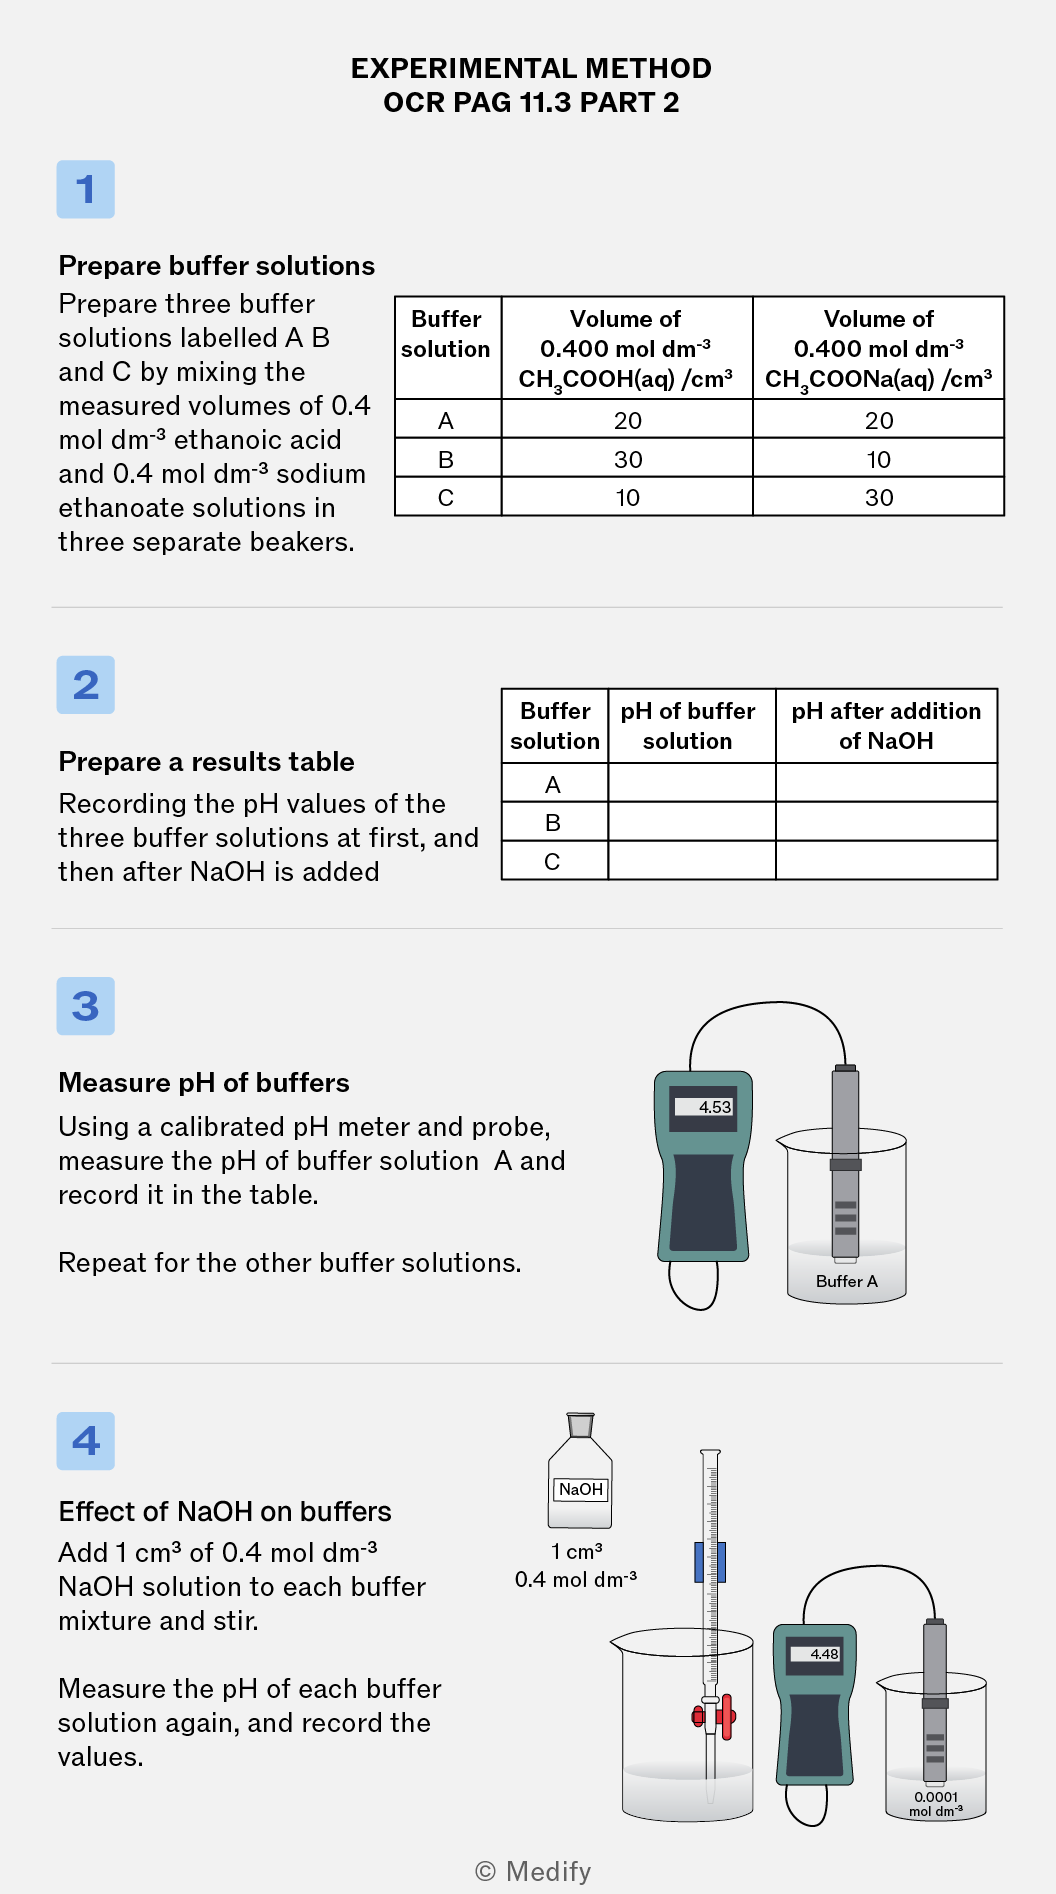
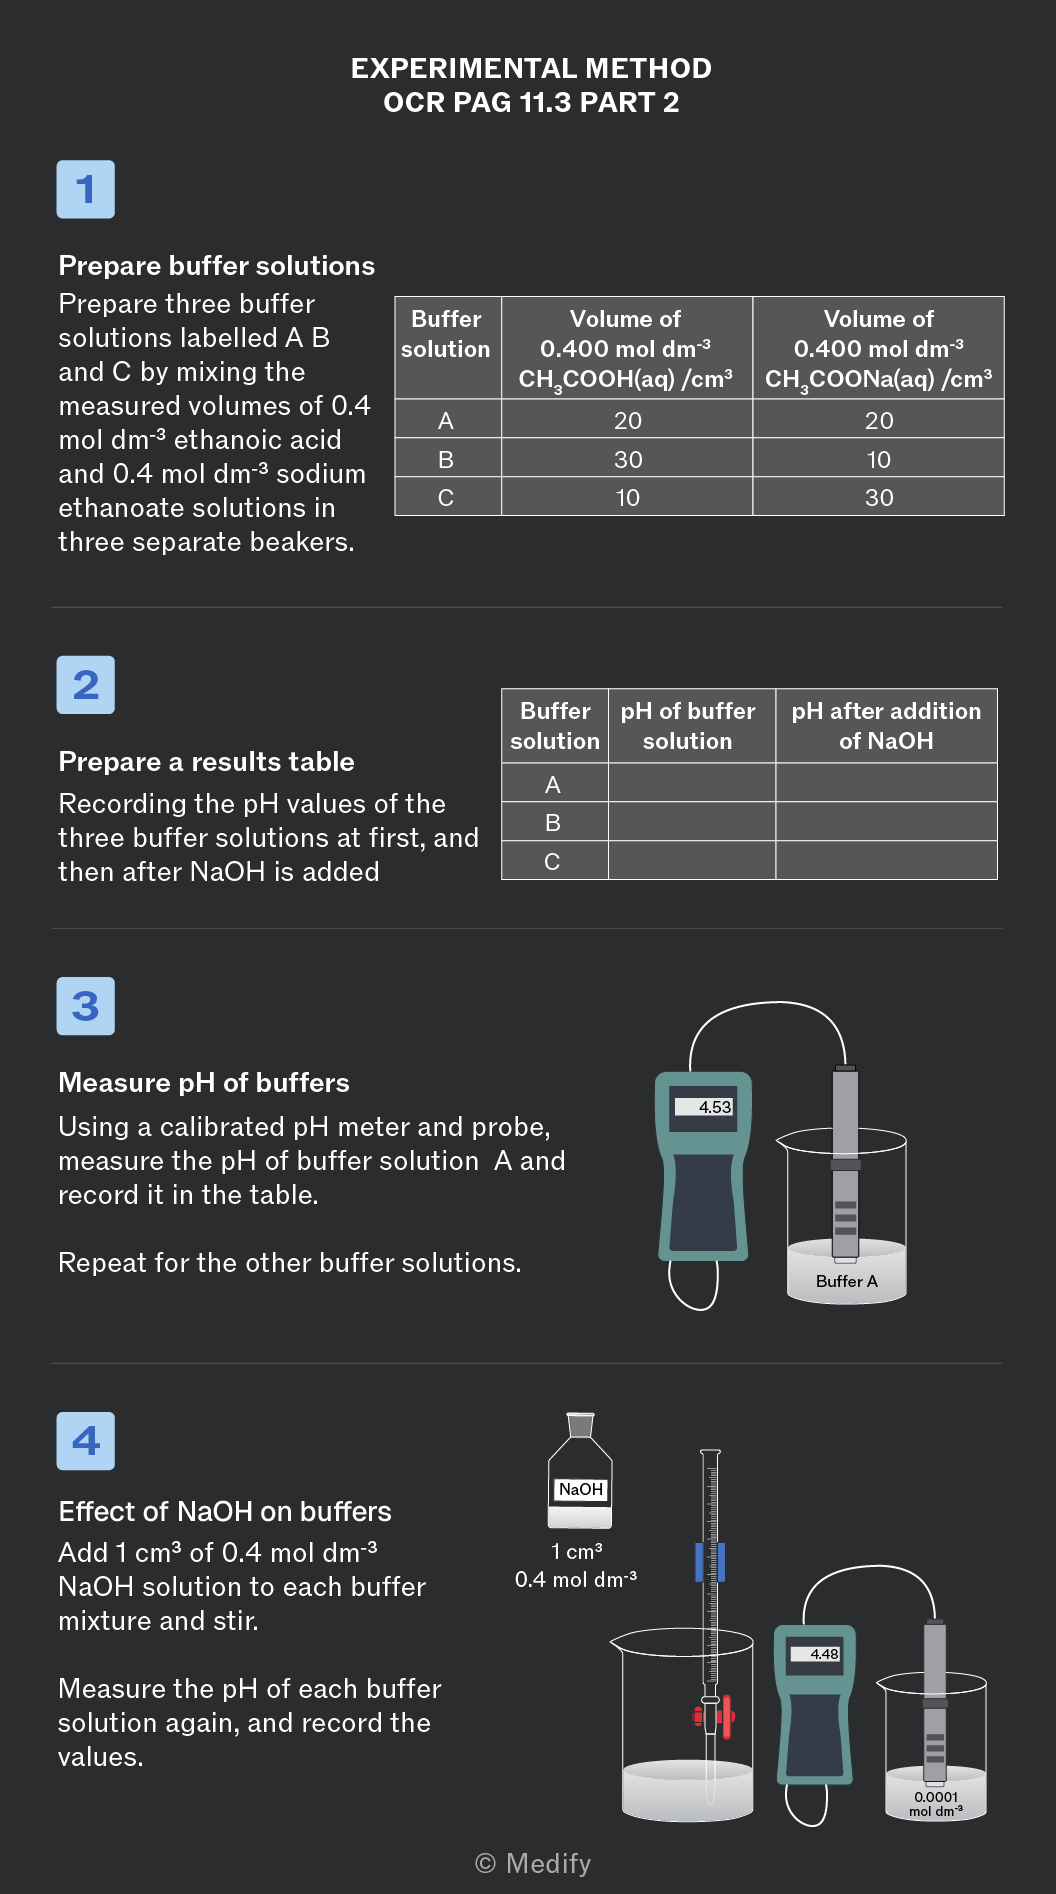
Experimental method for OCR Chemistry Required Practical 11 (PAG 11.3) part 2 – Action of buffer solutions
To prevent incorrect additions.
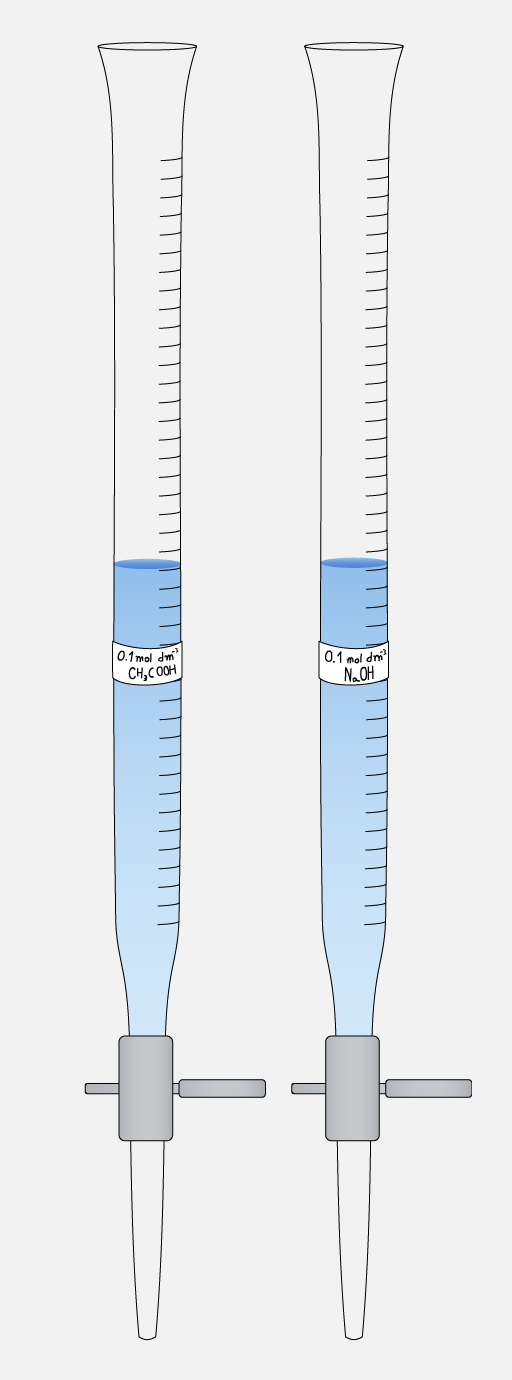
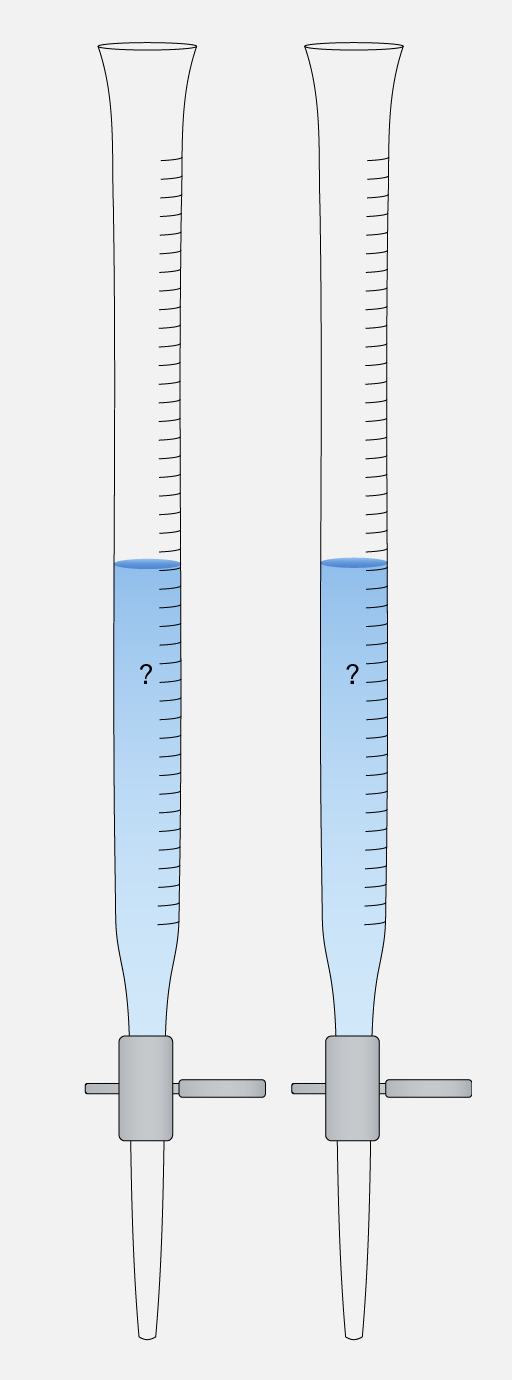
To record a clear titration curve with enough data around the equivalence point.
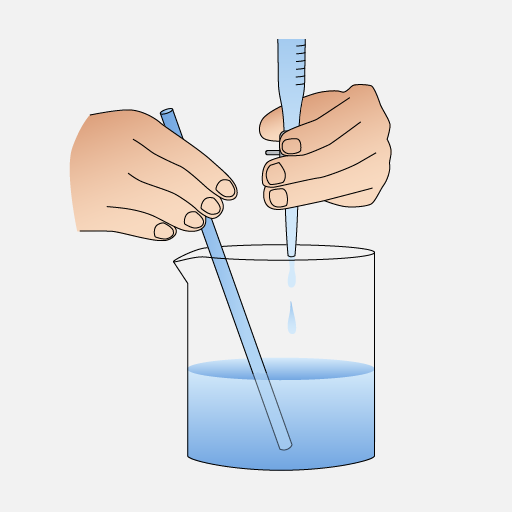
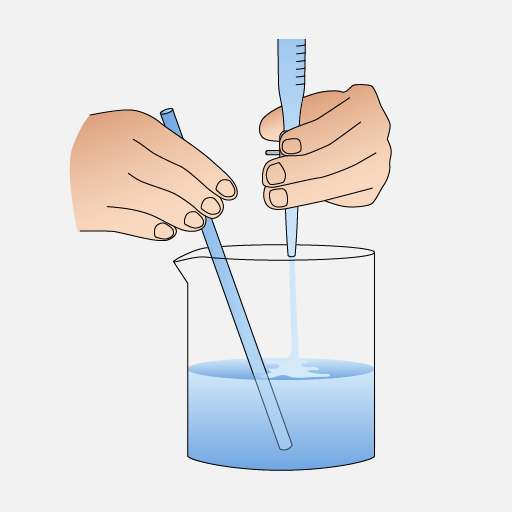
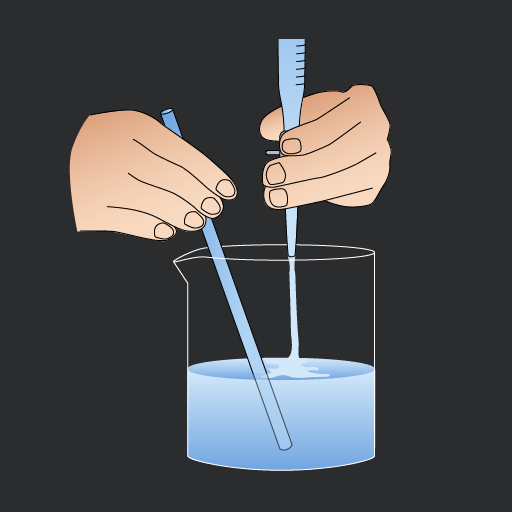
Prevent contamination on the pH probe that would affect your calibration and titration data.
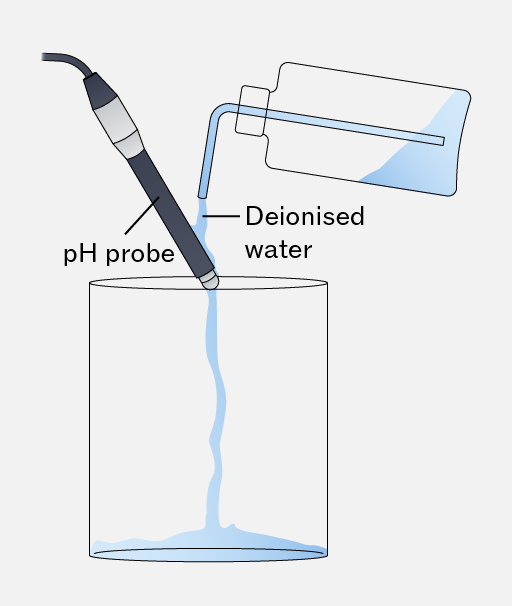
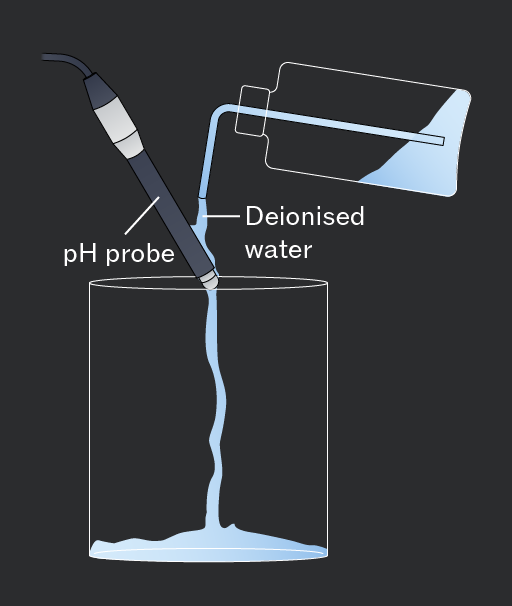
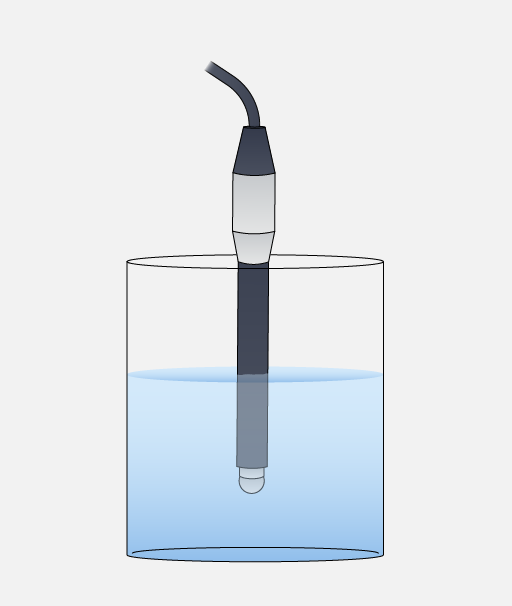
To ensure accurate pH readings from the pH meter.
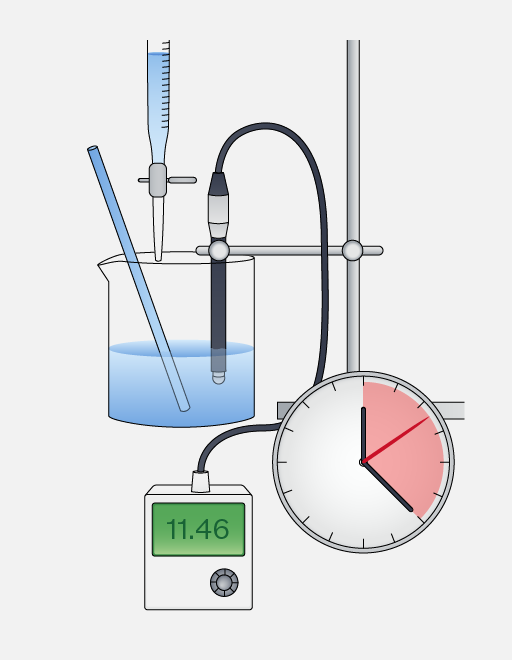
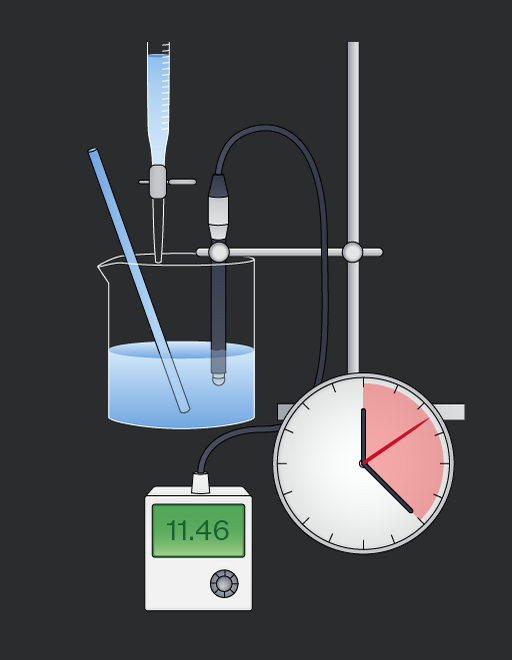
Calculate the expected pH of the solutions then compare with measured values, using:
For each buffer solution calculate using the relationship:
Then calculate the expected pH and compare this with the measured value, using:
Compare the change in pH when is added to the dilute and buffer solutions. The buffer shows a much smaller change in pH because the ethanoic acid reacts with the added